09 03 03 Web 2.0 Weekly
•
0 likes•447 views

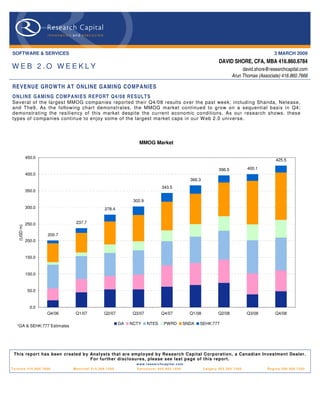
Several of the largest MMOG companies reported their Q4/08 results over the past week; including Shanda, Netease, and The9. The MMOG market continued to grow on a sequential basis in Q4.

Recommended
More Related Content
What's hot
What's hot (19)
Similar to 09 03 03 Web 2.0 Weekly
Similar to 09 03 03 Web 2.0 Weekly (20)
More from David Shore
More from David Shore (20)
Recently uploaded
Recently uploaded (20)
09 03 03 Web 2.0 Weekly
- 1. SOFTWARE & SERVICES 3 MARCH 2009 DAVID SHORE, CFA, MBA 416.860.6784 WEB 2.O WEEKLY david.shore@researchcapital.com Arun Thomas (Associate) 416.860.7666 REVENUE GROWTH AT ONLINE G AMING COMPANIES ONL IN E G AMI NG C OM P A NI E S R E PO RT Q4/ 08 R E S UL T S Several of the largest MMOG companies reported their Q4/08 results over the past week; including Shanda, Netease, and The9. As the following chart demonstrates, the MMOG market continued to grow on a sequential basis in Q4; demonstrating the resiliency of this market despite the current economic conditions. As our research shows, these types of companies continue to enjoy some of the largest market caps in our W eb 2.0 universe. MMOG Market 450.0 425.5 400.1 396.5 400.0 366.3 343.5 350.0 302.9 300.0 278.4 237.7 250.0 (USD m) 200.7 200.0 150.0 100.0 50.0 0.0 Q4/06 Q1/07 Q2/07 Q3/07 Q4/07 Q1/08 Q2/08 Q3/08 Q4/08 GA NCTY NTES PWRD SNDA SEHK:777 *GA & SEHK:777 Estimates This report has been created b y Anal ysts that are emplo yed b y Research Capital Corporation, a Canadian Investment Dealer. For further disclosures, please see last page of this report. www.researchcapital.com T o ro n t o 4 1 6 . 8 6 0 . 7 6 0 0 Montreal 514.399.1500 Vancouver 604.662.1800 Calgary 403.265.7400 Regina 306.566.7550
- 2. Page 2 THE WEB 2.0 UNIVERSE 85 public Web 2.0 companies identified: W e have identified 85 public companies for our W eb 2.0 universe, with a combined market cap of $27 billion. These include a wide variety of companies, including MMOG (Massive Multi-Player Online Gaming) companies, social networking software companies, media sharing companies, and social lending companies. See below for a summary of the full universe (Figure 1). The average market cap for the group is ~$320 million (but a median of only $26.6 million), with average trailing revenue of $133 million (median $39 million). The companies are also highly profitable, with an average EBITDA margin of 17.9%. On a valuation basis, the overall average is 3.8x trailing revenue (median 1.0x) and 8.1x trailing EBITDA (median 5.6x). Eleven of the companies have more than 500 employees. Comparable C ompany Analys is > Web 2.0 T rading C urrent US D Mark et US D L T M T otal US D L TM T otal E B IT DA TE V /L T M T E V /L T M C ompany Na me L T M as of Ti c ker E xc hange C urr enc y HQ Pric e C ap ($m) R ev ($m ) E B IT DA ($m ) % R evenue E B ITDA E mployees Acce lerize N ew Media, Inc. 9 /30/20 08 AC LZ OTCB B US D United S tates 0. 31 8. 3 3. 2 ( 4. 7) NM 4. 0 x - 20 Actoz S oft C o. , Ltd. 9 /30/20 08 A05 2790 K OS E KR W S outh Korea 10 ,4 50 5 8. 7 4 6. 5 8. 5 18 .3 % 0. 8 x 4.3 x NA AQ Inte ractive, Inc. 1 2/31 /2008 3838 TS E JP Y J a pan 32 ,9 00 1 8. 4 6 1. 9 5. 0 8. 0% - - NA As s ociated Media Holdings Inc. 6 /30/20 07 AS MH OTCP K US D United S tates 0. 00 0. 1 0. 1 ( 2. 3) NM 8. 0 x - 3 B igs tring C orp. 9 /30/20 08 BSGC OTCB B US D United S tates 0. 02 0. 9 0. 1 ( 2. 1) NM 3 1. 7x - 8 B eyond C omme rce, Inc. 9 /30/20 08 B YO C OTCB B US D United S tates 0. 64 2 6. 2 1. 1 ( 7. 7) NM 2 6. 8x - 25 B r ight T hings plc 9 /30/20 08 AIM: B GT AIM G BP United K ingdom 0. 02 2. 9 0. 2 ( 1. 6) NM 1 2. 3x - 9 B r oadW ebA s ia Inc. 9 /30/20 08 B W BA OTCP K US D United S tates 0. 75 6 3. 7 0. 0 ( 4. 6) NM - - 46 C DC C orp. 9 /30/20 08 C HIN. A Na s daqG S US D Hong K ong 0. 76 8 2. 0 428. 1 18 .8 4. 4% 0. 3 x 7.4 x 3 ,125 C hina G ateway C orpora tion 9 /30/20 08 CG W Y OTCB B US D United S tates 0. 00 0. 0 6. 7 ( 6. 6) -9 8. 9% 0. 0 x - 37 C hines e G amer International 9 /30/20 08 G T S M: 3083 GTS M TW D T a iwan 13 3. 00 322 . 2 3 6. 7 17 .3 47 .1 % 7. 3 x 15. 5x NA C ornerW orld C orporation 1 0/31 /2008 CW R L OTCB B US D United S tates 0. 15 7. 0 0. 6 3. 1 506. 8 % 1 3. 8x 2.7 x NA DAD A S pA 9 /30/20 08 C M: DA CM E UR Italy 5. 00 102 . 0 213. 3 34 .1 16 .0 % 0. 7 x 4.2 x 5 74 DXN Holdings B hd 1 1/30 /2008 DX N K LS E MY R Ma lays ia 0. 33 2 0. 6 7 4. 5 9. 9 13 .3 % 0. 5 x 4.0 x NA Digita lP os t Inter active, Inc. 9 /30/20 08 DG LP OTCB B US D United S tates 0. 01 0. 4 0. 4 ( 3. 3) NM 3. 2 x - 11 Digita lT own, Inc. 1 1/30 /2008 DG T W OTCB B US D United S tates 2. 75 7 4. 7 NM ( 2. 5) NM - - 3 Dolphin Digita l Me dia , Inc. NA DP DM OTCB B US D United S tates 0. 45 2 1. 9 NA NM NM - - 6 E olith C o. Ltd. 1 2/31 /2007 A04 1060 K OS E KR W S outh Korea 5 20 1 5. 4 1 5. 9 ( 0. 0) -0 .3 % 1. 0 x - NA E xtensions, Inc. 9 /30/20 08 E XT I OTCP K US D United S tates 0. 20 1 8. 9 NM NM NM - - 2 F ina ncia l Me dia Group, Inc. 1 1/30 /2008 F NG P OTCB B US D United S tates 0. 03 2. 0 6. 8 1. 2 18 .3 % 0. 2 x 0.9 x 22 F luid Mus ic C anada , Inc. 9 /30/20 08 T S X: F MN TS X CAD United S tates 0. 50 2 0. 4 4. 2 ( 8. 6) NM 1. 9 x - 29 F rogs te r Inte ractive P ictures A G 6 /30/20 08 FR G XT R A E UR G er many 4. 05 1 2. 0 5. 1 ( 3. 1) -6 0. 6% 2. 3 x - NA Ga mania Digital E nterta inme nt C o. , L td. 9 /30/20 08 6180 GTS M TW D T a iwan 2 2. 40 9 7. 0 106. 0 17 .9 16 .9 % 0. 7 x 4.0 x NA Ga meO n C o L td. 1 2/31 /2008 3812 TS E JP Y J a pan 93 ,0 00 9 2. 3 7 6. 6 20 .3 26 .4 % 0. 5 x 1.7 x NA GeoS entric O yj 9 /30/20 08 G E O 1V HL S E E UR F inland 0. 03 2 3. 5 5. 2 (11 .9) NM 3. 6 x - 92 Giant Interactive G roup, Inc. 9 /30/20 08 GA NY S E US D C hina 6. 29 1, 495. 2 244. 8 1 55. 4 63 .5 % - - 1 ,016 GigaMe dia L td. 9 /30/20 08 G IG M Na s daqG S US D T a iwan 5. 09 275 . 0 200. 5 48 .0 23 .9 % 1. 0 x 4.4 x 9 75 Gravity C o., Ltd 9 /30/20 08 GRVY Na s daqG M US D S outh Korea 0. 69 1 9. 2 3 1. 2 6. 0 19 .2 % - - 6 36 Gree, Inc. 6 /30/20 08 T S E : 3 632 TS E JP Y J a pan 4 ,4 00 1, 007. 8 3 0. 2 10 .9 36 .0 % 3 1. 3x - NA GungHo Online E ntertainme nt, Inc. 9 /30/20 08 3765 OSE JP Y J a pan 117 ,0 00 137 . 4 104. 9 15 .4 14 .7 % 1. 1 x 7.3 x NA HanbitS oft, Inc. 9 /30/20 08 A04 7080 K OS E KR W S outh Korea 3 ,0 40 4 2. 4 4 4. 2 (11 .3) -2 5. 6% 0. 6 x - NA IA C /Inte rA ctiveC orp. 1 2/31 /2008 IAC I Na s daqG S US D United S tates 1 4. 80 2, 085. 3 1 , 445 . 1 64 .6 4. 5% 0. 2 x 5.2 x NA IA S E ne rgy, Inc. 1 0/31 /2008 IAS C . A OTCB B US D C a na da 0. 08 5. 6 0. 0 ( 0. 9) NM - - NA IdeaE dge, Inc. 1 2/31 /2008 O T C B B: ID AE OTCB B US D United S tates 0. 43 1 8. 2 0. 0 ( 4. 6) NM - - NA is ee media Inc. 9 /30/20 08 IE E T S XV CAD C a na da 0. 10 3. 8 1. 1 ( 4. 3) NM 1. 1 x - NA J umbuck E ntertainme nt P ty Ltd. 6 /30/20 08 AS X :J MB AS X A UD Aus tra lia 0. 41 1 2. 8 9. 9 4. 6 46 .0 % 0. 9 x 1.9 x 72 J umpT V Inc. 6 /30/20 08 T S X: J T V TS X CAD C a na da 0. 36 3 1. 8 1 1. 5 ( 1. 8) -1 5. 3% 3. 5 x - NA K a boos e Inc. 9 /30/20 08 T S X: K AB TS X CAD C a na da 0. 41 4 4. 0 5 7. 6 4. 4 7. 6% 0. 9 x 11. 6x NA K ings oft C o. Ltd. 9 /30/20 08 3888 S EHK HK D C hina 2. 51 347 . 4 106. 6 36 .0 33 .8 % 2. 4 x 7.1 x 1 ,660 Lingo Media C orpora tion 9 /30/20 08 T S XV :L M T S XV CAD C a na da 0. 95 9. 5 3. 2 ( 1. 3) -4 2. 5% 3. 2 x - NA Live World Inc. 9 /30/20 08 L VW D OTCP K US D United S tates 0. 06 1. 9 1 1. 7 ( 1. 2) -1 0. 1% 0. 1 x - 73 LookS mar t, Ltd. 9 /30/20 08 L OO K Na s daqG M US D United S tates 1. 18 2 0. 1 6 9. 5 ( 2. 6) -3 .7 % - - 93 Magnitude Informa tion S ys tems Inc. 9 /30/20 08 MA GY OTCB B US D United S tates 0. 02 7. 9 0. 1 ( 3. 2) NM - - 13 Mixi, Inc. 1 2/31 /2008 2121 TS E JP Y J a pan 359 ,0 00 564 . 2 120. 5 45 .8 38 .0 % 3. 8 x 10. 0x NA Mode rn T imes Gr oup Mtg AB 1 2/31 /2008 MT G B OM SE K S weden 11 7. 50 843 . 5 1 , 434 . 5 2 29. 3 16 .0 % 0. 9 x 5.6 x NA Moggle , Inc 1 2/31 /2008 MMO G OTCB B US D United S tates 2. 00 7 2. 6 NM ( 1. 1) NM - - 3 MOK O. mobi L imited 6 /30/20 08 MK B AS X A UD Aus tra lia 0. 05 2. 3 1. 3 ( 2. 0) NM 0. 9 x - NA NE O W IZ G ame s C orpora tion 1 2/31 /2007 A09 5660 K OS E KR W S outh Korea 30 ,3 50 185 . 7 114. 8 30 .8 26 .9 % 1. 6 x 5.8 x NA NetDra gon WebS oft, Inc. 9 /30/20 08 777 S EHK HK D C hina 2. 93 199 . 7 9 5. 1 46 .2 48 .6 % 0. 2 x 0.5 x 1 ,482 Netea s e. com Inc. 1 2/31 /2008 NT E S Na s daqG S US D C hina 2 0. 45 2, 516. 4 450. 5 2 92. 9 65 .0 % - - NA NeXplore C or por ation 9 /30/20 07 NX P C OTCP K US D United S tates 0. 95 5 3. 0 NM ( 4. 9) NM - - 19 Ngi G roup Inc. 1 2/31 /2008 2497 TS E JP Y J a pan 20 ,9 80 2 6. 6 101. 0 31 .1 30 .8 % - - NA Northgate T e chnologies L imited 1 2/31 /2008 5900 57 BSE INR India 3 4. 20 2 2. 8 128. 7 22 .6 17 .6 % 0. 2 x 1.0 x 2 86 Open T ext C orp. 1 2/31 /2008 OTE X Na s daqG S US D C a na da 3 0. 57 1, 586. 6 769. 3 1 95. 0 25 .3 % 2. 2 x 8.8 x 3 ,400 Openwa ve S ys tems Inc. 1 2/31 /2008 OPW V Na s daqG S US D United S tates 0. 79 6 5. 9 199. 6 (10 .2) -5 .1 % - - 6 27 P erfect W orld C o., Ltd. 9 /30/20 08 PWRD Na s daqG S US D C hina 8. 91 508 . 3 186. 6 99 .8 53 .5 % - - 1 ,401 P hotoC hannel Ne tworks Inc. 1 2/31 /2008 T S XV :P N T S XV CAD C a na da 1. 73 4 5. 0 1 5. 5 ( 0. 8) -5 .3 % 2. 8 x - NA Quepas a C orp. 9 /30/20 08 QPS A Na s daqC M US D United S tates 1. 19 1 5. 1 0. 1 (11 .8) NM - - 63 OAO R B C Informa tion S ys tems 1 2/31 /2007 RB CI RTS US D R us s ia 0. 30 4 1. 6 131. 0 17 .1 13 .1 % 0. 0 x 0.1 x NA S handa Intera ctive E nte rtainment L td. 1 2/31 /2008 S NDA Na s daqG S US D C hina 3 0. 76 2, 134. 2 521. 3 2 39. 5 46 .0 % - - NA S hutterfly, Inc. 1 2/31 /2008 S F LY Na s daqG S US D United S tates 7. 84 197 . 2 213. 5 28 .4 13 .3 % 0. 5 x 3.8 x NA S K C ommunications C o. , Ltd. 1 2/31 /2007 A06 6270 K OS E KR W S outh Korea 6 ,1 60 161 . 2 132. 0 12 .4 9. 4% 1. 2 x 13. 0x NA S NA P Inter active, Inc. 9 /30/20 08 S T VI OTCB B US D United S tates 0. 95 1 0. 1 2. 3 0. 2 10 .1 % 3. 9 x 38. 9x 5 S NM G lobal Holdings 9 /30/20 08 S NMN OTCP K US D United S tates 0. 00 0. 0 2. 0 ( 0. 7) -3 4. 8% 1. 1 x - 33 S ocial Me dia V enures , Inc. 1 2/31 /2008 S MVI OTCP K US D United S tates 0. 60 0. 0 0. 1 ( 0. 1) -6 0. 5% 0. 0 x - NA S park Networks , Inc. 9 /30/20 08 L OV AME X US D United S tates 2. 44 5 2. 3 6 0. 1 11 .7 19 .5 % 0. 8 x 4.1 x 1 76 S pectrumDNA, Inc. 9 /30/20 08 S PX A OTCB B US D United S tates 0. 10 4. 6 0. 1 ( 2. 7) NM - - 7 T encent Holdings Ltd. 9 /30/20 08 700 S EHK HK D C hina 4 4. 15 10 ,2 29.9 902. 5 4 47. 1 49 .5 % 1 2. 2x 24. 7x 6 ,039 T he P ar ent C ompany 8/2/2 008 K IDS . Q OTCP K US D United S tates 0. 02 0. 4 112. 0 (13 .5) -1 2. 0% 0. 2 x - 3 47 T he 9 Limited 1 2/31 /2008 NC T Y Na s daqG S US D C hina 1 0. 79 289 . 4 249. 5 84 .0 33 .7 % - - NA T he S tre et.com, Inc. 1 2/31 /2008 TS CM Na s daqG M US D United S tates 1. 78 5 4. 1 7 1. 9 7. 7 10 .8 % - - NA T ree . C om, Inc. 1 2/31 /2008 TR E E Na s daqG M US D United S tates 3. 93 3 6. 8 228. 6 (27 .0) -1 1. 8% 0. 2 x - NA Unis e rve C ommunications C or p. 1 1/30 /2008 T S XV :U S S T S XV CAD C a na da 0. 05 1. 0 2 3. 2 0. 1 0. 4% 0. 1 x 31. 3x NA Unite d Online Inc. 1 2/31 /2008 UNT D Na s daqG S US D United S tates 4. 40 361 . 3 669. 4 1 53. 9 23 .0 % 1. 0 x 4.4 x NA UOMO Media, Inc 1 0/31 /2008 UO MO OTCB B US D C a na da 0. 07 6. 0 0. 5 ( 0. 4) -9 1. 6% 1 3. 3x - NA VO IS , Inc. 1 2/31 /2008 V OIS OTCB B US D United S tates 0. 75 5. 4 0. 0 ( 1. 3) NM - - 4 W ebz en Inc. 1 2/31 /2008 W ZE N Na s daqG M US D S outh Korea 0. 89 1 0. 6 1 8. 1 ( 1. 8) -1 0. 1% - - 3 30 W izz a rd S oftwa re C orporation 9 /30/20 08 W ZE AME X US D United S tates 0. 54 2 4. 4 6. 2 ( 6. 5) NM 3. 9 x - 1 10 W ooz yF ly, Inc. 9 /30/20 08 W ZY F OTCB B US D United S tates 0. 15 2. 6 0. 0 NM NM - - 14 W orlds .com Inc. 9 /30/20 08 W DDD OTCB B US D United S tates 0. 18 9. 4 0. 1 NM NM - - 1 W ynds torm C orporation NA W YN D OTCB B US D United S tates 0. 12 2. 2 NA NM NM - - NA XING A G 9 /30/20 08 O 1B C XT R A E UR G er many 2 8. 77 188 . 3 3 9. 4 15 .3 38 .8 % 3. 4 x 8.8 x 1 61 Y edangO nline C orp. 1 2/31 /2007 A05 2770 K OS E KR W S outh Korea 6 ,6 50 6 6. 2 4 3. 6 9. 8 22 .4 % 1. 5 x 6.7 x NA Y nk K or ea Inc. 1 2/31 /2007 A02 3770 K OS E KR W S outh Korea 3 ,5 45 5. 5 1 2. 4 ( 0. 9) -7 .6 % 0. 4 x - NA ZipL ocal Inc. 9 /30/20 08 T S XV :ZIP T S XV CAD C a na da 0. 02 0. 9 2. 7 ( 3. 7) NM 0. 6 x - NA High 10 ,2 29.9 1 ,4 45 .1 44 7. 1 506. 8 % 3 1. 7x 38. 9x 6, 039 Low 0. 0 0. 0 -2 7. 0 -9 8. 9% 0. 0 x 0.1 x 1 Average 320.7 133.2 29.0 17.9% 3.8x 8.1x 524 Median 2 6. 6 39.4 0 .2 15 .3 % 1. 0 x 5.6 x 73 Figure 1. Web 2.0 Universe Summary Source. Capital IQ
- 3. Page 3 C A P I T A L M A R K E T S A C T I V I T Y (M & A A N D F I N A N C I N G ) Twitter raises $35 million: The largest W eb 2.0 financing of the last three months remains the $35 million raised by Twitter (Figure 2). Overall, there have been 25 financings announced in February, totalling $184.6 million, or $7.4 million on average. The average value for February was above the $7.0 million average for January, with four financings over $15 million in February (Twitter, Synthasite, Tremor Media, and Offerpal Media) vs. no deals over $15 million in January. For additional details, see Figure 29 (at end of note). Financing - Last Three Months 40.0 35.0 30.0 25.0 Feb-09 (US$m) 20.0 Jan-09 Dec-08 15.0 10.0 5.0 0.0 Emergent Game Technologies FamilyLink.com ChakPak Cake Financial Pulse Entertainment Tremor Media Go Internet Media One True Media Imagini DECA GoFish FooMojo JibJab Jackbe FetchDog mEgo MMO Life RatePoint IMVU Tumblr TextDigger Play Hard Sports E-Global Sports Network Clickpass Geni Tvinci Overlay.TV Outbrain Nurien Taptu Tvtrip Social Median SocialMedia Oodle Wamba Tagged Playdo Mixpo 7 Billion People DotBlu Hubdub CoveritLive Identi.ca OneSpot Outright NetShelter Aster Data Systems SundaySky Fliqz Motionbox Gbox Mendeley Filtrbox Meez Blue Kai Xobni Synthasite Offerpal Media AdMob Scribd Snapmylife Virtual Fairground Snooth NewsGator VirtuOz Sportsblogs AboutUs WhistleBox StockTwits Angie's List fav.or.it Yodle Superfish Twitter Kewego Tripwolf InsideView Figure 2. Financings, Last Three Months Source. Company reports Six SNS companies account for $28.7 million (combined) of capital market activity: Activity in February was busiest among social networking companies (Figure 3), with six companies combining for a total of $28.7 million. There have also been four financings of video companies raising a total of $25.9 million.
- 4. Page 4 Capital Market Activity by Sector - February 2009 40.0 35.0 30.0 25.0 (US$m) 20.0 35.0 15.0 28.7 25.9 22.5 10.0 20.0 15.0 13.8 5.0 9.0 4.3 4.0 3.0 2.0 1.4 0.0 Comment/Reputation Gaming Wiki Travel Microblog Financial Services Search Social Networks Virtual Goods Virtual World Video Aggregation Analytics # companies 1 6 4 4 1 1 2 1 1 1 1 1 1 Figure 3. Capital Market Activity, by Sector, February 2009 Source. Company reports Average round size increases slightly: On a trailing 12-month basis, total financing dollars inched up as of February 2009, with average round sizes increasing slightly as well (Figure 4).
- 5. Page 5 LTM Financing 4,000.0 20.0 18.0 3,500.0 16.0 3,000.0 14.0 2,500.0 12.0 (US$m) (US$m) 2,000.0 10.0 8.0 1,500.0 6.0 1,000.0 4.0 500.0 2.0 0.0 0.0 May-06 May-07 May-08 Nov-05 Mar-06 Nov-06 Mar-07 Nov-07 Mar-08 Nov-08 Jul-05 Sep-05 Jan-06 Jul-06 Sep-06 Jan-07 Jul-07 Sep-07 Jan-08 Jul-08 Sep-08 Jan-09 Total Average Figure 4. Financings, Last 12 Months Source. Company reports Cumulative total $5.6 billion: Overall, on a cumulative basis, W eb 2.0 financings have totalled $5.6 billion, with the majority of the financing coming in late 2007 and the first three quarters of 2008 (Figure 5). Financing for the first quarter of 2009 has now passed that raised in the fourth quarter of 2008 – reversing the downtrend since the second quarter last year.
- 6. Page 6 Web 2.0 Financing (cumulative) 1,400.0 6,000.0 1,313.3 1,200.0 5,000.0 1,000.0 947.2 4,000.0 800.0 712.7 (US$m) (US$m) 3,000.0 600.0 524.9 2,000.0 399.4 400.0 338.5 319.4 1,000.0 200.0 145.7151.5 135.6 106.6 87.2 82.8 77.4 37.5 33.5 18.2 41.9 57.8 35.5 38.8 20.1 0.0 0.0 Qtr4 Qtr1 Qtr2 Qtr3 Qtr4 Qtr1 Qtr2 Qtr3 Qtr4 Qtr1 Qtr2 Qtr3 Qtr4 Qtr1 Qtr2 Qtr3 Qtr4 Qtr1 Qtr2 Qtr3 Qtr4 Qtr1 2003 2004 2005 2006 2007 2008 2009 Figure 5. Financing, Cumulative Source. Company reports U.S. remains dominant: U.S. companies continue to dominate capital market activity – with almost 73% of financings/M&A involving U.S. companies (based on dollars) (Figure 6). Canadian companies generated under 1% of capital market activity based on dollar volume (Figure 6). Based on number of transactions, the U.S. leads with 72.2% of deals, while Canada is third in number of financings at 5.4% (Figure 7). Financing/M&A by Country - LTM ($) Financing/M&A by Country - LTM (#) Canada UK UK Israel 5.4% 13.1% 5.8% 3.9% France 2.7% China 7.9% ROW Russia 1.7% Israel 10.0% 1.0% Canada 0.8% France 0.7% ROW 2.3% USA USA 72.6% 72.2% Figures 6 & 7. Financing/M&A, by Country (LTM, $, #) Source. Company reports
- 7. Page 7 Larger volume of early-stage funding (by count): Almost half of financings in the last 12 months are for early-stage companies (Angel/Seed or Series A) (Figure 8). Series B rounds are 28.9% of the total, with later-stage (Series D, E and PIPE) deals accounting for just 7.1%. Financing by Type - LTM Series B Series C 28.9% 13.8% Series D 4.2% Angel/Seed 10.9% Debt financing Series A 2.5% 37.7% PIPE 2.1% Figure 8. Financing, by Type (LTM, #) Source. Company reports Equity financings smaller over last 12 months: In the last 12 months, the average size of Series A, B, C, and D rounds have all been lower than the overall average (Figure 9). Note though that Angel/Seed rounds have been larger.
- 8. Page 8 Average financing round size 45.0 41.9 40.0 38.1 34.9 35.0 29.3 30.0 25.0 23.8 (US$m) 20.0 18.4 15.0 12.0 11.4 11.3 11.3 10.0 8.8 7.4 6.8 5.8 5.0 3.3 2.5 0.0 Angel/Seed Debt financing PIPE Series A Series B Series C Series D Series E LTM Average Size Overall Average Figure 9. Average Size per Round Source. Company reports C A P I T A L M A R K E T S A C T I V I T Y (P R I C E P E R F O R M A N C E ) Price Performance: Our W eb 2.0 index (market-cap weighted) has closely tracked the performance of the NASDAQ composite index, although it has outperformed the index from mid 2008 until recently (Figure 10).
- 9. Page 9 Web 2.0 Index Price Performance 140 120 100 80 60 40 20 0 3/3/2008 3/17/2008 3/31/2008 4/14/2008 4/28/2008 5/12/2008 5/26/2008 6/9/2008 6/23/2008 7/7/2008 7/21/2008 8/4/2008 8/18/2008 9/1/2008 9/15/2008 9/29/2008 10/13/2008 10/27/2008 11/10/2008 11/24/2008 12/8/2008 12/22/2008 1/5/2009 1/19/2009 2/2/2009 2/16/2009 3/2/2009 NASDAQ COMP Web 2.0 (Market Cap Weighted) Figure 10. Web 2.0 Price Performance Source. Capital IQ NGI rebounds; Perfect World drops: NGI Group (2497-TSE) rebounded from its fall last week to have the best performance in the group (for stocks with prices greater than $1) (Figure 11), increasing 22.1% on the week. Perfect W orld (PW RD-NasdaqGS) fell the most, -27.0%.
- 10. Page 10 1 Week P rice P erformance Ngi G roup Inc. 22.1% Chines e Gamer International 19.8% Neteas e.com Inc. 9.8% Modern Times G roup Mtg A B 4.9% S hutterfly , Inc. 4.8% NetDragon WebS of t, Inc. 4.6% Giant Interac tive G roup, Inc. 4.0% Gamania Digital Entertainment Co., Ltd. 3.9% A Q Interactive, Inc. 3.5% G ameOn Co Ltd. 2.2% Frogs ter Interactive Pictures A G 0.5% Y edangOnline Corp. 0.3% IA C/InterA ctiveCorp. -0.8% Tree.Com, Inc. -1.3% S park Netw orks , Inc . -2.4% Mix i, Inc. -2.4% S handa Interactive Entertainment Ltd. -3.8% Open Tex t Corp. -4.3% Tencent Holdings Ltd. -5.4% A ctoz S of t Co., Ltd. -5.4% LookS mart, Ltd. -7.1% G ree, Inc. -7.2% XING A G -7.2% United Online Inc. -7.6% S K Communications Co., Ltd. -8.5% K ings of t Co. Ltd. -9.4% HanbitS of t, Inc. -9.8% NEOWIZ Games Corporation -10.1% Northgate Technologies Limited -11.1% Eolith Co. Ltd. -11.1% PhotoChannel Netw orks Inc. -11.7% DA DA S pA -11.8% Y nk K orea Inc. -13.5% Quepas a Corp. -15.1% G igaMedia Ltd. -15.6% The9 Limited -18.4% TheS treet.com, Inc. -20.2% Perfect World Co., Ltd. -27.0% -30.0% -20.0% -10.0% 0.0% 10.0% 20.0% 30.0% Figure 11. 1-Week Price Performance Source. Capital IQ
- 11. Page 11 INDUSTRY NEWS (PARTNERSHIPS, FINANCIAL RESULTS, NEW PRODUCTS) K ey Developments C ompany Headline Notes Ne tDragon W ebso ft In c. La unches N e w E x pa ns ion P a ck NetDragon W ebS oft Inc. launch ed a new C hin es e language expans ion pa ck ' E x pa nding Horizon s'-for Zero O nline. F ollowing the la unch of NetDr agon W ebS oft, Inc. for Z ero O nline - 'E xpa nding Ho riz ons ' the previous e xpa ns ion pac k 'C ore S torm' in O ctober 2 008, 'E xpa nding H oriz ons ' provides a new 'robot c ombine' function which pla ye rs c an (S E HK : 777) utilize to crea te their own pe rfec t trans formers and ex perie nce unprecedented and ama zing enjoyment. Z e ro O nline is the first 2.5D MMO R P G dev elope d in C hina that is s et in a s cie nce-fiction univers e with robot a va tars . It was well receive d by players both in C hina and overse as ma rk ets sinc e its launc h in April 2007 . T he 9 Lim ite d R eports Unau dited C ons olida ted E a rning s T he9 Lim ited re ported una udited cons olidated e arnings res ults for the fou rth quarter and full ye a r ended De ce mber 31, 2008 . F or the qua rter, T he9 L i mited (Nas da qGS : NC T Y) R e su lts f or the F ourth Quarter a nd F ull Y ea r E nded the company reporte d ne t revenue s were C NY 40 5.1 m illion ($59 .4 m illion), re pres enting a 1% decreas e from C N Y 408. 4 m illion ($ 59.9 De ce mbe r 31, 2008 ; A nno unces Im pa irme nt C ha rges millio n) in the third qua rter of 2008 a nd 4% decrea s e from C N Y 4 23. 7 million ($6 2.1 million) in the fourth qua rter of 2007 . N et in come wa s C NY 44. 4 million ($6 .5 million), repres enting a dec re as e of 55% from C N Y 98.4 m illion ($1 4.4 million) in the third quarter 20 08 a nd 4 8% from C NY 86. 0 million ($1 2. 6 million) in the fou rth quarter 200 7. F ully dilute d ea rnings per s hare a nd per A DS for the fourth qua rter of 2008 wa s C NY 1.6 2 ($0.2 4), com pared to C NY 3 .56 ($ 0.52 ) for the third quarter of 200 8 and C NY 2. 93 ($0 .43) for the fourth qua rte r of 2 007, or the fourth qua rter of 2 008, non-G A AP a djusted net inc ome was C N Y 1 23.1 million ($1 8.0 millio n) compa red to th at of C NY 17 7.3 m illion ($26 .0 millio n) for the pre vious qua rter and C NY 17 6.9 million ($25 .9 m illion ) for the s ame pe riod of las t yea r. T h e compa ny reported fully diluted non-G A AP ad jus te d ne t inc ome per s ha re wa s C N Y 4. 49 ($0 .66), compa re d to C N Y 6. 4 1 ($0.9 4) for the third qua rter o f 20 08 a nd C N Y 6 .02 P erfect W orld to L aunc h La rge-S ca le C lo se d B eta P e rfect W orld C o. Ltd. announce d th at it will launc h large -s cale close d be ta tes tin g for its first mys terious adventure M MO R P G , 'B a ttle of the P erfec t W orld C o., L td. T es ting for 'B attle of th e Im mortals Immorta ls '. 'B a ttle of the Im morta ls ' g ives play ers an g aming experience of visiting mysterious his toric s ite s su ch a s A tla ntis , the B ermud a (Nas da qGS : PW R D) T riangle, the E gyptia n P yra mids, E a ster Is la nd a nd the M aus oleum of E m pe ror Q in as a n online adv entu re r. T he g ame blends ele me nts of E a stern a nd W es te rn c ultures . T he game run s on the 'C ube' engine developed by P erfect W orld, which has m any unique fe atures to brin g gam e pla yers new in-ga me experien ce . T he game's s pe cia l fea tures s uc h a s his to rical sites e xplora tion, turf wa rs a nd the S aint A rmor S ys tem c ater to ga me rs with diff erent interes ts. M OK O .m obi Limited S igns a n A greement with R elia nc e MO K O .m obi L imited a nnou nced that it ha s s igned a n a gre ement with R eliance C omm unica tions . MO K O .mobi will be localis ed for the Ind ian MOK O. mobi L imi te d (A S X: MK B ) C ommunications , I ndia ma rk et and will wo rk with ke y crick eting ide ntitie s including Dam ien Marty n, MO K O .mobi's o fficial C rick et R e porter, to e nha nce its a ppe a l, prov ide unique conte nt, a nd participa te in com petitions to help d rive us er growth. T he P a re nt C o. W ins A pproval for A s se ts S a le J udge B renda n Lin eha n S h annon of the U .S . B ank ruptcy C ourt approve d the dom ain n ame s ale of T he P arent C ompa ny on F ebrua ry 2 4, T he P are nt C ompany 2009 . A c cording to the order, Domain E quity L L C would purchas e do ma in nam es hobbies .com and itoys .com for $ 0.1 millio n. (O TC P K : K ID S .Q ) T he P a re nt C o. F iles for C a s e C onv ersion T he P arent C ompa ny filed a motion for c onversion of its C ha pter 1 1 ba nk ruptcy ca se to a C ha pter 7 on Fe bruary 20, 2009 . T he debtor s tate d T he P are nt C ompany that it no longer ha s a s ourc e of financing to fu nd the C hapte r 11 a dm inis trative expens es . C onve rting the cas e to a C h apte r 7 would be in (O TC P K : K ID S .Q ) the bes t inte re st of the creditors as there is no bene fit to creditors from continued a ccrual of fee s and expe ns es . Ne tE a se .com Inc. R eports Una udited E a rnings R es ults NetE as e. com Inc. reporte d unaudited earnings res ults for the fourth quarte r a nd full year e nded Dec ember 3 1, 20 08. T otal revenue s for the Netea s e.c om Inc. for the Fo urth Q ua rter and F ull Y ear E nd ed De ce mber fourth qua rter of 2 008 were R M B 8 01.7 million ($1 17.5 million), com pared to R MB 622 .1 m illion ($91. 2 m illion) for the fourth qua rte r of 2 007. (Nas da qGS : NT E S ) 31 , 20 08 Net profit for the fourth quarter o f 20 08 to taled R MB 575 .9 m illion ($ 84.4 million) or R M B 0. 18 per diluted s hare, co mpa re d to R MB 38 9.8 millio n ($57 .1 million) R MB 0.1 2 pe r dilute d s hare for the fourth quarter of 2007 . During the fourth quarte r of 20 08, the C om pany reported a net foreign e xchan ge los s of R MB 22.0 m illion ($3 .2 m illion ) unde r Other, net, com pa re d to R MB 30 . 2 million ($ 4.4 million) for the fourth quarte r of 2 007. N etE a s e reported bas ic a nd d iluted ea rnings per A merica n de pos itary s ha re of R MB 4.4 9 an d R M B 4 .46, re spectively, for the fourth qua rter of 2 008. T he C om pany repo rted bas ic an d dilu ted earnings pe r ADS of R MB 3. 21 a nd R M B 3.01 , res pec tive ly , for the fourth qua rter of 2 007. P rofit afte r tax was R MB 57 5.8 millio n an d total net R evenue wa s R M B 7 91.2 million a gains t profit a fter tax of R M B 389. 8 million a nd tota l net revenues of R MB 596 .3 million for the s am e period in the la st ye ar. T ota l reven ues for the y ear 2 008 were R MB 3 P hotocha nnel Network s Inc . R eports F inancia l R es ults for P hotoC ha nne l N etwork s Inc . reports its financ ia l res ults for the f irs t quarter of fis ca l 200 9 fo r the period ended Dec ember 31 , 200 8. N et profit P hotoC ha nne l Network s Inc . the F irs t Qua rter E nded Decem ber 3 1, 2 008 of C AD 9 40,6 44 vers us a los s of C AD 1,08 2,60 0 for the compa ra ble period of fis ca l 2 008. R ecord revenues of C AD 7. 2 million, up 67 % y ear- (T S X V: P N) over-year. E arnings per s ha re (E P S ) of C AD 0.03 ve rs us a loss per share of C A D 0.0 3 for the compa ra ble period of fis ca l 2 008. Non -G A AP adjus ted E a rn ings per s hare (E P S ) of C AD 0. 08 v ersus C AD 0.00 for the com para ble perio d of fisca l 20 08. S han da P artne rs with S ha ngha i S to rm to C o-ope ra te S handa Intera ctive E nte rtainme nt L td. a nnounced that it ha s es ta blis hed a s trate gic cooperation with S ha ngh ai S torm Information A cces s C hina Holding L td.; Y uya n O nline T echnology C o. Ltd. (A cces s C hina Holding L td.). P urs uant to the s trategic co operation , S hand a G a mes Limite d will ope ra te Y uyan O nline, S handa Interac tive E ntertainment whic h S h angh ai S torm will a ls o continue to ope ra te. I n addition, S ha nda O nlin e Holdings L imite d will open its unified pla tform to support the L td. (Nas da qGS : S N DA) operation of the ga me. Ne teas e. com to O pen B e ta T e st of Tianx ia II Nete as e. com Inc. will launch an open beta te st of T ianx ia II, its f irs t free -to-pla y 3 D online ga me , in the third quarter of 200 9. T ia nx ia II is Netea s e.c om Inc. NetE as e's firs t ga me that c harges use rs for virtual equ ipment. I t was prom oted in 2 007. T ia nxia II 's a lpha tes t be gan la s t ye ar. T he (Nas da qGS : NT E S ) re des igned ve rs ion wa s expe cted to fa vor more players . B es ides promoting proprie tary gam es , NetE a se is a ls o trying to win the operating right of S ta rC ra ft II , a trilogy of m ilita ry sc ience fiction rea l-time s trategy v ideo gam es develope d by B lizz a rd E nte rtainme nt, whic h is als o the developer of the popula r MMO R P G W orld of W arc ra ft (W oW ). T he c ompa ny currently operates s om e ga mes lik e F antas y W es tward J ourney, W e stward J ourne y O nline II , W es twa rd J ourney 3, and F ly for Fun. W izz ard Media S igns C ontent Dis tribution Ag re eme nt W iz z ard S oftwa re C orporation (W iz za rd Media ) a nnounced that it ha s s ig ned an a greement with G uidepos ts I nc. T he firs t a udio and video G uidepos ts , Inc.; W i zzard with G uidepos ts , Inc podc as ts to be ma de a va ila ble under this agre ement will be 'My s terious W ays .' T h e s erie s is av aila ble in iT unes , Z une Ma rk etpla ce and in a S oftware C orporation W iz z ard Me dia pla yer on the G uidepos ts webs ite a t http://www.guidepos ts .com/mwvid eos /m wvideos. Hos ted and narrate d by G uideposts (AME X: W ZE ) editor in c hief E dwa rd G rinna n, 'M ys te rious W a ys ' a re true pers onal ta les of wond erme nt a nd ins pira tion about re a l people experiencing mome nts when G od's pre se nce unexpec tedly re vea ls its elf in the ir lives . S han da I ntera ctive E n tertainment Ltd. R eports S handa Intera ctive E nte rtainme nt L td. reported co nden se d cons olida ted una udited earnings res ults for the fourth quarter a nd full year en ded S handa Interac tive E ntertainment C ondense d C onso lidated U naudited E arnings R es ults for December 31 , 20 08. F or the qua rte r, the company reporte d ne t revenue s of C N Y 1 ,015 .2 m illion , repres entin g an increa se of 4 2.1% from L td. (Nas da qGS : S N DA) the F ourth Q uarte r a nd F ull Y ea r E nded December 3 1, C NY 714 .2 m illion in the third qua rter of 2007 . Income from operations for the fourth qu arter of 200 8 was C NY 41 3.1 million com pared to 20 08 C NY 278 .9 m illion in the sa me period of 20 07. Non-G AA P net incom e in the fourth qua rte r of 2 008 wa s C NY 356 . 9 million, an in crea se of 15.3 % from C NY 30 9.6 million in the fourth quarter of 200 7, a nd a n incre as e of 2.4% from C NY 348 .4 million in the third qu arter of 2008 . Non-G AA P ea rnings per diluted A DS in the fourth quarter of 2008 were C N Y 5 .14, compared with C NY 4.20 in the fou rth qu arter of 2007 and C NY 4.7 8 in the third quarter of 200 8. Ne t inc ome in the fou rth quarter of 2008 wa s C N Y 34 2.7 millio n compa red to C N Y 2 92.6 million in the fourth qua rter of 2 007. E arnings per diluted AD S in the third qua rter of 20 08 we re C NY 5.1 4, compared with C NY 4. 20 in the third quarter of 2007 . F or the full y ear ended Decem ber 31 , 20 08, the compa ny re ported net re ve nues of C NY 3, 569. 1 m illion, re pres enting an increas e of 4 Update to S ha nda Inte ra ctive E nterta inm ent L td.’s E qu ity As o f Dec embe r 3 1, 2 008 S handa Inte ra ctive E nte rtain me nt Ltd. has repurcha s ed 4,6 10,3 66 A DS s. S handa Interac tive E ntertainment B uyback on December 31 , 20 08 L td. (Nas da qGS : S N DA) G oF ish C orpo ra tio n will C hange its T ick er to B W AV from E ffec tive F ebruary 27, 200 9, G oF ish C orpora tion will c hang e its O T C B B s tock ticke r s y mbol to B W A V from G O F H . B etawa ve C orporation G O F H o st Inte ra ctive Inc. S ign s C us tom S oftware Deal Digita lP os t Interac tive Inc. a nnounced tha t it has s igned a de al with a cus tom er. T he c ontra ct ca lls for DigitalP ost Inte ra ctiv e to build a (O TC BlPos W AV ) tiv e, Inc. Digi ta B : B t Inte rac DigitalP custom im plem enta tion of W eb 2.0 tools ets utiliz ed within a busines s to bus ines s (B 2B ) s oftwa re applica tion. I f all performa nce metrics a re (O TC B B : DGL P ) me t, the a gre ement is worth $165 ,000 with th e po ss ibility o f addition al contrac ts a vaila ble a fter a s uc ces sful firs t phas e imple me ntation. T he product is s cheduled to be c omplete d be fore the end of the s econd quarte r of 20 09. G iant L aunch es O nline Ga me H ardware Acces sing G ian t Interactive G roup Inc. announc ed that it has laun ched a frontier web ga me hardware a ss es s ing pla tform with Inte l C orporation. T he G iant Inter active G roup, Inc . P la tform with Intel platform, open s ource for other web gam e operato rs , will be cra fted by G ia nt into a n indus try mode l for online ga me ha rdwa re a s se ss ment. (NYS E :G A ); Intel C orporation (Nas da qGS : INT C ) Unite d O nline Inc. has file d a S he lf R egis tration in the United On line I nc. ha s filed a S helf R e gis tration in the amount of $15. 60 million. United O nli ne Inc. amount o f $1 5.60 million. (Nas da qGS : UNT D) ZipL ocal Inc. R eports E a rn ings R es ults for th e S econd ZipL ocal Inc. reported earnings res ults for the s ec ond qua rter and s ix mo nths e nded Decem ber 3 1, 2 008. F or the qua rte r, the c ompany ZipL oca l Inc. (TS XV : ZIP ) Q ua rte r a nd S ix M onth s E n ded December 31 , 200 8 re ported adjus ted E B IT DA los s by $1, 305, 989 a s compared to the s ame pe riod in the prior year. Net revenues for the thre e months ended December 31 , 20 08 we re $73 4,16 5, repres en ting a dec reas e of $2 73,8 92 (or 2 7% ) from $1, 008, 057 as recorded in the sa me period in th e prior yea r. Net los s for the three months ended D ecember 31, 200 8 was $ 703,2 72 or $0.0 1 pe r share, compa red to a los s of $ 1,98 5,41 3 or $0.0 3 pe r sha re, for the sa me period in the prior y ear. F or the s ix months , the com pany reported a djusted E B IT DA loss was $ 414, 546 re pres enting a n im prove me nt of $34 3,82 9 from $ 758,3 75 for the three months e nded S e ptembe r 30, 2008 . N et reve nues we re $1, 494,1 01, re pres enting a de crea se of $724 ,887 or 33 % from $2, 218, 988 a s rec orded in the sa me period in the prior ye a r. Net loss wa s $1,6 52,0 94 or $0.0 2 pe r sha re, c ompared to a los s of $ 3,22 4,56 8 or $0 .06 per s hare, for the s am e period in the prior yea r. Figure 12. Key Developments Source. Capital IQ
- 12. Page 12 VALUATION MMOG companies lead market cap charts: Seven companies in our W eb 2.0 universe top US$1 billion in market capitalization (Figure 13). Sixty-three of the 85 (same as last week) companies have market caps under US$100 million, with 26 (vs. 27 last week) under $10 million. Online gaming companies dominate the top of the list with four of the top six by market cap. Market C ap (US D m) Tencent Holdings L td. Neteas e. c om Inc . 2516.4 S handa Interac tive Entertainment L td. 2134. 2 2085. 3 IA C/InterA c tiveCorp. Open Tex t Corp. 1586. 6 G iant Interactive G roup, Inc . 1495.2 G ree, Inc . 1007. 8 Modern Times G roup Mtg A B 843. 5 Mix i, Inc . 564.2 Perfec t World Co., L td. 508.3 United Online Inc . 361.3 347. 4 K ings oft Co. L td. Chines e G amer International 322.2 The9 L imited 289. 4 G igaMedia L td. 275.0 NetDragon W ebS of t, Inc . 199. 7 S hutterfly , Inc . 197. 2 XING A G 188. 3 NEOWIZ G ames Corporation 185. 7 S K Communic ations Co., L td. 161.2 G ungHo Online Entertainment, Inc . 137. 4 DA DA S pA 102. 0 G amania Digital Entertainment Co., L td. 97. 0 G ameOn Co L td. 92. 3 CDC Corp. 82. 0 DigitalTow n, Inc . 74. 7 Moggle, Inc 72. 6 Y edangOnline Corp. 66.2 Openw ave S y s tems Inc . 65.9 B roadWebA s ia Inc . 63.7 A c toz S oft Co., L td. 58.7 TheS treet. com, Inc . 54.1 NeXplore Corporation 53.0 S park Netw orks , Inc . 52.3 45.0 PhotoChannel Netw orks Inc . K aboos e Inc . 44.0 HanbitS of t, Inc . 42. 4 OA O R B C Inf ormation S ys tems 41. 6 Tree.Com, Inc . 36. 8 J umpTV Inc . 31. 8 Ngi G roup Inc . 26. 6 B eyond Commerce, Inc . 26. 2 W iz z ard S oftw are Corporation 24. 4 G eoS entric Oy j 23.5 Northgate Tec hnologies L imited 22.8 Dolphin Digital Media, Inc . 21.9 DXN Holdings B hd 20.6 Fluid Mus ic Canada, Inc . 20.4 L ookS mart, L td. 20.1 G ravity Co., L td 19.2 Ex tens ions , Inc . 18.9 A Q Interac tive, Inc . 18.4 IdeaEdge, Inc . 18.2 Eolith Co. L td. 15.4 Quepas a Corp. 15.1 J umbuc k Entertainment Pty L td. 12.8 Frogs ter Interac tive Pictures A G 12.0 10.6 W ebz en Inc . S NA P Interac tive, Inc . 10.1 Lingo Media Corporation 9.5 Worlds . c om Inc . 9.4 A c c eleriz e New Media, Inc . 8.3 Magnitude Inf ormation S y s tems Inc . 7.9 CornerWorld Corporation 7.0 UOMO Media, Inc 6.0 5.6 IA S Energy , Inc . Y nk K orea Inc . 5.5 V OIS , Inc . 5.4 S pectrumDNA , Inc . 4.6 is eemedia Inc . 3.8 B right Things plc 2.9 Wooz y Fly , Inc . 2.6 MOK O.mobi L imited 2.3 Wy nds torm Corporation 2.2 Financ ial Media G roup, Inc . 2.0 L iveWorld Inc . 1.9 Unis erve Communications Corp. 1.0 ZipL oc al Inc . 0.9 B igs tring Corp. 0.9 DigitalPos t Interac tive, Inc . 0.4 The Parent Company 0.4 A s s oc iated Media Holdings Inc . 0.1 China G atew ay Corporation 0.0 S oc ial Media V enures , Inc . 0.0 S NM G lobal Holdings 0.0 0 500 1,000 1,500 2,000 2,500 3,000 3,500 4,000 Figure 13. Market Cap Ranking Source. Capital IQ TEV/Revenue (LTM) averages 3.8x: The overall average TEV/Revenue (LTM) multiple for our group is 3.8x – up from 3.6x last week (Figure 14). However, this is skewed by Gree (3633-TSE) at 31.3x and Bigstring (BSGC-OTCBB) at 31.7x.