2012 - Q1 - Snapshot, Focused Growth
•
0 likes•115 views

Q1 Granahan Focused Small Cap Growth Product Snapshot

Recommended
Recommended
More Related Content
What's hot
What's hot (18)
Similar to 2012 - Q1 - Snapshot, Focused Growth
Similar to 2012 - Q1 - Snapshot, Focused Growth (20)
More from Drew Beja
More from Drew Beja (11)
2012 - Q1 - Snapshot, Focused Growth
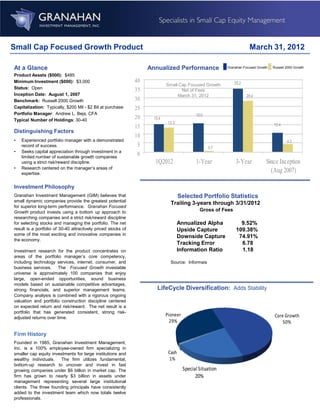
- 1. Granahan Investment Management, Inc. Small Cap Focused Growth Product March 31, 2012 At a Glance Annualized Performance Granahan Focused Growth Russell 2000 Growth Product Assets ($000): $485 Minimum Investment ($000): $3,000 40 35.2 Small Cap Focused Growth Status: Open 35 Net of Fees Inception Date: August 1, 2007 March 31, 2012 28.4 Benchmark: Russell 2000 Growth 30 Capitalization: Typically, $200 Mil - $2 Bil at purchase 25 Portfolio Manager: Andrew L. Beja, CFA 16.0 Typical Number of Holdings: 30-40 20 15.4 13.3 10.4 15 Distinguishing Factors 10 • Experienced portfolio manager with a demonstrated 4.2 record of success. 5 0.7 • Seeks capital appreciation through investment in a limited number of sustainable growth companies 0 using a strict risk/reward discipline. 1Q2012 1-Year 3-Year Since Inception • Research centered on the manager’s areas of expertise. (Aug 2007) Investment Philosophy Granahan Investment Management (GIM) believes that Selected Portfolio Statistics small dynamic companies provide the greatest potential Trailing 3-years through 3/31/2012 for superior long-term performance. Granahan Focused Growth product invests using a bottom up approach to Gross of Fees researching companies and a strict risk/reward discipline for selecting stocks and managing the portfolio. The net Annualized Alpha 9.52% result is a portfolio of 30-40 attractively priced stocks of Upside Capture 109.38% some of the most exciting and innovative companies in Downside Capture 74.91% the economy. Tracking Error 6.78 Investment research for the product concentrates on Information Ratio 1.18 areas of the portfolio manager’s core competency, including technology services, internet, consumer, and Source: Informais business services. The Focused Growth investable universe is approximately 100 companies that enjoy large, open-ended opportunities, sound business models based on sustainable competitive advantages, strong financials, and superior management teams. LifeCycle Diversification: Adds Stability Company analysis is combined with a rigorous ongoing valuation and portfolio construction discipline centered on expected return and risk/reward. The net result is a portfolio that has generated consistent, strong risk- Pioneer Core Growth adjusted returns over time. 29% 50% Firm History Founded in 1985, Granahan Investment Management, Inc. is a 100% employee-owned firm specializing in smaller cap equity investments for large institutions and Cash wealthy individuals. The firm utilizes fundamental, 1% bottom-up research to uncover and invest in fast growing companies under $6 billion in market cap. The Special Situation firm has grown to nearly $3 billion in assets under 20% management representing several large institutional clients. The three founding principals have consistently added to the investment team which now totals twelve professionals.
- 2. Granahan Focused Growth Composite March 31, 2012 Composite Assets Annual Performance Results Total Firm Assets Date ($-Millions) U.S. Dollars Number of Composite Composite Russell 2000 Composite Non-Fee ($-Millions) Accounts Gross Net Growth Dispersion Paying Index Assets (%) 1Q2012 $3,060.8 $.5 <5 15.65% 15.41% 13.28% NA 100 2011 $2,741.5 $.4 <5 13.19% 12.07% -2.91% NA 100 2010 $5.4 8 30.06% 28.81% 29.08% 0.15 7 2009 $4.2 8 53.80% 52.33% 34.47% 0.06 10 2008 $1.9 6 -46.34% -46.91% -38.54% NA 10 2007* $.4 <5 18.24% 17.76% 3.28% NA 100 NA – Information is not statistically meaningful due to an insufficient number of portfolios in the composite for the entire year. *Partial year performance: August 1, 2007 through 12/31/2007 Composite Footnotes Granahan Investment Management claims compliance with the Global Investment Performance Standards (GIPS®) and has prepared and presented this report in compliance with the GIPS standards. Granahan Investment Management has been independently verified for the periods January 1, 1993 through March 31, 2011. Verification assesses whether (1) the firm has complied with all the composite construction requirements of the GIPS standards on a firm-wide basis and (2) the firm’s policies and procedures are designed to calculate and present performance in compliance with the GIPS standards. GIM is an independent, SEC- registered investment firm that oversees small and mid-cap equity portfolios for large institutions and wealthy individuals. The Small Cap Focused Growth product utilizes fundamental, bottom-up research and analysis to invest in companies in the small cap sector of the market that exhibit sustainable high earnings growth, with a focus on the technology services, internet, consumer, and business services sectors. The benchmark for the Small Cap Focused Growth product is the Russell 2000 Growth. The composite, created in December 2011, is calculated by asset-weighting the performance of each account on a monthly basis. The composite includes returns from the portfolio manager’s prior firm, from inception of August 1, 2007 through December 30, 2011. Accounts are included beginning with the first full month under management and terminated accounts are included in the composite. Performance calculations, expressed in U.S. dollars, produce a total return including cash and the reinvestment of dividends and interest. Standard Deviation is calculated using equal-weighted total returns for accounts in the composite the entire year. Leverage is not utilized. Policies for valuing portfolios, calculating performance, and preparing compliant presentations are available upon request.. Returns are gross of investment management fees, which when included, reduce investment returns. Net of Fees returns are calculated by applying the fee schedule below to all accounts in the composite. The fee for accounts managed in the Small Cap Focused Growth style is payable quarterly in arrears and is calculated by applying the following ANNUAL percentages to the average value of the assets in an account on the last day of each month in the quarter: First $15 million 1.00%, next $35 million 0.80%, next $50 million 0.60%, above $100 million 0.73%. Fees are collected quarterly, which produces a compounding effect on the total rate of return net of management fees. Market value is based on trade date and security pricing is supplied by Telemet. A complete list and description of all of the firm's composites is available upon request. Past performance is no guarantee of future results. Top Ten Holdings March 31, 2012 Small Cap Russell 2000 March 31, 2012 Focused Growth Growth Name % Median Market Cap 1.19 bil 0.56 bil Equinix, Inc. 7.4 Weighted Avg. Market Cap 2.26 bil 1.54 bil ATMI Inc. 7.3 Est. 3-5 Year EPS Growth 18.2% 15.1% Affiliated Managers Group 7.0 Monotype Imaging Holdings 6.4 Forward P/E Ratio 29.3X 18.3X SciQuest Inc. 5.0 Dividend Yield 0.09% 0.69% Aspen Technology 4.9 Long Term Debt to Capital 12.9% 18.9% K12 4.6 Average Price/Book 3.76 3.36 Grand Canyon Education 4.3 Source: FactSet InnerWorkings Inc. 4.2 Concur Technologies 4.1 Granahan Investment Management, Inc. Specialists in Small Cap Equity Management 275 Wyman St., Suite 270, Waltham MA 02451 781-890-4412 www.granahan.com info@granahan.com