
Recommandé
Contenu connexe
Tendances
Tendances (12)
Similaire à AMD Reports Q1 2007 Results With Revenue of $1.2 Billion
Similaire à AMD Reports Q1 2007 Results With Revenue of $1.2 Billion (20)
Plus de earningsreport
Plus de earningsreport (20)
Dernier
Dernier (20)
AMD Reports Q1 2007 Results With Revenue of $1.2 Billion
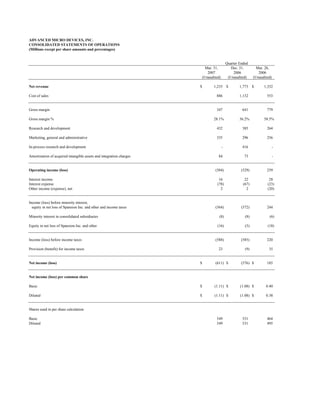
- 1. ADVANCED MICRO DEVICES, INC. CONSOLIDATED STATEMENTS OF OPERATIONS (Millions except per share amounts and percentages) Quarter Ended Mar. 31, Dec. 31, Mar. 26, 2007 2006 2006 (Unaudited) (Unaudited) (Unaudited) Net revenue $ 1,233 $ 1,773 $ 1,332 Cost of sales 886 1,132 553 Gross margin 347 641 779 Gross margin % 28.1% 36.2% 58.5% Research and development 432 385 264 Marketing, general and administrative 335 296 256 In-process research and development - 416 - Amortization of acquired intangible assets and integration charges 84 73 - Operating income (loss) (504) (529) 259 Interest income 16 22 28 Interest expense (78) (67) (23) Other income (expense), net 2 2 (20) Income (loss) before minority interest, equity in net loss of Spansion Inc. and other and income taxes (564) (572) 244 Minority interest in consolidated subsidiaries (8) (8) (6) Equity in net loss of Spansion Inc. and other (16) (5) (18) Income (loss) before income taxes (588) (585) 220 Provision (benefit) for income taxes 23 (9) 35 Net income (loss) $ (611) $ (576) $ 185 Net income (loss) per common share Basic $ (1.11) $ (1.08) $ 0.40 Diluted $ (1.11) $ (1.08) $ 0.38 Shares used in per share calculation Basic 549 531 464 Diluted 549 531 495
- 2. ADVANCED MICRO DEVICES, INC. CONSOLIDATED BALANCE SHEETS (Millions) Mar. 31, Dec. 31, 2007 2006* (Unaudited) Assets Current assets: Cash, cash equivalents and marketable securities $ 1,167 $ 1,541 Accounts receivable, net 667 1,140 Inventories 937 814 Prepaid expenses and other current assets 344 443 Deferred income taxes 71 25 Total current assets 3,186 3,963 Property, plant and equipment, net 4,405 3,987 Goodwill 3,187 3,217 Net investment in Spansion Inc. 345 371 Acquisition related intangible assets, net 1,136 1,207 Other assets 453 402 Total Assets $ 12,712 $ 13,147 Liabilities and Stockholders' Equity Current liabilities: Accounts payable 1,362 1,338 Accrued compensation and benefits 160 177 Accrued liabilities 698 716 Deferred income on shipments to distributors 181 169 Current portion of long-term debt and capital lease obligations 182 125 Other current liabilities 328 327 Total current liabilities 2,911 2,852 Deferred income taxes 43 31 Long-term debt and capital lease obligations, less current portion 3,659 3,672 Other long-term liabilities 591 517 Minority interest in consolidated subsidiaries 303 290 Stockholders' equity: Capital stock: Common stock, par value 5 5 Capital in excess of par value 5,373 5,316 Retained (deficit) earnings (332) 308 Accumulated other comprehensive income 159 156 Total stockholders' equity 5,205 5,785 Total Liabilities and Stockholders' Equity $ 12,712 $ 13,147 * Derived from the December 31, 2006 Audited Financial Statements of Advanced Micro Devices, Inc.
- 3. ADVANCED MICRO DEVICES, INC. SELECTED CORPORATE DATA (Unaudited) (Millions except headcount and percentages) Quarter Ended Mar. 31, Dec. 31, Mar. 26, Segment Information (1) 2007 2006 2006 Computing Solutions (2) Net revenue $ 918 $ 1,486 $ 1,337 Operating income (loss) $ (321) $ 65 $ 312 Graphics (3) Net revenue 197 166 - Operating income (loss) (35) (27) - Consumer Electronics (4) Net revenue 118 120 - Operating income (loss) (4) 20 - All Other (5) Net revenue - 1 (5) Operating income (loss) (144) (587) (53) Total AMD Net revenue $ 1,233 $ 1,773 $ 1,332 Operating income (loss) $ (504) $ (529) $ 259 Other Data Depreciation & amortization (excluding amortization of acquired intangible assets) $ 243 $ 224 $ 174 Amortization of acquired intangible assets $ 71 $ 47 - Capital additions $ 586 $ 666 $ 310 Headcount 16,745 16,464 10,246 Adjusted EBITDA (6) $ (196) $ 168 $ 417 (1) Starting in Q406, the Company no longer allocates employee stock-based compensation and profit sharing expenses to its segments. These expenses are recorded in the All Other category. Prior period information has been restated to conform to current period presentation. (2) Starting in Q107, Computing Solutions includes what was formerly the Computations Product Segment, the Embedded Products Segment and former ATI Chipset products. In Q406, former ATI Chipset products were reported as part of the Graphics and Chipsets Segment. Prior period information has been restated to conform to current period presentation. (3) Graphics includes 3D graphics, video and multimedia products developed for use in desktop and notebook computers, including home media PCs, professional workstations, and servers. In Q406, Graphics products were reported as part of the Graphics and Chipsets Segment. As noted above, starting in Q107 the Chipset products are reported as part of Computing Solutions. Prior period information has been restated to conform to current period presentation. (4) Consumer Electronics includes products and revenue related to mobile phones, PDAs, digital televisions, and other consumer electronics. (5) All Other category includes employee stock-based compensation expense, profit sharing expense, certain operating expenses and credits that are not allocated to the operating segments and Personal Internet Communicator (PIC) related activities in Q406 and Q106. Also included in this category are the ATI acquisition-related and integration charges incurred in Q107 and Q406. Details of the ATI acquisition-related and integration charges and employee stock-based compensation expense are shown below. ATI acquisition-related and integration charges: Q107 Q406 Employee stock-based compensation expense: Q107 Q406 Q106 Amortization of acquired intangible assets $ 71 $ 47 Integration charges Cost of sales 13 26 $ 2$2 $ 2 Subtotal 84 73 Research and development 14 13 4 In-process research and development - 416 Marketing, general and administrative 12 12 9 Cost of fair value adjustment of acquired inventory $ 28 $ 27 $ 15 29 62 Total $ 113 $ 551 (6) Reconciliation of Net income (loss) to Adjusted EBITDA* Q107 Q406 Q106 Net income (loss) $ (611) $ (576) $ 185 Depreciation and amortization 243 224 174 In-process research and development - 416 Amortization of acquired intangible assets 71 47 Interest expense 78 67 23 Provision (benefit) for income taxes 23 (10) 35 Adjusted EBITDA $ (196) $ 168 $ 417 * The Company defines Adjusted EBITDA as net income (loss) adjusted for depreciation and amortization, in-process research and development, amortization of acquired intangible assets, interest expense and taxes. The Company calculated and communicated Adjusted EBITDA because management believes it is of interest to investors and lenders in relation to its overall capital structure and its ability to borrow additional funds. The Company’s calculation of Adjusted EBITDA may or may not be consistent with the calculation of this measure by other companies in the same industry. Investors should not view Adjusted EBITDA as an alternative to the U.S. GAAP operating measure of net income or U.S. GAAP liquidity measures of cash flows from operating, investing and financing activities. In addition, Adjusted EBITDA does not take into account changes in certain assets and liabilities as well as interest and income taxes that can affect cash flows.