Call Girls Kengeri Satellite Town Just Call 👗 7737669865 👗 Top Class Call Gir...
Dangers that teens and kids face: A look at the data
1. SEARCH
NUMBERS, FACTS AND TRENDS SHAPING YOUR WORLD ABOUT FOLLOW DONATE
MENU RESEARCH AREAS
JANUARY 14, 2016
Dangers that teens and kids face: A look at the
data
BY DREW DESILVER (HTTP://WWW.PEWRESEARCH.ORG/AUTHOR/DDESILVER/)
(http://www.pewresearch.org/fact-tank/2016/01/14/dangers-that-young-
people-face-a-look-at-the-data/ft_16-01-05_parentalconcerns/) Worrying
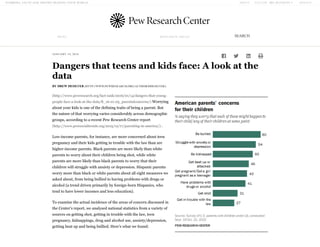
about your kids is one of the defining traits of being a parent. But
the nature of that worrying varies considerably across demographic
groups, according to a recent Pew Research Center report
(http://www.pewsocialtrends.org/2015/12/17/parenting-in-america/) .
Low-income parents, for instance, are more concerned about teen
pregnancy and their kids getting in trouble with the law than are
higher-income parents. Black parents are more likely than white
parents to worry about their children being shot, while white
parents are more likely than black parents to worry that their
children will struggle with anxiety or depression. Hispanic parents
worry more than black or white parents about all eight measures we
asked about, from being bullied to having problems with drugs or
alcohol (a trend driven primarily by foreign-born Hispanics, who
tend to have lower incomes and less education).
To examine the actual incidence of the areas of concern discussed in
the Center’s report, we analyzed national statistics from a variety of
sources on getting shot, getting in trouble with the law, teen
pregnancy, kidnappings, drug and alcohol use, anxiety/depression,
getting beat up and being bullied. Here’s what we found:
MY ACCOUNT
2. (http://www.pewresearch.org/fact-
tank/2016/01/14/dangers-that-young-people-
face-a-look-at-the-data/ft_15-12-
21_parentalconcerns_shoot/) Getting
shot: Relatively few minors (ages 17 and
younger) are shot in any given year, according to
data from the Centers for Disease Control and
Prevention’s database of fatal and nonfatal
injury reports
(http://www.cdc.gov/injury/wisqars/index.html) .
However, black youths are far more likely than
white or Hispanic youths to be injured by
gunfire or fatally shot.
In 2013, the last year for which there are
complete data, 1,258 youths were reported killed
by firearms (equivalent to 1.71 per 100,000), and
6,104 suffered nonfatal firearm injuries (8.29
per 100,000). In 2014, total youth deaths by
firearm rose to 1,331, or 1.81 per 100,000; injury
data for 2014 aren’t yet available. (All these
figures exclude injuries from BB guns and pellet
guns.)
In 2014, the rate of firearm deaths for black youths was 4.26 per 100,000, almost three times the rate for white youths and
nearly four times the rate for Hispanic youths. Hospital emergency departments, from which the CDC gathers its injury data,
don’t always obtain information on race and ethnicity for their patients. But based on the 80% or so of nonfatal firearm injury
cases involving juveniles in 2013 for which race and ethnicity data are available, the disparity among different subpopulations
was stark: 1.68 per 100,000 for white youths, 5.3 per 100,000 for Hispanic youths and 24.67 per 100,000 for black youths.
(http://www.pewresearch.org/fact-tank/2016/01/14/dangers-that-young-people-face-a-look-at-the-data/ft_15-12-
21_parentalconcerns_arrests-2/) Trouble with the law: Overall juvenile arrest rates have fallen by more than half after
peaking in the mid-1990s, according to the federal Office of Juvenile Justice and Delinquency Prevention
(http://www.ojjdp.gov/ojstatbb/crime/JAR.asp) . In 2012, nearly four of every 100 youths (ages 10 to 17) were arrested, down
from about 8.5 per 100 in 1996.
However, while all racial subgroups contributed to the decline (the OJJDP doesn’t report separately on Hispanics), the arrest
rate for black youths is still more than twice that of any other group.
3. (http://www.pewresearch.org/fact-
tank/2016/01/14/dangers-that-young-people-
face-a-look-at-the-data/ft_15-12-
21_parentalconcerns_birthrate/) Teen
pregnancy: The birthrate for 15- to 19-year-
olds (http://blogs.cdc.gov/nchs-data-
visualization/us-and-state-trends-on-teen-births-
1990-2014/) (the metric tracked by federal
researchers) has been dropping for decades
(http://www.pewresearch.org/fact-
tank/2014/04/21/why-is-the-teen-birth-rate-falling/)
and hit a record low in 2014. There were just
24.2 births per 1,000 teen females that year,
compared with 61.8 per 1,000 in 1991 and 41.5
as recently as 2007.
Over the past few decades, birthrates have not
only fallen among teens of all races and
ethnicities
(http://www.cdc.gov/teenpregnancy/about/index.htm) reported, but have fallen the most for those with the highest rates. In 1991,
for instance, non-Hispanic black teens had the highest birthrate (118.2 per 1,000) of any racial or ethnic group – 90.9 points
higher than Asian teens, who had the lowest rate (27.3 per 1,000). By 2013, the spread between the highest subgroup birth
rate (Hispanic teens, 41.7 per 1,000) and the lowest (Asian teens, 8.7 per 1,000) was just 33 points, according to the CDC
data.
Every state in the nation, as well as the District of Columbia, has a lower teen birthrate than it did in the early 1990s. The
District’s decline (from 112.8 per 1,000 in 1993 to 28.4 per 1,000 last year) was the steepest. But birthrates still vary
considerably across the country: Arkansas had the highest (39.5 per 1,000 last year), while Massachusetts had the lowest
(10.6 per 1,000).
Kidnapping: Reliable data on child abductions are notoriously hard to come by (https://www.washingtonpost.com/news/fact-
checker/wp/2015/03/17/58000-children-abducted-a-year-yet-another-fishy-statistic/) , but what information there is suggests that
abductions by strangers aren’t common.
4. The most pertinent data appear to come from the FBI via its
National Crime Information Center (https://www.fbi.gov/about-
us/cjis/ncic/ncic-missing-person-and-unidentified-person-statistics-for-
2014) , which law enforcement agencies around the country use to
share information. Of the 635,000-plus missing-person cases
reported to the NCIC last year, nearly 467,000 involved juveniles
below the age of 18. But according to an optional data field,
completed in about half of all missing-person cases, only 332
stranger abductions were reported last year; since 2007, the number
of stranger abductions has ranged between 200 and 520.
Among juveniles, abductions by non-custodial parents are much
more common than stranger abductions. The database lists 2,249
children as having been abducted by non-custodial parents; since
2007, the number has ranged between 2,000 and 3,000 a year. The
great majority of juvenile disappearances – at least 302,000 – were
characterized as runaways; in only 4,800 cases did circumstances
suggest that the disappearance may have been involuntary.
(http://www.pewresearch.org/fact-tank/2016/01/14/dangers-
that-young-people-face-a-look-at-the-data/ft_15-12-
21_parentalconcerns_depression/) Anxiety and depression: Available data suggest that a quarter of teens have
experienced some sort of anxiety disorder (such as phobias, panic disorder or post-traumatic stress disorder) at some point in
their lives, according to the National Institute of Mental Health (http://www.nimh.nih.gov/health/statistics/prevalence/any-
anxiety-disorder-among-children.shtml) . For 5.9% of teens, their disorder causes or did cause “severe impairment.” Anxiety
disorders are more common among teen girls than boys (30.1% versus 20.3%).
About one-in-ten adolescents, or around 2.6 million, have experienced major depression in the past year, according to 2013
data reported by NIMH; for 7.7%, their depression caused severe impairment. Depression was three times as common among
teen girls as teen boys (16.2% versus 5.3%). Among racial and ethnic groups, mixed-race teens were the most likely to report a
major depressive episode in the previous year (13%); native American teens were least likely to report depression (4.5%).
Bullying: This, unfortunately, is another case in which solid data can be hard to come by. The 2013 Youth Risk Behavior
Study (http://www.cdc.gov/mmwr/pdf/ss/ss6304.pdf) (which covered only high-school students) found that 19.6% had been
bullied on school property in the previous 12 months, and 14.8% had been electronically bullied. In both cases, white teens
and female teens were more likely to say they’d been bullied.
(http://www.pewresearch.org/fact-tank/2016/01/14/dangers-that-young-people-face-a-look-at-the-data/ft_15-12-
21_parentalconcerns_substances/) Drugs and alcohol: Overall drug use among young people has been more or less
unchanged in recent years after rising sharply in the 1990s, according to the University of Michigan’s long-running
“Monitoring the Future” (http://monitoringthefuture.org/data/15data.html#2015data-drugs) survey. Around 15% of eighth-graders,
5. three-in-ten high-school sophomores and four-in-ten seniors report some use of illicit
drugs (either illegal or prescription drugs not under a doctor’s orders) in the past 12
months. Marijuana is by far the most commonly used drug, at all grade levels; 10th- and
12th-graders are next-most likely to report using amphetamines and the prescription
drug Adderall, while inhalants are the second-most frequently used drugs among
eighth-graders.
At the same time, alcohol and cigarette use has been declining for many years: Last
year, 35.3% of seniors reported any alcohol use in the past 30 days (down from 54% in
1991), and only 11.4% reported smoking cigarettes (down from 36.5% in the peak year
of 1997). Indeed, 12th-graders were about as likely to have smoked marijuana in the
past 30 days (21.3%) as to have gotten drunk (20.6%).
Getting beat up: The 2013 youth risk study
(http://www.cdc.gov/mmwr/pdf/ss/ss6304.pdf) found that about a quarter (24.7) of high-
school students said they’d been in a physical fight at least once in the past 12 months
(down from 42.5% in 1991
(http://www.cdc.gov/healthyyouth/data/yrbs/pdf/trends/us_violence_trend_yrbs.pdf) ),
though only 3.1% needed medical attention.
Black students were most likely to say they’d been in a fight – nearly 35%, compared
with 28.4% of Hispanic high-schoolers and 20.9% of white students. Just over 8% said
they’d been in a fight on school property, and 7.1% said they’d skipped school at least
once in the past 30 days because of safety concerns.
SHARE THIS LINK: http://pewrsr.ch/1KfvQ0H
6. POSTS EMAIL @DREWDESILVER
Drew DeSilver (http://www.pewresearch.org/author/ddesilver/) is a senior writer at Pew Research Center.
DONATE
MAKE A FINANCIAL CONTRIBUTION TO SUPPORT OUR WORK