
Recommended
More Related Content
What's hot
What's hot (20)
Similar to Walker rovaniemilclu cmeetingtalk20120517(1)
Similar to Walker rovaniemilclu cmeetingtalk20120517(1) (20)
Recently uploaded
Recently uploaded (20)
Walker rovaniemilclu cmeetingtalk20120517(1)
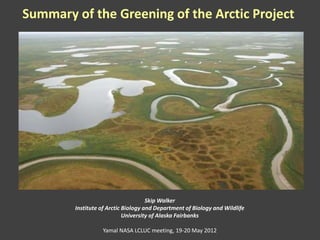
- 1. Summary of the Greening of the Arctic Project Skip Walker Institute of Arctic Biology and Department of Biology and Wildlife University of Alaska Fairbanks Yamal NASA LCLUC meeting, 19-20 May 2012
- 2. Principal GOA collaborators • Co-PIs: D.A. Walker1, U.S. Bhatt1, H.E. Epstein2, B.C. Forbes3, M.O. Leibman4, V.E. Romanovsky1 • Major contributors: P. Bieniek1, J. Comiso6, D. Drozdov4, K. Ermokina4, G.V. Frost2, G.J. Jia5, O. Khitun9, A. Khomutov4, G. Kofinas1, T. Kumpula7, G. Matyshak8, N. Metschtyb3, N. Moskalenko4, P. Orekov4, J. Pinzon6, M.K. Raynolds1, F. Stammler3, C.J. Tucker6, N. Ukraintseva4, Q. Yu2 • 1Universityof Alaska Fairbanks, 2 University of Virginia, 3Arctic Centre, Rovaniemi, Finland, 4Earth Cryosphere Institute, Tyumen, Russia, 5Institute of Atmospheric Physics, Beijing,China, 6NASA- Goddard, Beltsville, MD, 7University of Eastern Finland, Joensuu, Finland, 8 Lomonosov Moscow State University, Russia, 9Komarov Botanical Institute, St. Petersburg, Russia • Funding mainly from NSF (4 projects), NASA (2 projects), Russian Academy of Science and Finnish Government.
- 3. Overview of talk • Hierarchical spatial and temporal analysis of Arctic greening – Quick overview of NDVI and early findings. – Update on spatial and temporal PanArctic sea ice, land temperature, and NDVI change emphasizing a recent change in these patterns possibly related to humidifcation of the Arctic. – Regional observations along Arctic transects in North America and Eurasia that help explain the PanArctic changes. – Two studies in Russia and at Toolik using Landsat and very high resolution satellite data to help understand the details of change.
- 4. Change in multi-year sea ice White areas are areas of multi-year ice in 1980 and 2009. Rigor and Wallace 2004, updated to 2009
- 5. Models indicate that periods of rapid sea-ice loss are accompanied by strong land warming and permafrost degradation. D.L. Lawrence et al. 2008. Accelerated Arctic land warming and permafrost degradation during rapid sea ice loss. Geophysical Research Letters. 15: L11506.
- 6. Linkage between climate, sea-ice shrinkage and vegetation. Main PanArctic hypothesis: Periods of reduced sea ice should correspond to periods of warmer land temperatures and this should in turn correspond to periods of more rapid greening.
- 7. Greening is highly variable across the Arctic and within landscapes. Photo: D.A. Walker Landslide slopes in the central Yamal Peninsula, Russia
- 8. NDVI: Integrator of vegetation change Webs of social and ecological factors that influence vegetation productivity and NDVI Modified from Walker et al. 2009. Environmental Research Letters.
- 9. Main Landscape-level hypothesis: Disturbance is the primary driver of NDVI change within landscapes.
- 10. Circumpolar patterns of change of sea-ice, land temperature and NDVI change in the Arctic detected with AVHRR satellite sensors Focused on areas within 100 km of coast SWI = summer warmth index, Percentage change in Maximum NDVI value lines. Trend of annual sum of mean monthly reached in summer. temperatures >0 ˚C. Bhatt et al. 2010. Earth Interactions. updated to 2011.
- 11. Examining the correspondence between the dfferent patterns Bhatt et al. 2010. Earth Interactions. Updated to 2011 for BAMS 2011 State of the Climate
- 12. Analysis by sea basin Approach • Division of the Arctic into sea basins and associated land areas based on Russian Arctic Atlas. • Developed time series of coastal May-Sep sea-ice concentration (100-km coastal zone), summer land temperatures for the full tundra region (summer warmth index), and NDVI based on 1982-2011 AVHRR satellite data. • Examined trends and correlations between factors for each sea.
- 13. Percentage change of coastal open water and summer land temperatures Significant trends are starred (*) Most noticeable: – Positive changes in open water across the Arctic. – Greatest open water changes are in the E. Kara Sea. – Greatest percentage warming changes are in the Baffin Bay, Davis St., Greenland Sea areas – Cooling in the E. Kara region despite very large increases in open coastal water (More fog? More snow? Shorter growing season?) Updated from Bhatt et al. 2010, Earth Interactions.
- 14. Percentage change of NDVI • In general, areas of enhanced NDVI patterns are corresponding to areas of warmer land temperatures. – Strong greening in the Beaufort, Canada, Greenland and Laptev (all areas of strong warming). – Weak trend in the Barents / Kara region (area of cooling). Walker et al. 2011, BAMS State of the Climate, in prep. Updated from Bhatt et al. 2010, Earth Interactions.
- 15. Trends in NDVI MaxNDVI TI-NDVI • General upward trend of NDVI in N. America and Eurasia. • Much higher NDVI in Eurasia due to relative amount of land in the more productive Low Arctic.
- 16. Recent changes in NDVI trends MaxNDVI TI-NDVI Diverging patterns after about 2001: – Eurasia: flat MaxNDVI and declining TI-NDVI. – North America: strongly increasing NDVI, flat TI-NDVI.
- 17. Beaufort Diverging patterns of NDVI change in the Beaufort and Kara sea areas Beaufort: 24% overall increase but trend flat since 2004. Kara: 4% overall increase, essentially flat since 1990. Kara Pct. Change MaxNDVI (1982-2010) Beaufort Kara 26% increase +4% increase 17
- 18. PanArctic findings • Largest negative changes in sea-ice (positive changes in open- water) are in the regions of 1) the Kara/N. Barents seas, 2) the East Siberia/Chukchi/Beaufort seas, and 3) the Baffin Bay/Davis Straight/Foxe Basin/Hudson Bay. There are a few areas of positive sea-ice change (e.g. E. Bering Sea). • Largest positive land-temperature changes are in the Greenland Sea/ Baffin Bay area. Cooling in the Y-K delta, parts of central northern Canada, and much of NW Siberia. • Strongest positive NDVI changes are in Alaska and Beaufort Sea area. Some weak negative trends in NW Siberia. • Why the strong contrast of NDVI change of the Beaufort and Kara sea areas?
- 19. The Arctic tundra zone is a maritime biome • 177,000 km of coastline – 1/5 of global total. – for a biome that comprises less than 5% of the Earth’s land surface. • But it is not all equally maritime because the ocean is covered by varying amounts of ice during the winter and summer. • Which promotes relatively continental climates in areas with long periods of winter and summer sea ice. Map by Hilmar Maier.
- 20. Arctic vegetation patterns are strongly linked to differences in sea ice Yurtsev’s (1994) floristic division of the Arctic: • Divides the Arctic into 6 floristic provinces and 22 subprovinces. • Separates oceanic and continental areas of the Arctic. Yurtsev, B.A. 1994, Journal of Vegetation Science
- 21. Yurtsev’s oceanic and continental regions within the Arctic • Gray areas: continental Arctic areas with an Arctic climate, cold winters, long periods of summer sea ice, permafrost, and an Arctic flora. • Blue areas: Treeless areas, mainly outside the true Arctic, with warm winters, no permafrost (except in mountains), and an oceanic boreal flora. • Green areas: Intermediate Arctic tundra but with strong oceanic influence, long periods of ice- free ocean in fall and winter. Yurtsev, 1994, Journal of Vegetation Science
- 22. The transitional areas with mixed oceanic and continental influences are currently the areas where some of the greatest ocean and land changes are occurring. 3 2 1 1. N. Bering seas/ Chukchi 2. Foxe Basin/Baffin Bay 3. N. Barents/Kara seas Yurtsev 1994, Journal of Vegetation Science
- 23. Seasonal trends in open water Oct-Nov Dec-Feb Mar-Apr Large fall increases in Open Water Magnitude of Change (pct.) open water: • Beaufort / Chuckchi • N. Barents / Kara • Baffin Bay / Hudson Bay / Foxe Basin Bieniek, Bhatt, et al., in progress
- 24. Changes in open water Oct-Nov Dec-Feb Mar-Apr Open Water Magnitude of Change (pct.) No midwinter or early spring trend in the Beaufort. Ocean frozen. Snow trends based on CFSR reanalysis. Bieniek, Bhatt, et al., in progress
- 25. Changes in open water Some decrease in open water Oct-Nov Dec-Feb in the Bering. Mar-Apr Open Water Magnitude of Change (pct.) Large winter and spring increases in open water mostly on Atlantic side: • Davis Strait / Labrador Sea • N. Barents • Greenland Sea Snow trends based on CFSR reanalysis. Bieniek, Bhatt, et al., in progress
- 26. Changes in snow water equivalent Oct-Nov Dec-Feb Mar-Apr Fall: OW Magnitude of Change (pct.) Decreases: • Beaufort / Chukchi / Bering Increases: SWE Magnitude of Change (mm) • Barents / Kara / Laptev Snow water equivalent data are from CFSR reanalysis trends. Bieniek, Bhatt, et al., in progress
- 27. Changes in snow water equivalent Oct-Nov Dec-Feb Mar-Apr Mid winter: OW Magnitude of Change (pct.) Decreases: Increases: • Beaufort / Chukchi / • Barents / Kara / Bering SWE Magnitude of Change (mm) Laptev • Ungava Peninsula / S. • N. Canada W. of Baffin I. Hudson Bay Bieniek, Bhatt, et al., in progress
- 28. Changes in snow water equivalent Oct-Nov Dec-Feb Mar-Apr Open Water Magnitude of Change (pct.) Spring: Increases in SWE in most areas of the Snow Water Equivalent Magnitude of Change (mm) Arctic. Snow trends based on CFSR reanalysis. Bieniek, Bhatt, et al., in progress
- 29. Recent reports on Arctic snow increases • Cohen, J. et al. 2012. Arctic warming, increasing snow cover and widespread boreal winter cooling. Environmental Research Letters 7:8. • Liu, J. et al. 2012. Impact of declining Arctic sea ice on winter snowfall. Proceedings National Academy of Science 109:4074- 4079. • Muskett, R. R. 2012. Multi-Satellite and Sensor Derived Trends and Variation of Snow Water Equivalent on the High-Latitudes of the Northern Hemisphere. International Journal of Geosciences 3:1-13.
- 30. Toolik Lake snow-free date trend suggests later snow melt First day of snow free ground in spring First day of snow-free ground at Imnavait Creek, AK 19 June 9 30 20 May 10 Represents new snow events. 1 1980 1985 1990 1995 2000 2005 2010 Courtesy of Brian Barnes, data Institute of Northern Engineering, UAF However, MODIS record for last 10 years years shows a generally earlier snow free date across most of Arctic Alaska.
- 31. An earlier analog of massive maritime change in the Arctic: Dale Guthrie’s mesic tundra “buckle” in Beringia during the era of the mammoth steppe followed by the opening of the Bering Strait. Guthrie 2001, Quaternary Science Reviews
- 32. Leading to warming and humidification of the Arctic Photo: P. Kuhry, http://www.ulapland.fi/home/arktinen/tundra/tu-taig.htm:
- 33. Correlations of Mar-Apr SWE with Climate Indices • Patterns in snow are driven by large-scale climate phenomena. Correlations exist but it is very complex. • Uma and Peter are now trying find the mechanism (e.g. changes in weather patterns). • They are first focusing on Alaska with local weather experts first. Bieniek, Bhatt, et al. in prep.
- 34. What do the changes in NDVI mean at the ground level in terms of biomass change? Bioclimate subzones Eurasia Arctic Transect (EAT) Krenkel Two transects through all 5 Arctic bioclimate subzones North America Arctic Transect (NAAT) Subzone MJT Shrubs A (Cushion forb subzone) 1-3 ˚C none B (Dryas subzone) 3-5 ˚C prostrate dwarf (< 5 cm) C (Cassiope subzone) 5-7 ˚C hemi-prostrate dwarf (< 15 cm) D (Betula subzone) 7-9 ˚C erect dwarf (< 40 cm) CAVM Team 2003 E (Alnus subzone) 9-12 ˚C low (40-200 cm)
- 35. Linking spatial and temporal trends of NDVI observed on satellite images to ground observations. • Climate • Vegetation NDVI and LAI Plant species cover Active layer depth • Soils • Permafrost • Spectral Site characterization Biomass Soil characterization properties Soil temperature Permafrost boreholes
- 36. The North America Arctic Transect (NAAT) Biocomplexity of Arctic Patterned Ground Ecosystems Project (NSF) 2002-2006 Walker, D. A. et al. 2008. Arctic patterned-ground ecosystems: a synthesis of field studies and models along a North American Arctic Transect. Journal of Geophysical Research - Biogeosciences 113:G03S01,
- 37. The Eurasia Arctic Transect (EAT) Adaptation to rapid land-use and climate changes on the Yamal Peninsula, Russia: Remote sensing and models for analyzing cumulative effects (NASA) 2007-2011 Photo: Courtesy of Don and Cherry Alexander Walker, D. A., 2011. Cumulative effects of rapid land-cover and land-use changes on the Yamal Peninsula, Russia Pages 206-236 in G. Gutman and A. Reissel, editors. Eurasian Arctic Land Cover and Land Use in a Changing Climate. Springer, New York.
- 38. Integrated field studies at zonal study sites along both transects Hayes Island, Russia Photo: D.A. Walker
- 39. Zonal vegetation along both transects Eurasia Transect A - Hayes Island B - Ostrov Belyy C – Kharasavey D - Vaskiny Dachi E - Laborovaya North America transect A - Isachsen B- Mould Bay C - Green Cabin D - Sagwon MNT E - Happy Valley 3 9
- 40. Climate and soil at key zonal sites in each subzone along the NAAT and EAT Walker et al. ERL 2012
- 41. Comparison of a mainly continental transect (NAAT) and a more maritime transect (EAT) NAAT: EAT: Beaufort / Canadian Archipelago, a N. Barents / Kara, a relatively relatively continental area maritime area Continental Subzone A, Oceanic Subzone A, Isachsen, Ellef Ringnes, I., NAAT Krenkel, Franz Josef Land, EAT Photos D.A. Walker
- 42. Zonal biomass differences between NAAT and EAT • More forbs & evergreen shrubs 800 Deciduous shrub (mostly Dryas integrifolia) 600 Evergreen shrub along the NAAT, due mostly to Biomass (g m^2) higher soil pH of the NAAT. Forb 400 Graminoid • More mosses and biomass in 200 Lichen subzones B, C, D of the EAT (moister climate, older Moss 0 landscapes of EAT particularly in subzones B and C). Walker et al. ERL 2012 Dryas integrifolia 42
- 43. Leaf Area Index vs. Biomass: EAT and NAAT • An equivalent amount of biomass has higher LAI values along the NAAT than along the EAT and the difference increases at higher biomass values. • Reflects the different structure of the vegetation along the two transects. Higher proportion of the total biomass is woody along the NAAT (more wood, taller plants) vs. reindeer-foraged and mossy vegetation along the EAT. Walker et al. ERL 2012 43
- 44. Comparison of EAT and NAAT 1-km AVHRR NDVI & biomass, vs. summer warmth index •Biomass values are landscape- level averages for zonal landscapes. •EAT is greener and has more biomass at equivalent summer warmth. •Possibly a function of more maritime conditions along the EAT. Walker et al. ERL 2012 44
- 45. Strong correlation between NDVI and aboveground biomass • Despite differences in vegetation structure, glacial history, pH, grazing regimes, phenology, etc. there is a very similar relationship between AVHRR NDVI and biomass along both transects. • Gives us moderate confidence that it is possible to construct Arctic biomass map based on the NDVI. Aboveground biomass of Arctic zonal sites Raynolds et al. 2012, Remote Sensing Letters 45
- 46. Rate of change in zonal biomass 1982-2010 (kg m-2 y-1) Epstein et al. 2012. Environmental Research Letters.
- 47. Plot-based evidence for change in biomass? • Numerous groups are measuring NDVI and biomass, but integrated long-term, panArctic monitoring using consistent standardized protocols are lacking. Photos: Gosha Matyshak and Fred Daniëls New information on long-term changes: BTF synthesis (Callaghan and Tweedie 2011), ITEX synthesis (Elmendorf et al. in 2012) ERL special shrub issue (Epstein et al. 2012)
- 48. Other factors influencing Strong greening on landslide slopes the NDVI: cover extensive areas of the Yamal. Landslides and cryogenic erosion • Large effect on patterns of greenness in many areas. • Need temporal series of high-resolution satellite images and/or photos in landslide areas to assess the rate of change. Biomass Before landslides After landslides Key: Low-willow shrublands develop on landslides A – stable areas 1 – young landslide B – shear surface 2 – old landslide during 200-yr succession, greatly changing C – landslide body 3 – very old landslide biomass and NDVI. Ukraintseva and Leibman et al. Photos D.A. Walker 2000, 2007, 2008
- 49. Other factors influencing the NDVI: The Nenets people and their 300,000 reindeer Photo: D.A. Walker.
- 50. Effects of landscape-scale disturbances on panArctic NDVI patterns are presently unknown, but new high- resolution satellite data show great promise for studying the effects. Cryogenic erosion and greening Vaskiny Dachi patterns on the Yamal are clearly discernable on new GeoEye scene (0.41 m resolution).
- 51. Analysis of greening trend and alder growth near treeline in Polar Urals Quickbird image with Landsat-trend pixels overlaid. Landsat Trend Corona 1968 Quickbird 2003 1985-2010 JJ Frost (U. Virginia): Ph.D. research X grid points with new alder cover since 1968.
- 52. Alder establishment on patterned ground features Organic thickness Mineral thickness Alders exploit circle >90 % of alders microsites that lack concentrated on organic mat and <50% of available competing sites vegetation Alder density maps showing alders and circle-centers in recent expansion areas. Squares are 1x1 m. X = circle center Alder density (shrubs m-2) JJ Frost: Ph.D. research
- 53. Analysis of greening trends at Toolik Lake using Landsat data (30 m pixels) Glacial Geology (based on Hamilton 2003) Significant greening mainly on disturbed sites and M.K. Raynolds. younger geological surfaces. CRSS Conf. 2012
- 54. History of infrastructure expansion on the Yamal • Bovanenkovo transportation and pipeline networks and the main area impacted by gas- field activities as of 2011. • Routes of five Nenets reindeer- herder brigades (yellow dotted lines). Courtesy of Timo Kumpula. Landsat image of Bovanenkovo gas field.
- 55. History of infrastructure expansion, Bovanenkovo gas field, Yamal (1988-2011) Courtesy of Timo Kumpula. • (Left) The stages of visibly affected area expansion encompassing off-road tracks, roads, quarries and residential or other buildings. The last three years has been a period of rapid infrastructure expansion, including railroad and pipeline building. • (Right) Growth of permanent infrastructure development including roads, pipelines, quarries and residential or other buildings. Since the mid-1990’s new infrastructure advanced slowly. Most of the expansion since 1998 has occurred between 2009-2011 (red lines + light gray and tan areas). • A similar mapping analysis is underway for the Prudhoe Bay oil field 1968-2011, building on the NRC (2003) report.
- 56. a. Effects of industrial expansion on greening patterns Kekh, the first area affected at Bovanenkovo in 1988. a. Large zone of exposed mineral soils b. (marine clay) denuded of vegetation by heavy off-road vehicle traffic and construction activities. The black polygon circumscribes the extent of disturbance b. VHR Quickbird-2 shows the extent of revegetation after 14 years of natural regeneration. c. c. Much of the bare ground has been totally revegetated by 2011. But, a significant amount of new permanent infrastructure has been built since 2004. Courtesy of Timo Kumpula.
- 57. Nenets perception of changes Nenets brigade crossing the Se-yakha river in the center of Bovanenkovo gas field on 5 July 2011. (Photo by Timo Kumpula). Participant observation in winter pastures on the south side of Ob Bay: left Dr. Nina Meschtyb and right Nenets reindeer herding brigadier Nyadma Khudi from Yarsalinskii sovkhoz brigade 4. Photo from Nina Meschtyb archive.
- 58. a Modeling the effects of climate change and reindeer grazing Effects of climate change, soil texture, and grazing on plant- functional-type and total-aboveground tundra biomass (Yu et al. 2011) b c d FORB RUSH GRAS M OSS LICH Axi s 2 Axi s 2 LICH FORB Total RUSH EPDS LOWS DPDS TALL HAES M OSS HADS GRAS EEDS TUSS LAES SEDG LADS DEDS TUSS Total SEDG Axi s 1 Axi s 1 NMS ordination showing relative effects of climate change and grazing scenarios on tundra plant-functional-type and total biomass in the five bioclimate subzones and two dominant soil types on the Yamal. Biplots (cluster of vectors in the centers of the plots) show relative direction and strength of (a) original latitudinal gradient and treatment factors (climate change, grazing, and soil organic nitrogen (SON, as a function of soil texture). Axis 2 is strongly correlated with the latitudinal summer temperature gradient (~12 °C MJT) (42% of total variance), Axis 1 is strongly correlated with the grazing gradient (13% of total variance); (b) trends in relative biomass of plant functional types; and (c) trends in absolute biomass of plant functional types. (d) Total biomass for each simulation scenario; each point represents one model simulation; color indicates different grazing intensities, size of dot is relative total biomass. Grazing is parameterized with two components: frequency of each grazing event and percent biomass removal. For example, (0.1, 25%) indicates the grazers will graze the same area every ten years and each time a maximum of 25% biomass will be removed. Percent biomass removal matters more than frequency of visit: (0.1, 50%) is of greater grazing intensity than (0.5, 25%) through this analysis. Side plots show trend in biomass along each axis. The biomass trend is strongest along the latitudinal gradient. (Modified from Yu et al. 2011).
- 59. Comparative study of cumulative change at Prudhoe Bay, AK
- 60. Take Home Points • A general greening of Arctic tundra vegetation occurred from 1982-2011. • The trends are stronger in N. America than in Eurasia. • Since about 2001, the trends in North America and Eurasia have diverged. • Remote sensing and reanalysis products indicate that the trend of more open water is focused in several areas (three largest are highlighted here). • The effects of more open water appear to be stronger in the relatively continental areas of the Arctic. • Ground-based information from two Arctic transects help to interpret the remotely-sensed information in maritime versus more continental areas of the Arctic. • Analysis of NDVI trends with respect to ground based studies revealed: – Patterned ground plays key role in alder shrub establishment in the Polar Urals (Frost et al. 2012). – Landscape age plays key role in greening trends at Toolik Lake (Raynolds et al. 2012).
- 62. Effects of industrial development and reindeer grazing Courtesy of Pam Miller. Prudhoe Bay oil field.
Editor's Notes
- This talk emphasizes the linkages between the Arctic maritime and land systems.A rather large group of collaborators has focused on this topic during and prior to IPY. Here we present the circumpolar patterns and changes in open water, humidity, snow, land temperatures, NDVI and phenology (1982-2010): using satellite- and ground-based observations
- We have also examined the temporal relationships of the AVHRR NDVI compared to the coastal sea ice trends and summer land surface temperature trends. Uma Bhatt published a key paper this year that showed the strong year-to-year circumpolar correlations between coastal sea-ice, land temperatures, and NDVI values. This has now been updated with a new NDVI data set provided by Jorge Pinzon and Jim Tucker at NASA-Goddard. The two graphs in the lower right show the 1982-2010 trends in NDVI along the two transects. Several things are worth noting:The trend in tundra NDVI peaked in 1989 along the Yamal transect and 2004 along the North America Transect. Since 2004 it has been declining along both transects. A particular strong dip occurred in 2009. This occurred in every area of the Arctic. In western Eurasia, a further dip occurred in 2010.The trend along the Kara has been almost flat especially since 1990, when it reached its highest value, whereas the trend in North America has been a remarkable 24%.
- This map of the floristic divisions of the Arctic by Boris Yurtsev helps to emphasize the close connections between the land areas and the Arctic Ocean.It divides the Arctic into 6 floristic provinces and 22 subprovinces.And it eparates oceanic and continental areas of the Arctic.
- Here the continental and oceanic subdivisions are colored to help distinguish them:Gray areas are the continental Arctic areas with an Arctic climate, cold winter deep permafrost, and and Arctic flora.Blue areas are treeless areas, mainly outside the true Arctic, with warm winters, no permafrost (except in mountains), and an oceanic boreal flora.Green areas are intermediate Arctic tundra but with strong oceanic influence, long periods of ice-free ocean in fall and winter
- The transitional areas with mixed oceanic and continental influences are currently the areas where the greatest ocean and land changes are occurring.THESE ARE ALSO APPROXIMATELY THE AREAS WHERE THE LARGEST CHANGES ARE PRESENTLY OCCURRING.BERING/CHUKCHI/BEAUFORT SEASFOXE BASIN/BAFFIN BAY/HUDSON BAYN. BARENTS/KARA SEA
- Dale Guthrie’s 2001 paper in QSR very nicely summarizes the differences between an Arctic region locked in ice and an Arctic with a strong maritime influence. He recognized that the land bridge that formed during the Pleistocene restricted the flow of Pacific water and moist maritime air into the Arctic. Among other things it created bright sunny skies over much of the Arctic because of more continental conditions. In this paper he also changed his mind about the nature of the land-bridge vegetation. Previously it was thought that the bridge was pretty much a continuous arid region of steppe tundra. However, recent pollen and macrofossil evidence from cores in the Bering Sea convinced him that the central area of the bridge, supported a mesic tundra vegetation similar in many respects to that covering much of northern Alaska today, He called this a “mesic tundra buckle”, which restricted the movement of many steppe animals across the bridge. When the land bridge flooded and buckle was unfastened it triggered the flow of maritime air into what was previously the driest most continental part of the Arctic.Guthrie, who studies Pleistocene faunas, also recognized that this was a likely solution to some of the puzzling distributions of large mammals in North America and Russia during the Pleistocene.
- When the land bridge opened the result was the development of much cloudier, wetter climate over much of central and northernBerningia, the development of thick moss carpets and the paludification of vast areas of the Low Arctic. This process continues, and it will be enhanced by Arctic amplification and the reducton of sea ice..
- The areas that we looked at on the ground were mainly zonal sites, those where the soils and vegetation correspond to the long-term climatic climax. These photos show representative sites along the Eurasia and North America transects in each bioclimate subzone.
- Some of the most important differences appear to be related to differences in disturbance regimes. For example, along the NAAT there is much more evergreen-shrub and lichen biomass. This could be the result of the much more intensive grazing pressure by reindeer along the the EAT. This phenomenon occurs across most of the Russian Arctic causing major differences in the structure of the vegetation.
- These differences in structure are also evident in the LAI-Biomass relationship along both transects. An equivalent amount of biomass has consistently much higher LAI values along the NAAT than along the EAT and the difference increases at higher biomass values
- These differences are reflected in graphs of the AVHRR-NDVI and biomass vs. summer warmth. The biomass shown here is a slightly different number which is a landscape-level of biomass that is derived from the biomass data in combination with detailed vegetation maps. In general the EAT is greener than the NAAT in equivalent climates.
- In spite of the structural and composition differences between the transects, there is overall a very strong relationship between 1-km AVHRR NDVI values and biomass along both transects and in the combined data set.
- Willow communities on old landslides at Vaskiny DachiLow-willow shrublands develop on landslides during 200-yr succession, greatly changing biomass and NDVI.
- The methods and results of this analysis are in the poster by Martha Raynolds et al. at this conference.