

Recommandé
Contenu connexe
Tendances
Tendances (16)
Similaire à Diabetes مهم شديد
Similaire à Diabetes مهم شديد (20)
Dernier
Dernier (20)
Diabetes مهم شديد
- 1. POSITIONSTATEMENT S14 Diabetes Care Volume 37, Supplement 1, January 2014 Standards of Medical Care in Diabetesd2014 Diabetes mellitus is a complex, chronic illness requiring continuous medical care with multifactorial risk reduction strategies beyond glycemic control. Ongoing patient self-management education and support are critical to preventing acute complications and reducing the risk of long-term complications. Significant evidence exists that supports a range of interventions to improve diabetes outcomes. The American Diabetes Association’s (ADA’s) Standards of Care are intended to provide clinicians, patients, researchers, payers, and other interested individuals with the components of diabetes care, general treatment goals, and tools to evaluate the quality of care. The Standards of Care recommendations are not intended to preclude clinical judgment and must be applied in the context of excellent clinical care and with adjustments for individual preferences, comorbidities, and other patient factors. For more detailed information about management of diabetes, refer to references 1,2. The recommendations include screening, diagnostic, and therapeutic actions that are known or believed to favorably affect health outcomes of patients with diabetes. Many of these interventions have also been shown to be cost-effective (3). A grading system (Table 1) developed by ADA and modeled after existing methods was used to clarify and codify the evidence that forms the basis for the recommendations. The letters A, B, C, or E show the evidence level that supports each recommendation. The Standards of Care conclude with evidence and recommendations for strategies to improve the process of diabetes care. It must be emphasized that clinical evidence and expert recommendations alone cannot improve patients’ lives, but must be effectively translated into clinical management. I. CLASSIFICATION AND DIAGNOSIS A. Classification Diabetes can be classified into four clinical categories: c Type 1 diabetes (due to b-cell destruction, usually leading to absolute insulin deficiency) c Type 2 diabetes (due to a progressive insulin secretory defect on the background of insulin resistance) c Otherspecifictypes of diabetes dueto other causes, e.g., geneticdefects in b-cell function, geneticdefects in insulin action, diseasesoftheexocrine pancreas(such as cysticfibrosis), anddrug-orchemical-induced (suchas in thetreatment ofHIV/ AIDS or after organ transplantation) c Gestational diabetes mellitus (GDM) (diabetes diagnosed during pregnancy that is not clearly overt diabetes) Some patients cannot be clearly classified as type 1 or type 2 diabetic. Clinical presentation and disease progression vary considerably in both types of diabetes. Occasionally, patients diagnosed with type 2 diabetes may present with ketoacidosis. Children with type 1 diabetes typically present with the hallmark symptoms of polyuria/polydipsia and occasionally with diabetic ketoacidosis (DKA). However, difficulties in diagnosis may occur in children, adolescents, and adults, with the true diagnosis becoming more obvious over time. American Diabetes Association Originally approved 1988. Most recent review/ revision October 2013. DOI: 10.2337/dc14-S014 © 2014 by the American Diabetes Association. See http://creativecommons.org/licenses/by- nc-nd/3.0/ for details.
- 2. care.diabetesjournals.org Position Statement S15 Table 1—ADA evidence grading system for Clinical Practice Recommendations Level of evidence Description A Clear evidence from well-conducted, generalizable RCTs that are adequately powered, including: c Evidence from a well-conducted multicenter trial c Evidence from a meta-analysis that incorporated quality ratings in the analysis Compelling nonexperimental evidence, i.e., “all or none” rule developed by the Center for Evidence-Based Medicine at the University of Oxford Supportive evidence from well-conducted RCTs that are adequately powered, including: c Evidence from a well-conducted trial at one or more institutions c Evidence from a meta-analysis that incorporated quality ratings in the analysis B Supportive evidence from well-conducted cohort studies c Evidence from a well-conducted prospective cohort study or registry c Evidence from a well-conducted meta-analysis of cohort studies Supportive evidence from a well-conducted case-control study C Supportive evidence from poorly controlled or uncontrolled studies c Evidence from randomized clinical trials with one or more major or three or more minor methodological flaws that could invalidate the results c Evidence from observational studies with high potential for bias (such as case series with comparison with historical controls) c Evidence from case series or case reports Conflicting evidence with the weight of evidence supporting the recommendation E Expert consensus or clinical experience abnormal hemoglobins should be used. An updated list is available at www.ngsp. org/interf.asp. In situations of abnormal red cell turnover, such as pregnancy, recent blood loss or transfusion, or some anemias, only blood glucose criteria should be used to diagnose diabetes. Fasting and Two-Hour Plasma Glucose In addition to the A1C test, the FPG and 2-h PG may also be used to diagnose diabetes. The current diagnostic criteria for diabetes are summarized in Table 2. The concordance between the FPG and 2-h PG tests is ,100%. The concordance between A1C and either glucose-based testisalsoimperfect.NationalHealthand Nutrition Examination Survey (NHANES) data indicate that the A1C cut point of $6.5%identifiesone-thirdfewercasesof undiagnosed diabetes than a fasting glucose cut point of $126 mg/dL (7.0 mmol/L) (11). Numerous studies have confirmed that, at these cut points, the B. Diagnosis of Diabetes Diabetes is usually diagnosed based on plasma glucose criteria, either the fasting plasma glucose (FPG) or the 2-h plasma glucose (2-h PG) value after a 75-g oral glucose tolerance test (OGTT) (4). Recently, an International Expert Committee added the A1C (threshold $6.5%) as a third option to diagnose diabetes (5) (Table 2). A1C The A1C test should be performed using a method that is certified by the National Glycohemoglobin Standardization Program (NGSP) and standardized or traceable to the Diabetes Control and Complications Trial (DCCT) reference assay. Although point-of-care (POC) A1C assays may be NGSP-certified, proficiencytesting is not mandated for performing the test, so use of these assays for diagnostic purposes may be problematic. Epidemiological data show a similar relationship of A1C with the risk of retinopathy as seen with FPG and 2-h PG. The A1C has several advantages to the FPG and OGTT, including greater convenience (fasting not required), possibly greater preanalytical stability, and less day-to-day perturbations during stress and illness. These advantagesmust bebalancedbygreater cost, the limited availability of A1C testing in certain regions of the developing world, and the incomplete correlation between A1C and average glucose in certain individuals. Race/Ethnicity A1C levels may vary with patients’ race/ ethnicity (6,7). Glycation rates may differ by race. For example, African Americans mayhavehigherratesofglycation,butthis is controversial. A recent epidemiological study found that, when matched for FPG, African Americans (with and without diabetes) had higher A1Cthan non- Hispanicwhites,butalsohadhigherlevels offructosamineandglycatedalbuminand lower levels of 1,5 anhydroglucitol, suggestingthat their glycemic burden (particularly postprandially) may be higher (8). Epidemiological studies forming the framework for recommending A1C to diagnosediabetes have all been in adult populations. It is unclear if the same A1C cut point should be used to diagnose children or adolescents with diabetes (9,10). Anemias/Hemoglobinopathies Interpreting A1Clevels in the presenceof certain anemiasandhemoglobinopathies is particularly problematic. For patients withanabnormalhemoglobinbutnormal red cell turnover, such as sickle cell trait, an A1C assay without interference from 2-hOGTTvaluediagnosesmorescreened people with diabetes (12). In reality, a large portion of the diabetic population remains undiagnosed. Of note, the lower sensitivity of A1C at the designated cut pointmaybeoffset bythetest’s abilityto facilitate the diagnosis. As with most diagnostic tests, a test result should be repeated when feasible Table 2—Criteria for the diagnosis of diabetes A1C$6.5%. Thetest shouldbeperformed in a laboratory using a method that is NGSP certified and standardized to the DCCT assay.* OR FPG $126 mg/dL (7.0 mmol/L). Fasting is defined as no caloric intake for at least 8 h.* OR Two-hour PG $200 mg/dL (11.1 mmol/L) during an OGTT. The test should be performed as described by the WHO, using a glucose load containing the equivalent of 75 g anhydrous glucose dissolved in water.* OR In a patient with classic symptoms of hyperglycemia or hyperglycemic crisis, a random plasma glucose $200 mg/dL (11.1 mmol/L). *In the absence of unequivocal hyperglycemia, result should be confirmed by repeat testing.
- 3. S16 Position Statement Diabetes Care Volume 37, Supplement 1, January 2014 to rule out laboratory error (e.g., an elevated A1C should be repeated when feasible,andnotnecessarilyin3months). Unless there is a clear clinical diagnosis (e.g., apatientinahyperglycemiccrisisor classic symptoms of hyperglycemia and a random plasma glucose $200 mg/dL), it is preferable that the same test be repeated for confirmation, since there will be a greater likelihood of concurrence. For example, if the A1C is 7.0% and a repeat result is 6.8%, the diagnosis of diabetes is confirmed. If two different tests (such as A1C and FPG) are both abovethe diagnostic threshold, this also confirms the diagnosis. On the other hand, if a patient has discordant results on two different tests, then the test result that is above the diagnostic cut point should be repeated. The diagnosis is made on the basis of the confirmed test. For example, if apatientmeetsthediabetescriterionof the A1C(two results $6.5%) but not the FPG (,126 mg/dLor 7.0 mmol/L), or vice versa, that person should be considered to have diabetes. Since there is preanalytic and analytic variabilityofallthetests,itispossiblethat an abnormal result (i.e., above the diagnostic threshold), when repeated, will produceavalue belowthe diagnostic cut point. This is least likely for A1C, somewhat more likely for FPG, and most likely for the 2-h PG. Barring a laboratory error, such patients will likely have test results nearthemarginsof the diagnostic threshold. The health care professional might opt to follow the patient closely and repeat the test in 3–6 months. C. Categories of Increased Risk for Diabetes (Prediabetes) In 1997 and2003, theExpert Committee on Diagnosis and Classification of Diabetes Mellitus (13,14) recognized a group of individuals whose glucose levels did not meet the criteria for diabetes, but were too high to be considered normal. These persons were defined as having impaired fasting glucose(IFG)(FPGlevels100–125mg/dL [5.6–6.9 mmol/L]), or impaired glucose tolerance (IGT) (2-h PG OGTT values of 140–199 mg/dL [7.8–11.0 mmol/L]). It should benoted that the WorldHealth Organization (WHO) and a number of other diabetes organizations define the cutoff for IFG at 110mg/dL(6.1 mmol/L). “Prediabetes” is the term used for individuals with IFG and/or IGT, indicating the relatively high risk for the futuredevelopmentofdiabetes.IFGand IGT should not be viewed as clinical entities in their own right but rather risk factors for diabetes and cardiovascular disease (CVD). IFG and IGT are associated with obesity (especially abdominal or visceral obesity), dyslipidemia with high triglycerides and/or low HDL cholesterol, and hypertension. As with the glucose measures, several prospective studies that used A1C to predict the progression to diabetes demonstrated a strong, continuous association between A1C and subsequent diabetes. In a systematic review of 44,203 individuals from 16 cohort studies with a follow-up interval averaging 5.6 years (range 2.8–12 years), those with an A1C between 5.5 and 6.0% had a substantially increased risk of diabetes (5-year incidences from 9 to 25%). An A1C range of 6.0–6.5% had a 5-year risk of developing diabetes between 25–50%, and a relative risk (RR) 20 times higher compared with an A1Cof 5.0% (15). In acommunity-based study of African American and non- Hispanic white adults without diabetes, baselineA1Cwasastrongerpredictorof subsequent diabetes and cardiovascular events than fasting glucose (16). Other analyses suggest that an A1C of 5.7% is associated with similar diabetes risk to the high-risk participants in the Diabetes Prevention Program (DPP) (17). Hence, it is reasonable to consider an A1C range of 5.7–6.4% as identifying individuals with prediabetes. As with thosewith IFGandIGT, individuals with an A1Cof 5.7–6.4% should beinformed of their increased risk for diabetes and CVD and counseled about effective strategies to lower their risks (see Section IV). Similar to glucose measurements, the continuum of risk is curvilinear, so as A1C rises, the diabetes risk rises disproportionately (15). Aggressive interventions and vigilant follow-up should be pursued for those considered at very high risk (e.g., those with A1Cs .6.0%). Table 3 summarizes the categories of prediabetes. II. TESTING FOR DIABETES IN ASYMPTOMATIC PATIENTS Recommendations c Testing to detect type 2 diabetes and prediabetes in asymptomatic people should be considered in adults of any age who are overweight or obese (BMI $25 kg/m2 ) and who have one or more additional risk factors for diabetes (Table 4). In those without these risk factors, testing should begin at age 45 years. B c If tests are normal, repeat testing at least at 3-year intervals is reasonable. E c To test for diabetes or prediabetes, the A1C, FPG, or 2-h 75-g OGTT are appropriate. B c In those identified with prediabetes, identify and, if appropriate, treat other CVD risk factors. B The same tests are used for both screening and diagnosing diabetes. Diabetes may be identified anywhere along the spectrum of clinical scenarios: from a seemingly low-risk individual who happens to have glucose testing, to a higher-risk individual whom the provider tests because of high suspicion of diabetes, and finally, to the symptomatic patient. Thediscussionherein isprimarily framed as testing for diabetes in asymptomatic individuals. The same assays used for testing will also detect individuals with prediabetes. A. Testing for Type 2 Diabetes and Risk of Future Diabetes in Adults Prediabetes and diabetes meet established criteria for conditions in which early detection is appropriate. Both conditions are common, are increasing in prevalence, and impose Table 3—Categories of increased risk for diabetes (prediabetes)* FPG100mg/dL(5.6 mmol/L)to125mg/dL (6.9 mmol/L) (IFG) OR 2-h PG in the 75-g OGTT 140 mg/dL (7.8 mmol/L) to 199 mg/dL (11.0 mmol/L) (IGT) OR A1C 5.7–6.4% *For all three tests, risk is continuous, extendingbelowthelowerlimit oftherange and becoming disproportionately greater at higher ends of the range.
- 4. care.diabetesjournals.org Position Statement S17 Table 4—Criteria for testing for diabetes in asymptomatic adult individuals 1. Testingshouldbeconsideredin alladultswhoareoverweight(BMI $25kg/m 2 *) andhave additional risk factors: c physical inactivity c first-degree relative with diabetes c high-risk race/ethnicity (e.g., African American, Latino, Native American, Asian American, Pacific Islander) c women who delivered a baby weighing .9 lb or were diagnosed with GDM c hypertension ($140/90 mmHg or on therapy for hypertension) c HDL cholesterol level ,35 mg/dL (0.90 mmol/L) and/or a triglyceride level .250 mg/dL (2.82 mmol/L) c women with polycystic ovarian syndrome c A1C $5.7%, IGT, or IFG on previous testing c other clinical conditions associated with insulin resistance (e.g., severe obesity, acanthosis nigricans) c history of CVD 2. In the absence of the above criteria, testing for diabetes should begin at age 45 years. 3. If results are normal, testing should be repeated at least at 3-year intervals, with consideration of more frequent testing depending on initial results (e.g., those with prediabetes should be tested yearly) and risk status. *At-risk BMI may be lower in some ethnic groups. risk factors, testing should begin at age 45 years. The A1C, FPG, or the 2-h OGTT are appropriate for testing. It should be noted that the tests do not necessarily detect diabetes in the same individuals. Theefficacy of interventions for primary prevention of type 2 diabetes (23–29) has primarily been demonstrated among individuals with IGT, not for individuals with isolated IFG or for individuals with specific A1C levels. Testing Interval The appropriate interval between tests is not known (30). The rationale for the 3-yearinterval isthat falsenegativeswill be repeated before substantial time elapses. It is also unlikely that an individual will develop significant complications of diabetes within 3 years significant public health burdens. There is often a long presymptomatic phase before the diagnosis of type 2 diabetes is made. Simple tests to detect preclinical diseasearereadilyavailable.Theduration of glycemic burden is a strong predictor of adverse outcomes, and effective interventionsexist topreventprogression ofprediabetestodiabetes(seeSectionIV) and to reduce risk of complications of diabetes (see Section VI). Type 2 diabetes is frequently not diagnosed until complications appear. Approximately one-fourth of the U.S. population may have undiagnosed diabetes.Massscreeningofasymptomatic individuals has not effectively identified those with prediabetes or diabetes, and rigorous clinical trials to provide such proof are unlikely to occur. In a large randomized controlled trial (RCT) in Europe,generalpracticepatientsbetween theagesof40–69yearswerescreenedfor diabetes, then randomized by practice to routine diabetes care or intensive treatmentofmultipleriskfactors.After5.3 years of follow-up, CVDrisk factors were modestly but significantly improved with intensivetreatment.IncidenceoffirstCVD event and mortality rates were not significantly different between groups (18). This study would seem to add support for early treatment of screen- detected diabetes, as risk factor control was excellent even in the routine treatmentarmandbothgroupshadlower event rates than predicted. The absence of a control unscreened arm limits the ability to definitely prove that screening impacts outcomes. Mathematical modeling studies suggest that screening, independent of risk factors, beginning at age30 or 45 years is highly cost-effective (,$11,000 per quality-adjusted life-year gained) (19). BMI Cut Points Testing recommendations for diabetes in asymptomatic, undiagnosed adults are listed in Table 4. Testing should be consideredin adultsofanyagewith BMI $25 kg/m2 and one or more of the known risk factors for diabetes. In additiontothelisted risk factors,certain medications, such as glucocorticoids and antipsychotics (20), are known to increase the risk of type 2 diabetes. There is compelling evidence that lower BMI cut points suggest diabetes risk in some racial and ethnic groups. In alarge multiethnic cohort study, for an equivalent incidence rate of diabetes conferred by a BMI of 30 kg/m2 in non- Hispanic whites, the BMI cutoff value was 24 kg/m2 in South Asians, 25 kg/m2 in Chinese, and 26 kg/m2 in African Americans (21). Disparities in screening rates, not explainable by insurance status, are highlighted by evidence that despitemuchhigherprevalence oftype2 diabetes, ethnic minorities in an insured population are no more likely than non- Hispanic whites to be screened for diabetes (22). Because ageis a major risk factorfordiabetes,inthosewithoutthese of a negative test result. In the modeling study,repeatscreeningevery3 or5years was cost-effective (19). Community Screening Testing should be carried out within the health care setting because of the need for follow-up and discussion of abnormal results. Community screening outside a health care setting is not recommended because people with positive tests may not seek, or have access to, appropriate follow-up testing and care. Conversely, there may be failure to ensure appropriate repeat testing for individuals who test negative. Community screening may also be poorly targeted; i.e., it may fail to reach the groups most at risk and inappropriately test those at low risk or even those already diagnosed. B. Screening for Type 2 Diabetes in Children Recommendation c Testing to detect type 2 diabetes and prediabetes should be considered in children and adolescents who are overweight and who have two or more additional risk factors for diabetes (Table 5). E In thelast decade,the incidenceof type2 diabetes in adolescents has increased dramatically, especially in minority populations (31). As with adult recommendations, children and youth at increased risk for the presence or the developmentoftype2diabetesshouldbe tested within the health care setting (32).
- 5. S18 Position Statement Diabetes Care Volume 37, Supplement 1, January 2014 A1C in Pediatrics Recent studies question the validity of A1Cinthepediatricpopulation,especially in ethnic minorities, andsuggestOGTTor FPG as more suitable diagnostic tests (33). However, many of these studies do not recognize that diabetes diagnostic criteria are based upon long-term health outcomes, and validations are not currently available in the pediatric population (34). ADA acknowledges the limited data supporting A1C for diagnosing diabetes in children and adolescents. However, aside from rare instances, such as cystic fibrosis and hemoglobinopathies, ADA continues to recommend A1C in this cohort (35,36). The modified recommendations of the ADA consensus statement “Type 2 DiabetesinChildrenandAdolescents” are summarized in Table 5. C. Screening for Type 1 Diabetes Recommendation c Inform type 1 diabetic patients of the opportunity to have their relatives screenedfor type1 diabetes risk in the setting of a clinical research study. E Type 1 diabetic patients often present with acute symptoms of diabetes and markedly elevated blood glucose levels, and some cases are diagnosed with life- threatening ketoacidosis. The incidence Table 5—Testing for type 2 diabetes in asymptomatic children* Criteria c Overweight(BMI.85thpercentilefor age and sex, weight for height .85th percentile, or weight .120% of ideal for height) Plus any two of the following risk factors: c Family history of type 2 diabetes in first- or second-degree relative c Race/ethnicity (Native American, African American, Latino, Asian American, Pacific Islander) c Signs of insulin resistance or conditions associated with insulin resistance (acanthosis nigricans, hypertension, dyslipidemia, polycystic ovarian syndrome, or small-for-gestational-age birth weight) c Maternal history of diabetes or GDM during the child’s gestation Age of initiation: age 10 years or at onset of puberty, if puberty occurs at a younger age Frequency: every 3 years *Persons aged 18 years and younger. and prevalence of type 1 diabetes is increasing (31,37,38). Several studies suggestthatmeasuringisletautoantibodies in relatives of those with type 1 diabetes mayidentify individuals who are at risk for developingtype 1 diabetes. Such testing, coupled with education about diabetes symptoms and close follow-up in an observational clinical study, mayenable earlier identification of type 1 diabetes onset. A recent study reported the risk of progression to type 1 diabetes from the time of seroconversion to autoantibody positivity in three pediatric cohorts from Finland, Germany, and the U.S. Ofthe 585 children who developedmore than two autoantibodies,nearly70%developedtype 1 diabetes within 10 years and 84%within 15 years (39,40). These findingsare highly significant because, while the German groupwas recruited from offspring of parents with type 1 diabetes, the Finnish and Coloradogroupswere recruited from the generalpopulation. Remarkably, the findingsin all three groupswere the same, suggestingthat the samesequenceof events led to clinical disease in both “sporadic” and geneticcases of type 1 diabetes. Thereis evidence tosuggestthat early diagnosis may limit acute complications (39) and extend long-term endogenousinsulin production (41). While there is currently a lack of accepted screening programs, oneshould consider referring relatives of those with type 1 diabetes for antibody testing for risk assessment in the setting of a clinical research study(http://www2. diabetestrialnet.org). Widespread clinical testing of asymptomatic low-risk individuals is not currently recommended. Higher-risk individuals may be screened, but only in the context of a clinical research setting. Individuals who screen positive will be counseled about the risk of developing diabetes, diabetes symptoms, and the prevention of DKA. Numerous clinical studiesarebeingconductedtotestvarious methods of preventing type 1 diabetes in those with evidence of autoimmunity (www.clinicaltrials.gov). III. DETECTION AND DIAGNOSIS OF GESTATIONAL DIABETES MELLITUS Recommendations c Screen for undiagnosed type 2 diabetes at the first prenatal visit in thosewith riskfactors, usingstandard diagnostic criteria. B c Screen for GDM at 24–28 weeks of gestation in pregnant women not previously known to have diabetes. A c Screen women with GDM for persistent diabetes at 6–12 weeks postpartum, using the OGTT and nonpregnancy diagnostic criteria. E c Women with ahistory of GDMshould have lifelong screening for the development of diabetes or prediabetes at least every 3 years. B c Women with a history of GDM found to have prediabetes should receive lifestyle interventions or metformin to prevent diabetes. A c Further research is needed to establish a uniform approach to diagnosing GDM. E For many years, GDM was defined as any degree of glucose intolerance with onset or first recognition during pregnancy (13), whether or not the condition persisted after pregnancy, and not excluding the possibility that unrecognized glucose intolerance may have antedated or begun concomitantly with the pregnancy. This definition facilitated a uniform strategy for detection and classification of GDM, but its limitations were recognized for many years. As the ongoing epidemic of obesity and diabetes has led to more type 2 diabetes in women of childbearing age, the number of pregnant women with undiagnosed type 2 diabetes has increased (42). Because of this, it is reasonable to screen women with risk factors for type 2 diabetes (Table 4) at their initial prenatal visit, using standard diagnostic criteria (Table 2). Women with diabetes in the first trimester should receive a diagnosis of overt, not gestational, diabetes. GDM carries risks for the mother and neonate. Not all adverse outcomes are of equal clinical importance. The Hyperglycemia and Adverse Pregnancy Outcome (HAPO) study (43), a large- scale (;25,000 pregnant women) multinational epidemiological study, demonstrated that risk of adverse maternal, fetal, and neonatal outcomes continuously increased as a function of maternal glycemia at 24–28
- 6. care.diabetesjournals.org Position Statement S19 weeks, even within ranges previously considered normal for pregnancy. For most complications, there was no threshold for risk. These results have led to careful reconsideration of the diagnostic criteria for GDM. GDM screening can be accomplished with either of two strategies: 1. “One-step” 2-h 75-g OGTT or 2. “Two-step” approach with a 1-h 50-g (nonfasting) screen followed by a 3-h 100-g OGTT for those who screen positive (Table 6) Different diagnostic criteria will identify different magnitudes of maternal hyperglycemia and maternal/fetal risk. In the 2011 Standards of Care (44), ADA for the first time recommended that all pregnant women not known to have prior diabetes undergo a 75-g OGTT at 24–28 weeks of gestation based on an International Association of Diabetes and Pregnancy Study Groups (IADPSG) Table 6—Screening for and diagnosis of GDM “One-step” (IADPSG consensus) Perform a 75-g OGTT, with plasma glucose measurement fasting and at 1 and 2 h, at 24–28 weeks of gestation in women not previously diagnosed with overt diabetes. The OGTT should be performed in the morning after an overnight fast of at least 8 h. The diagnosisof GDMis made when any of the following plasma glucose values are exceeded: c Fasting: $92 mg/dL (5.1 mmol/L) c 1 h: $180 mg/dL (10.0 mmol/L) c 2 h: $153 mg/dL (8.5 mmol/L) “Two-step” (NIH consensus) Perform a 50-g GLT (nonfasting), with plasma glucose measurement at 1 h (Step 1), at 24–28 weeks of gestation in women not previously diagnosed with overt diabetes. If the plasmaglucoselevel measured1 h after the loadis $140 mg/dL* (7.8 mmol/L), proceedto 100-gOGTT(Step 2). The 100-gOGTTshould be performed when the patient is fasting. The diagnosis of GDM is made when at least two of the following four plasma glucose levels (measured fasting, 1 h, 2 h, 3 h after the OGTT) are met or exceeded: Carpenter/Coustan or NDDG c Fasting 95 mg/dL (5.3 mmol/L) 105 mg/dL (5.8 mmol/L) c 1h 180 mg/dL (10.0 mmol/L) 190 mg/dL (10.6 mmol/L) c 2h 155 mg/dL (8.6 mmol/L) 165 mg/dL (9.2 mmol/L) c 3h 140 mg/dL (7.8 mmol/L) 145 mg/dL (8.0 mmol/L) NDDG, National Diabetes Data Group. *The American College of Obstetricians and Gynecologists (ACOG) recommends a lower threshold of 135 mg/dL (7.5 mmol/L) in high-risk ethnic minorities with higher prevalence of GDM; some experts also recommend 130 mg/dL (7.2 mmol/L). consensus meeting (45). Diagnostic cut points for the fasting, 1-h, and 2-h PG measurements were defined that conveyed an odds ratio for adverse outcomes of at least 1.75 compared with women with the mean glucose levels in the HAPO study, a strategy anticipated to significantly increase the prevalence of GDM (from 5–6% to ;15–20%), primarily because only one abnormal value, not two, is sufficient to make the diagnosis. ADA recognized that the anticipated increase in the incidence of GDM diagnosed by these criteriawouldhavesignificantimpacton the costs, medical infrastructure capacity, and potential for increased “medicalization” of pregnancies previously categorized as normal, but recommended these diagnostic criteria changes in the context of worrisome worldwide increases in obesity and diabetes rates with the intent of optimizing gestational outcomes for women and their babies. It is important to note that 80–90% of women in both of the mild GDMstudies (whose glucose values overlapped with the thresholds recommended herein) could be managed with lifestyle therapy alone. The expected benefits to these pregnancies and offspring are inferred from intervention trials that focused on women with lower levels of hyperglycemiathanidentifiedusingolder GDM diagnostic criteria and that found modest benefits including reduced rates of large-for-gestational-age (LGA) births (46,47). However, while treatment of lower threshold hyperglycemia can reduce LGA, it has not been shown to reduce primary cesarean delivery rates. Data are lacking on how treatment of lower threshold hyperglycemia impacts prognosis of future diabetes for the mother and future obesity, diabetes risk, or other metabolic consequences for the offspring. Thefrequencyoffollow-upand blood glucose monitoring for these women has also not yet been standardized, but is likely to be less intensive than for women diagnosed by the older criteria. National Institutes of Health Consensus Report Since this initial IADPSG recommendation, the National Institutes of Health (NIH) completed a consensus development conference involving a 15-member panel with representatives from obstetrics/ gynecology, maternal-fetal medicine, pediatrics, diabetes research, biostatistics, and other related fields (48). Reviewing the sameavailable data, the NIH consensus panel recommended continuation of the “two-step” approach of screening with a 1-h 50-g glucoseload test (GLT) followed bya3-h 100-g OGTT for those who screen positive, a strategy commonly used in the U.S. Key factors reported in the NIH panel’s decision-making process were the lack of clinical trial interventions demonstrating the benefits of the “one- step” strategy and the potential negative consequences of identifying a large new group of women with GDM. Moreover, screening with a 50-g GLT does not require fasting and is therefore easier to accomplish for many women. Treatment of higher threshold maternal hyperglycemia, as identified by the two- step approach, reduces rates of neonatal macrosomia, LGA, and shoulder dystocia, without increasing small-for-gestational- agebirths (49). How do two different groups of experts arrive at different GDM screening and diagnosis recommendations? Because glycemic dysregulation exists on a continuum, the decision to pick a single binary threshold for diagnosis requires balancing the harms and benefits associated with greater versus lesser sensitivity. While data from the HAPO study demonstrated a correlation between increased fasting glucose levels identified through the “one-step” strategywith increasedoddsfor adverse
- 7. S20 Position Statement Diabetes Care Volume 37, Supplement 1, January 2014 pregnancy outcomes, this large observational study was not designed to determine the benefit of intervention. Moreover, there are no available cost-effective analyses to examine the balance of achieved benefits versus the increased costs generated by this strategy. The conflicting recommendations from these two consensus panels underscore several key points: 1. There are insufficient data to stronglydemonstrate the superiority of one strategy over the other. 2. The decision of which strategy to implement must therefore be made based on the relative values placed on currently unmeasured factors (e.g., cost-benefit estimation, willingness to change practice based on correlation studies rather than clinical intervention trial results, relative role of cost considerations, and available infrastructure). 3. Further research isneededtoresolve these uncertainties. There remains strong consensus that establishing a uniform approach to diagnosing GDM will have extensive benefits for patients, caregivers, and policymakers. Longer-term outcome studies are currently underway. Because some cases of GDM may represent preexisting undiagnosed type 2 diabetes, women with a history of GDM should be screened for diabetes 6–12 weeks postpartum, using nonpregnant OGTT criteria. Because of their antepartum treatment for hyperglycemia, A1C for diagnosis of persistent diabetes at the postpartum visit is not recommended (50). Women with a history of GDM have a greatly increased subsequent diabetes risk (51) and should be followed up with subsequent screening for the development of diabetes or prediabetes, as outlined in Section II. Lifestyle interventions or metformin should be offered to women with a history of GDM who develop prediabetes, as discussed in Section IV. In the prospective Nurses’ Health Study II, subsequent diabetes risk after a history of GDM was significantly lower in women who followed healthy eating patterns. Adjusting for BMI moderately, but not completely, attenuated this association (52). IV. PREVENTION/DELAY OF TYPE 2 DIABETES Recommendations c Patients with IGT A, IFG E, or an A1C 5.7–6.4% E should be referred to an effective ongoing support program targeting weight loss of 7% of body weight and increasing physical activity to at least 150 min/week of moderate activity such as walking. c Follow-up counseling appears to be important for success. B c Based on the cost-effectiveness of diabetes prevention, such programs should be covered by third-party payers. B c Metformin therapy for prevention of type 2 diabetes may be considered in those with IGT A, IFG E, or an A1C 5.7–6.4% E, especially for those with BMI .35 kg/m2 , aged ,60 years, and women with prior GDM. A c At least annual monitoring for the development of diabetes in those with prediabetes is suggested. E c Screening for and treatment of modifiable risk factors for CVD is suggested. B RCTshaveshownthatindividualsat high risk for developing type 2 diabetes (IFG, IGT, or both) can significantly decrease the rate of diabetes onset with particular interventions (23–29). These include intensive lifestyle modification programs that have been shown to be very effective (;58% reduction after 3 years) and pharmacological agents metformin, a-glucosidase inhibitors, orlistat, and thiazolidinediones, each of which has been shown to decrease incident diabetes to various degrees. Follow-up of all three large studies of lifestyle intervention has shown sustained reduction in the rate of conversion to type 2 diabetes, with 43% reduction at 20 years in the Da Qing study (53), 43% reduction at 7 years in the Finnish Diabetes Prevention Study (DPS) (54), and 34% reduction at 10 years in the U.S. Diabetes Prevention Program Outcomes Study (DPPOS) (55). A cost-effectiveness model suggested that lifestyle interventions as delivered in the DPP are cost-effective (56), and actual cost data from the DPP and DPPOS confirm that lifestyle interventions are highly cost-effective (57). Group delivery of the DPP intervention in community settings has the potential to be significantly less expensive while still achieving similar weight loss (58). The Centers for Disease Control and Prevention (CDC) helps coordinate the National Diabetes Prevention Program, a resourcedesigned to bring evidence-based lifestyle change programs for preventing type 2 diabetes to communities (http://www.cdc.gov/ diabetes/prevention/index.htm). Given the clinical trial results and the known risks of progression of prediabetes to diabetes, persons with an A1C of 5.7–6.4%, IGT, or IFG should be counseled on lifestyle changes with goals similar to those of the DPP (7% weight loss and moderate physical activity of at least 150 min/week). Metformin has a strong evidence base and demonstrated long-term safety as pharmacological therapy for diabetes prevention (59). For other drugs, cost, side effects, and lack of a persistent effect require consideration (60). Metformin Metformin was less effective than lifestyle modification in the DPP and DPPOS, but may be cost-saving over a 10-yearperiod(57).It wasaseffectiveas lifestyle modification in participants with a BMI $35 kg/m2 , but not significantly better than placebo in those over age60 years (23). In the DPP, for women with a history of GDM, metformin and intensive lifestyle modification led to an equivalent 50% reduction in diabetes risk (61). Metformin therefore might reasonably be recommended for very-high-risk individuals (e.g., history of GDM, very obese, and/or those with more severe or progressive hyperglycemia). People with prediabetes often have other cardiovascularriskfactors, suchas obesity, hypertension, and dyslipidemia, and are at increased risk for CVD events. While treatment goals are the same as for other patients without diabetes, increased vigilance is warranted to identify and treat these and other risk factors (e.g., smoking).
- 8. care.diabetesjournals.org Position Statement S21 V. DIABETES CARE A. Initial Evaluation A complete medical evaluation should be performed to classify the diabetes, detect the presence of diabetes complications, review previous treatment and risk factor control in patients with established diabetes, assist in formulating a management plan, and provide abasis for continuing care. Laboratory tests appropriate to the evaluation of each patient’s medical condition should be completed. Afocus on the components of comprehensive care (Table 7) will enable the health care team to optimally manage the patient with diabetes. B. Management People with diabetes should receive medical care from a team that may include physicians, nurse practitioners, physician’s assistants, nurses, dietitians, pharmacists, and mental health professionals with expertise in diabetes. In this collaborative and integrated team approach, the individuals with diabetes must also assume an active role in their care. The management plan should be formulated as a collaborative therapeutic alliance among the patient and family, the physician, and other members of the health care team. A variety of strategies and techniques should be used to provide adequate education and development of problem-solving skills in the numerous aspects of diabetes management. Treatment goals and plans should be individualized and take patient preferences into account. The management plan should recognize diabetes self-management education (DSME)andongoingdiabetessupportas integral components of care. In Table 7—Components of the comprehensive diabetes evaluation Medical history c Ageand characteristics of onset of diabetes (e.g., DKA, asymptomatic laboratory finding) c Eatingpatterns, physicalactivity habits, nutritional status, andweight history; growthand development in children and adolescents c Diabetes education history c Review of previous treatment regimens and response to therapy (A1C records) c Current treatment of diabetes, including medications, medicationadherence and barriers thereto, meal plan, physical activity patterns, and readiness for behavior change c Results of glucose monitoring and patient’s use of data c DKA frequency, severity, and cause c Hypoglycemic episodes c Hypoglycemia awareness c Any severe hypoglycemia: frequency and cause c History of diabetes-related complications c Microvascular: retinopathy, nephropathy, neuropathy (sensory, including history of foot lesions; autonomic, including sexual dysfunction and gastroparesis) c Macrovascular: CHD, cerebrovascular disease, and PAD c Other: psychosocial problems,* dental disease* Physical examination c Height, weight, BMI c Blood pressure determination, including orthostatic measurements when indicated c Fundoscopic examination* c Thyroid palpation c Skin examination (for acanthosis nigricans and insulin injection sites) c Comprehensive foot examination c Inspection c Palpation of dorsalis pedis and posterior tibial pulses c Presence/absence of patellar and Achilles reflexes c Determination of proprioception, vibration, and monofilament sensation Laboratory evaluation c A1C, if results not available within past 2–3 months c If not performed/available within past year c Fasting lipid profile, including total, LDL, and HDL cholesterol and triglycerides c Liver function tests c Test for urine albumin excretion with spot urine albumin-to-creatinine ratio c Serum creatinine and calculated GFR c TSH in type 1 diabetes, dyslipidemia, or women over age 50 years Referrals c Eye care professional for annual dilated eye exam c Family planning for women of reproductive age c Registered dietitian for MNT c DSME c Dentist for comprehensive periodontal examination c Mental health professional, if needed *See appropriate referrals for these categories. developing the plan, consideration should be given to the patient’s age, school or work schedule and conditions, physical activity, eating patterns, social situation and cultural factors, presence of diabetes complications, health priorities, and other medical conditions. C. Glycemic Control 1. Assessment of Glycemic Control Two primary techniques are available for health providers and patients to assess the effectiveness of the management plan on glycemic control: patient self-monitoring of bloodglucose (SMBG) or interstitial glucose, and A1C. a. Glucose Monitoring Recommendations c Patients on multiple-dose insulin (MDI) or insulin pumptherapy should do SMBG prior to meals and snacks, occasionally postprandially, at bedtime, prior to exercise, when they suspect low blood glucose, after treating low blood glucose until they are normoglycemic, and prior to critical tasks such as driving. B c When prescribed as part of a broader educational context, SMBG results may be helpful to guide treatment decisions and/or patient self- management for patients using less frequent insulin injections or noninsulin therapies. E c When prescribing SMBG, ensure that patients receive ongoing instruction and regular evaluation of SMBG technique and SMBG results, as well as their ability to use SMBG data to adjust therapy. E c When used properly, continuous glucose monitoring (CGM) in
- 9. ı S22 Position Statement Diabetes Care Volume 37, Supplement 1, January 2014 conjunction with intensive insulin regimens is auseful tool to lower A1C in selected adults (aged $25 years) with type 1 diabetes. A c Although the evidence for A1C lowering is less strong in children, teens, and younger adults, CGM may be helpful in these groups. Success correlates with adherence to ongoing use of the device. C c CGM may be a supplemental tool to SMBG in those with hypoglycemia unawareness and/or frequent hypoglycemic episodes. E Major clinical trials of insulin-treated patients that demonstrated the benefits of intensive glycemic control on diabetes complications have included SMBG as part of multifactorial interventions, suggestingthat SMBGis a component of effective therapy. SMBG allows patients to evaluate their individual response to therapy and assess whether glycemic targets are being achieved. Results of SMBG can be useful in preventing hypoglycemia and adjusting medications (particularly prandial insulin doses), medical nutrition therapy (MNT), and physical activity. Evidence also supports a correlation between SMBG frequency and lower A1C (62). SMBG frequency and timing should be dictated by the patient’s specific needs and goals. SMBG is especially important for patients treated with insulin to monitor for and prevent asymptomatic hypoglycemia and hyperglycemia. Most patients with type 1 diabetes or on intensive insulin regimens (MDI or insulin pump therapy) should consider SMBG prior to meals and snacks, occasionally postprandially, at bedtime, priorto exercise, when theysuspect low blood glucose, after treating low blood glucose until they are normoglycemic, andpriorto critical tasks such asdriving. For many patients, this will require testing 6–8 times daily, although individual needs may vary. A database study of almost 27,000 children and adolescents with type 1 diabetes showed that, after adjustment for multiple confounders, increased daily frequency of SMBG was significantly associated with lower A1C (20.2% per additional test per day, leveling off at five tests per day) and with fewer acute complications (63). For patients on nonintensive insulin regimens, such as those with type 2 diabetes on basal insulin, whentoprescribeSMBGandthe testing frequency are unclear because there is insufficient evidence for testing in this cohort. Several randomized trials have called intoquestiontheclinical utilityandcost- effectiveness of routine SMBG in noninsulin-treated patients (64–66). A recent meta-analysis suggested that SMBG reduced A1C by 0.25% at 6 months (67), but a Cochrane review concluded that the overall effect of SMBG in such patients is minimal up to 6 months after initiation and subsides after 12 months (68). A key consideration is that SMBG alone does not lower blood glucose level; to be useful, the information must be integrated into clinical and self- management plans. SMBG accuracy is instrument and user dependent (69), so it is important to evaluate each patient’s monitoring technique, both initially and at regular intervals thereafter. Optimal use of SMBG requires proper review and interpretation of the data, both by the patient and provider. Among patients whocheckedtheir bloodglucoseat least once daily, many reported taking no action when results were high or low (70). In one study of insulin-na¨ve patients with suboptimalinitial glycemic control, use of structured SMBG (a paper tool to collect and interpret 7-point SMBG profiles over 3 days at least quarterly) reduced A1C by 0.3% more than an active control group (71). Patients should be taught how to use SMBG data to adjust food intake, exercise, or pharmacological therapy to achievespecificgoals. Theongoingneed for and frequency of SMBG should be reevaluated at each routine visit. Continuous Glucose Monitoring Real-time CGM through the measurement of interstitial glucose (which correlates well with plasma glucose) is available. These sensors require calibration with SMBG, and the latter are still required for making acute treatment decisions. CGM devices have alarms for hypo- and hyperglycemic excursions. A 26-week randomized trial of 322 type 1 diabetic patients showed that adults aged $25 years using intensive insulin therapy and CGM experienced a 0.5% reduction in A1C (from;7.6to7.1%)comparedwithusual intensive insulintherapy with SMBG(72). Sensor use in those ,25 years of age (children,teens,andadults)didnotresult insignificantA1Clowering,andtherewas no significant difference in hypoglycemia in any group. The greatest predictor of A1C lowering for all age-groups was frequencyofsensoruse,whichwaslower inyoungerage-groups.InasmallerRCTof 129adultsandchildrenwithbaselineA1C ,7.0%, outcomes combining A1C and hypoglycemia favored the group using CGM, suggesting that CGM is also beneficial for individuals with type 1 diabetes who have already achieved excellent control (72). Overall, meta-analyses suggest that compared with SMBG, CGM use is associated with A1C lowering by ;0.26% (73). The technology may be particularly useful in those with hypoglycemia unawareness and/or frequent hypoglycemic episodes, although studies have not shown significant reductions in severe hypoglycemia (73). A CGM device equippedwith anautomaticlow glucose suspend feature was recently approved by the U.S. Food and Drug Administration (FDA). The ASPIRE trial of 247 patients showed that sensor- augmented insulin pump therapy with a low glucose suspend significantly reduced nocturnal hypoglycemia, without increasing A1C levels for those over 16 years of age (74). These devices may offer the opportunity to reduce severe hypoglycemia for those with a history of nocturnal hypoglycemia. CGM forms the underpinning for the “artificial pancreas” or the closed-loop system. However, before CGM is widely adopted, data must be reported and analyzed using a standard universal template that is predictable and intuitive (75). b. A1C Recommendations c Perform the A1C test at least two times a year in patients who are meeting treatment goals (and who have stable glycemic control). E c Perform the A1C test quarterly in patients whose therapy has changed
- 10. care.diabetesjournals.org Position Statement S23 or who are not meeting glycemic goals. E c Use of POC testing for A1C provides the opportunity for more timely treatment changes. E A1C reflects average glycemia over several months (69) and has strong predictive value for diabetes complications (76,77). Thus, A1C testing should be performed routinely in all patients with diabetes: at initial assessment and as part of continuing care. Measurement approximately every 3 months determines whether a patient’s glycemic targets have been reached and maintained. The frequency of A1C testing should be dependent on the clinical situation, the treatment regimen used, and the clinician’s judgment. Some patients with stable glycemia well within target may do well with testing only twice per year. Unstable or highly intensively managed patients (e.g., pregnant type 1 diabetic women) may require testing more frequently than every 3 months. A1C Limitations As mentioned above, the A1C test is subject to certain limitations. Conditions that affect erythrocyte turnover (hemolysis, blood loss) and hemoglobin variants must be considered, particularly when the A1C result does not correlate with the patient’s clinical situation (69). A1C also does not provide a measure of glycemic variability or hypoglycemia. Forpatients prone to glycemic variability, especially type 1 diabetic patients or type 2 diabetic patients with severe insulin deficiency, glycemic control is best evaluated by the combination of results from self-monitoring and the A1C. The A1C may also confirm the accuracy of the patient’s meter (or the patient’s reported SMBG results) and the adequacyof the SMBGtesting schedule. A1C and Plasma Glucose Table 8 contains the correlation between A1C levels and mean plasma glucose levels based on data from the international A1C-Derived Average Glucose (ADAG) trial using frequent SMBG and CGM in 507 adults (83% non- Hispanic whites) with type 1, type 2, and no diabetes (78). The ADA and the American Association for Clinical Table 8—Correlation of A1C with average glucose Mean plasma glucose A1C (%) mg/dL mmol/L 6 126 7.0 7 154 8.6 8 183 10.2 9 212 11.8 10 240 13.4 11 269 14.9 12 298 16.5 These estimates are based on ADAG data of ;2,700 glucose measurements over 3 months per A1Cmeasurement in 507 adults with type 1, type 2, and no diabetes. The correlation between A1C and average glucose was 0.92 (ref. 78). A calculator for converting A1C results into eAG, in either mg/dL or mmol/L, is available at http:// professional.diabetes.org/eAG. Chemistry have determined that the correlation (r 5 0.92) is strongenoughto justify reporting both the A1C result and an estimated average glucose (eAG) result when a clinician orders the A1C test.Thetablein pre-2009versionsofthe Standards of Medical Care in Diabetes describing the correlation between A1C and mean glucose was derived from relativelysparse data(one7-pointprofile over 1 day per A1C reading) in the primarily non-Hispanic white type 1 diabetic participants in the DCCT(79). Clinicians should note that the numbers in the table are now different because they are based on ;2,800 readings per A1C in the ADAGtrial. In the ADAG study, there were no significant differences among racial and ethnic groups in the regression lines between A1C and mean glucose, although there was a trend toward a difference between the African/African American and non-Hispanic white cohorts. A small study comparing A1C to CGM data in type 1 diabetic children found a highly statistically significant correlationbetweenA1Candmeanblood glucose, although the correlation (r 5 0.7) was significantly lower than in the ADAGtrial (80). Whether there are significant differences in how A1Crelates to average glucose in children or in African American patients is an area for further study (33,81). For the time being, the question has not led to different recommendations about testing A1C or to different interpretations of the clinical meaning of given levels of A1C in those populations. For patients in whom A1C/eAG and measured bloodglucoseappear discrepant, clinicians should consider the possibilities of hemoglobinopathyor alteredredcellturnover,andtheoptionsof more frequent and/or different timing of SMBGoruseof CGM.Othermeasures ofchronicglycemiasuchasfructosamine are available, but their linkage to average glucose and their prognostic significance are not as clear as for A1C. 2. Glycemic Goals in Adults Recommendations c Lowering A1C to below or around 7% has been shown to reduce microvascular complications of diabetes and, if implemented soon after the diagnosis of diabetes, is associated with long-term reduction in macrovascular disease. Therefore, a reasonable A1C goal for many nonpregnant adults is ,7%. B c Providers might reasonably suggest more stringent A1C goals (such as ,6.5%) for selected individual patients, if this can be achieved without significant hypoglycemia or other adverse effects of treatment. Appropriate patients might include thosewith short duration ofdiabetes, long life expectancy, and no significant CVD. C c LessstringentA1Cgoals(suchas,8%) maybeappropriatefor patients with a historyofseverehypoglycemia,limited life expectancy, advanced microvascular or macrovascular complications,andextensivecomorbid conditions and in those with long- standingdiabetesinwhomthegeneral goalis difficult to attain despite DSME, appropriate glucose monitoring, and effective doses of multiple glucose- lowering agents including insulin. B Diabetes Control and Complications Trial/Epidemiology of Diabetes Interventions and Complications Hyperglycemia defines diabetes, and glycemic control is fundamental to diabetes management. The DCCT study (76), a prospective RCT of intensive versus standard glycemic control in patients with relatively recently diagnosed type 1 diabetes showed definitively that improved glycemic
- 11. S24 Position Statement Diabetes Care Volume 37, Supplement 1, January 2014 control is associated with significantly decreased rates of microvascular (retinopathy and nephropathy) and neuropathic complications. Follow-up of the DCCTcohorts in the Epidemiology of Diabetes Interventions and Complications (EDIC) study (82,83) demonstrated persistence of these microvascular benefits in previously intensively treated subjects, even though their glycemic control approximated that of previous standard arm subjects during follow-up. Kumamoto and UK Prospective Diabetes Study The Kumamoto (84) and UK Prospective Diabetes Study (UKPDS) (85,86) confirmed that intensive glycemic control was associated with significantly decreased rates of microvascular and neuropathic complications in type 2 diabetic patients. Long-term follow-up of the UKPDS cohorts showed enduring effects ofearlyglycemiccontrol onmost microvascular complications (87). Three landmark trials (ACCORD, ADVANCE, and VADT, described in further detail below) were designed to examine the impact of intensive A1C control on CVD outcomes and showed that lower A1C levels were associated with reduced onset or progression of microvascular complications (88–90). Epidemiological analyses of the DCCT and UKPDS (76,77) demonstrate a curvilinear relationship between A1C and microvascular complications. Such analyses suggest that, on a populationlevel, thegreatestnumberof complications will be averted by taking patients from very poor control to fair/ good control. These analyses also suggest that further lowering of A1C from 7 to 6% is associated with further reduction in the risk of microvascular complications, though the absolute risk reductions becomemuch smaller. Given the substantially increased risk of hypoglycemia in type 1 diabetes trials, and now seen in recent type 2 diabetes trials, the risks of lower glycemictargets may outweigh the potential benefits on microvascular complications on a population level. The concerning mortality findings in the ACCORD trial (91) and the relatively much greater effort required to achieve near- euglycemia should also be considered when setting glycemic targets. However, based on physician judgment andpatientpreferences, select patients, especially those with little comorbidity and long life expectancy, may benefit from adopting more intensive glycemic targets (e.g., A1C target ,6.5%) as long as significant hypoglycemia does not become a barrier. Cardiovascular Disease Outcomes CVD is a more common cause of death than microvascular complications in populations with diabetes. However, it is less clearly impacted by hyperglycemia levels or intensity of glycemic control. In theDCCT,therewas atrendtowardlower risk of CVDevents with intensive control. In the 9-year post-DCCTfollow-up of the EDIC cohort, participants previously randomized to the intensive arm had a significant 57% reduction in the risk of nonfatal myocardial infarction (MI), stroke,orCVDdeathcomparedwiththose previously in the standard arm (92). The benefitofintensiveglycemiccontrolinthis type 1 diabetic cohort has recently been shown to persist for several decades (93). In type 2 diabetes, there is evidence that more intensive treatment of glycemiain newlydiagnosedpatientsmayreducelong- term CVDrates. During the UKPDStrial, there was a 16%reduction in CVDevents (combinedfatalornonfatalMIandsudden death) in the intensive glycemiccontrol arm that did not reach statistical significance(P 5 0.052), andthere was no suggestionof benefit on other CVD outcomes (e.g., stroke). However, after 10 years of follow-up, those originally randomized to intensive glycemic control had significant long-term reductions in MI (15% with sulfonylurea or insulin as initial pharmacotherapy, 33%with metformin as initial pharmacotherapy) and in all-cause mortality(13%and27%,respectively)(87). The Action to Control CardiovascularRisk in Diabetes(ACCORD),Actionin Diabetes and Vascular Disease: Preterax and Diamicron Modified Release Controlled Evaluation (ADVANCE), and the Veterans Affairs Diabetes Trial (VADT) studies suggestednosignificantreductionin CVD outcomeswithintensiveglycemiccontrol in participants who had more advanced type 2 diabetes than UKPDS participants. All three trials were conducted in participants with more long-standing diabetes (mean duration 8–11 years) and either known CVDor multiple cardiovascular risk factors. Details of these studies are reviewed extensively in an ADA position statement (94). ACCORD The ACCORD study participants had either known CVDor two or more major cardiovascular risk factors and were randomized to intensive glycemic control (goal A1C ,6%) or standard glycemic control (goal A1C 7–8%). The glycemic control comparison was halted early due to an increased mortality rate in the intensive compared with the standard arm (1.41 vs. 1.14%/year; hazard ratio [HR] 1.22 [95% CI 1.01– 1.46]); with a similar increase in cardiovascular deaths. Initial analysis of the ACCORD data (evaluating variables includingweightgain,useofanyspecific drug or drug combination, and hypoglycemia) did not identify a clear explanation for the excess mortality in the intensive arm (91). A subsequent analysisshowed noincrease in mortality in the intensive arm participants who achieved A1C levels below 7%, nor in those who lowered their A1C quickly after trial enrollment. There was noA1C level at which intensive versus standard arm participants had significantly lower mortality. The highest risk for mortality was observed in intensive arm participants with the highest A1C levels (95). Severe hypoglycemia was significantly more likely in participants randomized to the intensive glycemic control arm. Unlike the DCCT, where lower achieved A1C levels were related to significantly increased rates of severe hypoglycemia, in ACCORD every 1% decline in A1C from baseline to 4 months into the trial was associated with a significant decrease in the rate of severe hypoglycemia in both arms (95). ADVANCE Theprimary outcomeofADVANCEwasa combination of microvascular events (nephropathy and retinopathy) and major adverse cardiovascular events (MI, stroke, and cardiovascular death). Intensive glycemic control (A1C ,6.5%, vs. treatment to local standards) significantly reduced the primary end point, primarily due to a significant reduction in the microvascular outcome, specifically development of albuminuria (.300 mg/24 h), with
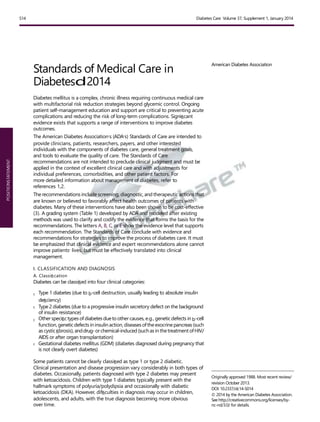
- 12. care.diabetesjournals.org Position Statement S25 no significant reduction in the macrovascular outcome. There was no difference in overall or cardiovascular mortality between the two arms (89). VADT The primary outcome of the VADTwas a composite of CVD events. The trial randomized type 2 diabetic participants who were uncontrolled on insulin or on maximal dose oral agents (median entry A1C 9.4%) to a strategy of intensive glycemic control (goal A1C ,6.0%) or standard glycemic control, with a planned A1Cseparation of at least 1.5%. The cumulative primary outcome was nonsignificantly lower in the intensive arm (88). An ancillary study of the VADT demonstrated that intensive glycemic control significantly reduced the primary CVD outcome in individuals with less atherosclerosis at baseline but not in persons with more extensive baseline atherosclerosis (96). Apost hoc analysis showed that mortality in the intensive versus standard glycemic control arm was related to duration of diabetes at study enrollment. Those with diabetes duration less than 15 years had a mortality benefit in the intensive arm, whilethosewith duration of 20years or morehadhighermortality in the intensive arm (97). The evidence for a cardiovascular benefit of intensive glycemic control primarily rests on long-term follow-up of study cohorts treated early in the course of type 1 and type 2 diabetes, and a subset analyses of ACCORD, ADVANCE, and VADT. A group-level meta-analysis of the latter three trials suggests that glucose lowering has a modest (9%) but statistically significant reduction in major CVD outcomes, primarily nonfatal MI, with no significant effect onmortality. However, heterogeneity of the mortality effects across studies was noted.Aprespecified subgroup analysis suggested that major CVD outcome reduction occurred in patients without known CVDat baseline (HR 0.84 [95% CI 0.74–0.94]) (98). Conversely, the mortality findings in advancedatherosclerosis,andadvanced age/frailty may benefit from less aggressive targets. Providers should be vigilant in preventing severe hypoglycemia in patients with advanced disease and should not aggressively attempt to achieve near-normal A1C levels in patients in whom such targets cannot be safely and reasonably achieved. Severe or frequent hypoglycemia is an absolute indication for the modification of treatment regimens, including setting higher glycemic goals. Many factors, including patient preferences, shouldbetaken into account when developing a patient’s individualized goals (99) (Fig. 1). Glycemic Goals Recommended glycemic goals for many nonpregnant adults are shown in Table 9. The recommendations are based on those for A1C values, with blood glucose levels that appear to correlate with achievement of an A1Cof ,7%. The issue of pre- versus postprandial SMBG targets is complex (100). Elevated postchallenge (2-h OGTT) glucose values have been associated with increased cardiovascular risk independent of FPG in some epidemiological studies. In diabetic subjects, surrogate measures of vascular pathology, such as endothelial dysfunction, are negatively affected by postprandial hyperglycemia (101). It is clear that postprandial hyperglycemia, like preprandial hyperglycemia, contributes to elevated A1C levels, with its relative contribution being greater at A1Clevelsthatarecloserto7%.However, outcome studies have clearly shown A1C to be the primary predictor of complications, and landmark glycemic controltrialssuchastheDCCTandUKPDS relied overwhelmingly on preprandial SMBG. Additionally, an RCT in patients with knownCVDfoundnoCVDbenefit of insulin regimens targeting postprandial glucose compared with those targeting preprandial glucose (102). A reasonable recommendationfor postprandialtesting and targets is that for individuals who have premeal glucose values within target but have A1C values above target, monitoring postprandial plasma glucose(PPG)1–2hafterthestart ofthe meal and treatment aimed at reducing ACCORD and subgroup analyses of the VADT suggest that the potential risks of intensive glycemic control may outweigh its benefits in some patients. Those with long duration of diabetes, known history of severe hypoglycemia, Figure 1—Approach to management of hyperglycemia. Depiction of the elements of decision making used to determine appropriate efforts to achieve glycemic targets. Characteristics/ predicaments toward the left justify more stringent efforts to lower A1C, whereas thosetoward the right are compatible with less stringent efforts. Where possible, such decisions should be made in conjunction with the patient, reflecting his or her preferences, needs, and values. This “scale” is not designed to be applied rigidly but to be used as a broad construct to help guide clinical decisions. Adapted with permission from Ismail-Beigi et al. (99).
- 13. S26 Position Statement Diabetes Care Volume 37, Supplement 1, January 2014 Table 9—Summary of glycemic recommendations for many nonpregnant adults with diabetes A1C ,7.0%* Preprandial capillary plasma glucose 70–130 mg/dL* (3.9–7.2 mmol/L) Peak postprandial capillary plasma glucose† ,180 mg/dL* (,10.0 mmol/L) c *Goals should be individualized based on: c duration of diabetes c age/life expectancy c comorbid conditions c known CVD or advanced microvascular complications c hypoglycemia unawareness c individual patient considerations c More or less stringent glycemic goals may be appropriate for individual patients c Postprandial glucose may be targeted if A1C goals are not met despite reaching preprandial glucose goals †Postprandial glucose measurements should be made 1–2 h after the beginning of the meal, generally peak levels in patients with diabetes. 1. Use MDI injections (3–4 injections per day of basal and prandial insulin) or CSII therapy. 2. Match prandial insulin to carbohydrate intake, premeal blood glucose, and anticipated activity. 3. For most patients (especially with hypoglycemia), use insulin analogs. 4. For patients with frequent nocturnal hypoglycemia and/or hypoglycemia unawareness, use of sensor-augmented low glucose suspend threshold pump may be considered. There are excellent reviews to guide the initiation and management of insulin therapy to achieve desired PPG values to ,180 mg/dL may help lower A1C. Glycemic goalsfor children are provided in Section VIII.A.1.a. Glycemic Goals in Pregnant Women The goals for glycemic control for women with GDM are based on recommendations from the Fifth International Workshop-Conference on Gestational Diabetes Mellitus (103) and have the following targets for maternal capillary glucose concentrations: c Preprandial: #95 mg/dL (5.3 mmol/L), and either: c 1-h postmeal: #140 mg/dL (7.8 mmol/L) or c 2-h postmeal: #120 mg/dL (6.7 mmol/L) For women with preexisting type 1 or type 2 diabetes who become pregnant, the following are recommended as optimal glycemic goals, if they can be achieved without excessive hypoglycemia (104): c Premeal, bedtime, and overnight glucose60–99 mg/dL(3.3–5.4 mmol/L) c Peak postprandial glucose 100–129 mg/dL (5.4–7.1 mmol/L) c A1C ,6.0% D. Pharmacological and Overall Approaches to Treatment 1. Insulin Therapy for Type 1 Diabetes c Most people with type 1 diabetes should be treated with MDI injections (threetofourinjectionsperdayofbasal and prandial insulin) or continuous subcutaneous insulin infusion (CSII). A c Most people with type 1 diabetes should be educated in how to match prandial insulin dose to carbohydrate intake, premeal blood glucose, and anticipated activity. E c Most people with type 1 diabetes should use insulin analogs to reduce hypoglycemia risk. A Screening c Consider screening those with type 1 diabetes for other autoimmune diseases (thyroid, vitamin B12 deficiency, celiac) as appropriate. B The DCCT clearly showed that intensive insulin therapy(three ormoreinjections per day of insulin, or CSII (or insulin pump therapy) was a key part of improved glycemia and better outcomes(76,92). Thestudywascarried out with short- and intermediate-acting human insulins. Despite better microvascular outcomes, intensive insulin therapy was associated with a high rate of severe hypoglycemia (62 episodes per 100 patient-years of therapy). Since the DCCT, a number of rapid-acting and long-acting insulin analogs have been developed. These analogs are associated with less hypoglycemia with equal A1C lowering in type 1 diabetes (105,106). Recommended therapy for type 1 diabetes consists of the following components: glycemic goals (105,107,108). Although most studies of MDI versus pump therapy have been small and of short duration, a systematic review and meta-analysis concluded that there were no systematic differences in A1C or severe hypoglycemia rates in children and adults between the two forms of intensive insulin therapy (73). Recently, a large randomized trial in type 1 diabetic patients with nocturnal hypoglycemia reported that sensor- augmented insulin pump therapy with the threshold-suspend feature reduced nocturnal hypoglycemia, without increasing glycated hemoglobin values (74). Overall, intensive management through pumptherapy/CGM andactive patient/family participation should be strongly encouraged (109–111). For selected individuals who have mastered carbohydrate counting, education on the impact of protein and fat on glycemic excursions can be incorporated into diabetes management (112). Screening Because of the increased frequency of other autoimmune diseases in type 1 diabetes, screening for thyroid dysfunction, vitamin B12 deficiency, and celiac disease should be considered based on signs and symptoms. Periodic screening in asymptomatic individuals has been recommended, but the effectiveness and optimal frequency are unclear.
- 14. care.diabetesjournals.org Position Statement S27 Figure2—Antihyperglycemictherapyintype2diabetes:generalrecommendations.DPP-4-i,DPP-4inhibitor;Fx’s,bonefractures;GI,gastrointestinal;GLP-1- RA, GLP-1receptor agonist; HF, heart failure; SU, sulfonylurea; TZD, thiazolidinedione. For further details, see ref. 113. Adapted with permission. 2. Pharmacological Therapy for Hyperglycemia in Type 2 Diabetes Recommendations c Metformin, if not contraindicated and if tolerated, is the preferred initial pharmacological agent for type 2 diabetes. A c In newly diagnosed type 2 diabetic patients with markedly symptomatic and/or elevated blood glucose levels or A1C, consider insulin therapy, with or without additional agents, from the outset. E c If noninsulin monotherapy at maximum tolerated dose does not achieve or maintain the A1C target over 3 months, add a second oral agent, aglucagon-likepeptide1(GLP- 1) receptor agonist, or insulin. A c A patient-centered approach should be used to guide choice of pharmacological agents. Considerations include efficacy, cost, potential side effects, effects on weight, comorbidities, hypoglycemia risk, and patient preferences. E c Due to the progressive nature of type 2 diabetes, insulin therapy is eventually indicated for many patients with type 2 diabetes. B TheADAandtheEuropeanAssociationfor the Study of Diabetes (EASD) formed a joint task force to evaluate the data and develop recommendations for the use of antihyperglycemic agents in type 2 diabetic patients (113). This 2012 position statement is less prescriptive than prior algorithms and discusses advantages and disadvantages of the available medication classes and considerations for their use. A patient-centered approach is stressed, including patient preferences, cost and potential side effects of each class, effects on bodyweight, and hypoglycemia risk. The position statement reaffirms metformin as the preferred initial agent, barring contraindication or intolerance, either in addition to lifestyle counseling and support for weight loss and exercise, or when lifestyle efforts alone have not achieved or maintained glycemicgoals. Metformin has a long-standing evidence baseforefficacyandsafety,isinexpensive, and may reduce risk of cardiovascular events (87). When metformin fails to achieve or maintain glycemic goals, another agent should be added.Although there are numerous trials comparing dual therapy to metformin alone, few directly compare drugs as add-on therapy. Comparative effectiveness meta-analyses (114) suggest that overall, each new class of noninsulin agents added to initial therapy lowers A1C around 0.9–1.1%.
- 15. S28 Position Statement Diabetes Care Volume 37, Supplement 1, January 2014 Many patients with type 2 diabetes eventually require and benefit from insulin therapy. The progressive nature of type 2 diabetes and its therapies should be regularly and objectively explained to patients. Providers should avoid using insulin as a threat or describing it as a failure or punishment. Equippingpatientswith analgorithmfor self-titration of insulin doses based on SMBGresults improves glycemiccontrol in type 2 diabetic patients initiating insulin (115). Refer to the ADA-EASD position statement for more details on pharmacotherapy for hyperglycemia in type 2 diabetes (113) (Fig. 2). E. Medical Nutrition Therapy General Recommendations c Nutrition therapy is recommended for all people with type 1 and type 2 diabetes as an effective component of the overall treatment plan. A c Individuals who have prediabetes or diabetes should receive individualized MNT as needed to achieve treatment goals, preferably provided by a registered dietitian familiar with the components of diabetes MNT. A c Because diabetes nutrition therapy can result in cost savings B and improved outcomes such as reduction in A1C A, nutrition therapy should be adequately reimbursed by insurance and other payers. E Energy Balance, Overweight, and Obesity c For overweight or obese adults with type 2 diabetes orat risk for diabetes, reducing energy intake while maintaining a healthful eating pattern is recommended to promote weight loss. A c Modest weight loss may provide clinical benefits (improved glycemia, bloodpressure,and/orlipids) in some individuals with diabetes, especially those early in the disease process. To achieve modest weight loss, intensive lifestyle interventions (counseling about nutrition therapy, physical activity, and behavior change) with ongoing support are recommended. A Eating Patterns and Macronutrient Distribution c Evidencesuggests that there is not an ideal percentage of calories from carbohydrate, protein, and fat for all people with diabetes B; therefore, macronutrient distribution should be based on individualized assessment of current eating patterns, preferences, and metabolic goals. E c A variety of eating patterns (combinations of different foods or food groups) are acceptable for the management of diabetes. Personal preference (e.g., tradition, culture, religion, health beliefs and goals, economics) and metabolic goals should be considered when recommending one eating pattern over another. E Carbohydrate Amount and Quality c Monitoring carbohydrate intake, whether by carbohydrate counting or experience-based estimation, remains a key strategy in achieving glycemic control. B c For good health, carbohydrate intake from vegetables, fruits, whole grains, legumes, and dairy products should be advised over intake from other carbohydrate sources, especially those that contain added fats, sugars, or sodium. B c Substituting low-glycemic load foods for higher-glycemicload foods may modestly improve glycemic control. C c Peoplewith diabetesshouldconsume at leasttheamountoffiberandwhole grains recommended for the general public. C c While substituting sucrose- containing foods for isocaloric amounts of other carbohydrates may have similar blood glucose effects, consumption should be minimized to avoid displacing nutrient-dense food choices. A c Peoplewith diabetesandthoseat risk for diabetes should limit or avoid intake of sugar-sweetened beverages (from any caloricsweetener including high-fructosecorn syrupandsucrose) to reduce risk for weight gain and worsening of cardiometabolic risk profile. B Dietary Fat Quantity and Quality c Evidence is inconclusive for an ideal amount of total fat intake for people with diabetes;therefore,goalsshould be individualized. C Fat quality appears to be far more important than quantity. B c In people with type 2 diabetes, a Mediterranean-style, MUFA-rich eating pattern may benefit glycemic control and CVD risk factors and can therefore be recommended as an effective alternative to a lower- fat, higher-carbohydrate eating pattern. B c As recommended for the general public, an increase in foods containing long-chain n-3 fatty acids (EPA and DHA) (from fatty fish) and n-3 linolenic acid (ALA) is recommended for individuals with diabetes because of their beneficial effects on lipoproteins, prevention of heart disease, and associations with positive health outcomes in observational studies. B c The amount of dietary saturated fat, cholesterol, and trans fat recommended for people with diabetes is the same as that recommended for the general population. C Supplements for Diabetes Management c There is no clear evidence of benefit from vitamin or mineral supplementation in people with diabetes who do not have underlying deficiencies. C c Routine supplementation with antioxidants, such as vitamins E andC andcarotene, is notadvisedbecauseof lackofevidenceofefficacyandconcern related to long-term safety. A c Evidence does not support recommending n-3 (EPA and DHA) supplements for people with diabetes for the prevention or treatment of cardiovascular events. A c There is insufficient evidence to support the routine use of micronutrients such as chromium, magnesium, and vitamin D to improve glycemic control in people with diabetes. C c There is insufficient evidence to support the use of cinnamon or other herbs/supplements for thetreatment of diabetes. C c It is reasonable for individualized mealplanningtoincludeoptimization of food choices to meet recommended daily allowance/ dietary reference intake for all micronutrients. E
- 16. care.diabetesjournals.org Position Statement S29 Alcohol c If adults with diabetes choose to drink alcohol, they should be advised to do so in moderation (one drink per day or less for adult women and two drinks per day or less for adult men). E c Alcohol consumption may place peoplewith diabetes at increased risk for delayed hypoglycemia, especially if taking insulin or insulin secretagogues. Education and awareness regarding the recognition and management of delayed hypoglycemia is warranted. C Sodium c The recommendation for the general population to reduce sodium to ,2,300 mg/day is also appropriate for people with diabetes. B c For individuals with both diabetes and hypertension, further reduction in sodium intake should be individualized. B Primary Prevention of Type 2 Diabetes c Among individuals at high risk for developing type 2 diabetes, structured programs that emphasize lifestyle changes that include moderate weight loss (7% of body weight) and regular physical activity (150 min/week), with dietary strategies including reduced calories and reduced intake of dietary fat, can reduce the risk for developing diabetes and are therefore recommended. A c Individuals at high risk for type 2 diabetes should be encouraged to achieve the U.S. Department of Agriculture (USDA) recommendation fordietary fiber(14g fiber/1,000kcal) and foods containing whole grains (one-half of grain intake). B The ADA recently released an updated position statement on nutrition therapy for adults living with diabetes (116). Nutrition therapy is an integral component of diabetes prevention, management, and self-management education. All individuals with diabetes should receive individualized MNT preferably provided by a registered dietitian who is knowledgeable and skilled in providing diabetes MNT. Comprehensive group diabetes education programs including nutrition therapy or individualized education sessions have reported A1C decreases of 0.3–1%for type 1 diabetes (117–120) and 0.5–2% for type 2 diabetes (85,121–137). Individuals with type 1 diabetes should be offered intensive insulin therapy education using the carbohydrate- counting meal planning approach (117,119,120,124,138–140); this approach has been shown to improve glycemic control (139,141). Consistent carbohydrate intake with respect to time and amount can result in improved glycemic control for individuals using fixed daily insulin doses (142,143). A simplediabetes mealplanningapproach suchas portion control orhealthful food choices may be better suited for individuals with health literacy and numeracy concerns (125–127). Weight loss of 2–8 kg may provide clinical benefits in those with type 2 diabetes, especially early in the disease process (144–146). Weight loss studies have used a variety of energy-restricted eating patterns, with no clear evidence that one eating pattern or optimal macronutrient distribution was ideal. Although several studies resulted in improvements in A1C at 1 year (144,145,147–149), not all weight loss interventions led to 1-year A1C improvements (128,150–154). Themost consistently identified changes in cardiovascular risk factors were an increase in HDL cholesterol (144,145, 147,149,153,155), decrease in triglycerides (144,145,149,155,156) and decrease in blood pressure (144,145,147,151,153,155). Intensive lifestyle programs with frequent follow-up are required to achieve significant reductions in excess body weight and improve clinical indicators (145,146). Several studies have attempted to identify the optimal mix of macronutrients for meal plans of peoplewith diabetes. However,arecent systematic review (157) found that there was no ideal macronutrient distribution and that macronutrient proportions should be individualized. Studies show that people with diabetes on average eat about 45% of their calories from carbohydrate, ;36–40% of calories from fat, and ;16–18% from protein (158–160). A variety of eating patterns have been shown to be effective in managing diabetes, including Mediterranean-style (144,146,169), Dietary Approaches to Stop Hypertension (DASH)-style (161), plant-based (vegan or vegetarian) (129), lower-fat (145), and lower-carbohydrate patterns (144,163). Studies examining the ideal amount of carbohydrate intake for people with diabetes are inconclusive, although monitoring carbohydrate intake and considering the available insulin are key strategies for improving postprandial glucose control (117,142,143,158). The literature concerning glycemic index and glycemic load in individuals with diabetes is complex, although reductions in A1C of 20.2% to 20.5% have been demonstrated in some studies. In many studies, it is often difficult to discern the independent effect of fiber compared with that of glycemic index on glycemic control and other outcomes. Improvements in CVD risk measures are mixed (164). Recent studies have shown modest effect of fiber on lowering preprandial glucose andmixed results onimproving CVDrisk factors. Asystematic review (157) found consumption of whole grains was not associatedwithimprovementsinglycemic control in people with type 2 diabetes, although it may reduce systemic inflammation. Onestudy did finda potential benefit of whole grain intake in reducing mortality and CVD(165). Limited research exists concerning the ideal amount of fat for individuals with diabetes. The Institute of Medicine has defined an acceptable macronutrient distribution range (AMDR) for all adults fortotal fat of20–35%ofenergywith no tolerable upper intake level defined. This AMDR was based on evidence for CHDriskwith alowintakeoffat andhigh intake of carbohydrate, and evidence for increased obesity and CHDwith high intake of fat (166). The type of fatty acids consumed is more important than total amount of fat when looking at metabolic goals and risk of CVD (146,167,168). Multiple RCTs including patients with type2 diabetes have reported improved
- 17. S30 Position Statement Diabetes Care Volume 37, Supplement 1, January 2014 glycemic control and/or blood lipids when a Mediterranean-style, MUFA- rich eating pattern was consumed (144,146,151,169–171). Some of these studies also included caloric restriction, which may have contributed to improvements in glycemic control or blood lipids (169,170). The ideal ratio of n-6 to n-3 fatty acids has not been determined; however, PUFA and MUFA are recommended substitutes for saturated or trans fat (167,172). A recent systematic review (157) concluded that supplementation with n-3 fatty acids did not improve glycemic control but that higher dose supplementation decreased triglycerides in individuals with type 2 diabetes. Six short-duration RCTs comparing n-3 supplements to placebo published since the systematic review reported minimal or no beneficial effects (173,174) or mixed/ inconsistent beneficial effects (175–177) on CVD risk factors and other health issues. Three longer- duration studies also reported mixed outcomes (178–180). Thus, RCTs do not support recommending n-3 supplements for primary or secondary prevention of CVD. Little evidence has been published about the relationship between dietary intake of saturated fatty acids and dietary cholesterol and glycemic control and CVDrisk in people with diabetes. Therefore, people with diabetes should follow the guidelines for the general population for the recommended intakes of saturated fat, dietary cholesterol, and trans fat (167). Published data on the effects of plant stanols and sterols on CVD risk in individuals with diabetes include four RCTs that reported beneficial effects for total, LDL, and non-HDL cholesterol (181–184). There is limited evidence that the use of vitamin, mineral, or herbal supplements is necessary in the management of diabetes (185–201). Limited studies have been published on sodium reduction in people with diabetes. A recent Cochrane review found that decreasing sodium intake reduces blood pressure in those with diabetes (202). However, two other studies in type1diabetes (203) andtype 2diabetes(204) havewarranted caution for universal sodium restriction to 1,500 mg in this population. For individuals with diabetes and hypertension, setting a sodium intake goal of ,2,300 mg/day should be considered only on an individual basis. Goal sodium intake recommendations should take into accountpalatability,availability,additional costofspecialtylowsodiumproducts,and thedifficultyofachievingbothlowsodium recommendations and a nutritionally adequate diet (205). For complete discussion and references of all recommendations,see“NutritionTherapy Recommendations for the Management of Adults With Diabetes” (116). F. Diabetes Self-Management Education and Support Recommendations c People with diabetes should receive DSME and diabetes self-management support (DSMS)accordingtoNational Standards for Diabetes Self- Management Education and Support when their diabetes is diagnosed and as needed thereafter. B c Effective self-management and qualityof life are the key outcomes of DSME and DSMS and should be measured and monitored as part of care. C c DSME and DSMS should address psychosocial issues, since emotional well-being is associated with positive diabetes outcomes. C c DSME and DSMS programs are appropriate venues for people with prediabetes to receive education and support to develop and maintain behaviors that can prevent or delay the onset of diabetes. C c Because DSME and DSMS can result in cost-savings and improved outcomes B, DSME and DSMS should be adequately reimbursed by third- party payers. E DSME and DSMS are the ongoing processes of facilitating the knowledge, skill, and ability necessary for diabetes self-care. This process incorporates the needs, goals, and life experiences of the person with diabetes. The overall objectives of DSME and DSMS are to support informed decision making, self- care behaviors, problem solving, and activecollaboration with thehealth care team to improve clinical outcomes, health status, and quality of life in a cost-effective manner (206). DSME and DSMS are essential elements ofdiabetescare(207–209),andthecurrent National Standards for Diabetes Self- ManagementEducationandSupport(206) are based on evidence for their benefits. Education helps people with diabetes initiate effective self-managementand cope with diabetes when they are first diagnosed. OngoingDSMEand DSMSalso help people with diabetes maintain effective self-management throughout a lifetime of diabetes as they face new challenges and treatment advances become available. DSMEenables patients (including youth) to optimizemetabolic control, prevent and manage complications,andmaximizequalityoflife, in a cost-effective manner (208,210). Current best practice of DSME is a skills- based approach that focuses on helping those with diabetesmakeinformed self- management choices (206,208). DSME has changed from a didactic approach focusing on providing information to more theoretically based empowerment models that focus on helping those with diabetes make informed self-management decisions (208). Diabetes care has shifted to an approach that is more patient centered and places the person with diabetes and his orherfamily at the center of the care model working in collaboration with health care professionals. Patient- centered care is respectful of and responsive to individual patient preferences, needs, and values and ensures that patient values guide all decision making (211). Evidence for the Benefits of Diabetes Self-Management Education and Support Multiple studies have found that DSME is associated with improved diabetes knowledge and improved self-care behavior (206,207), improved clinical outcomes such as lower A1C (209,212– 216), lower self-reported weight (207), improved quality of life (213,216,217), healthy coping (218,219), and lower costs (220,221). Better outcomes were reported for DSME interventions that were longer and included follow-up support (DSMS) (207,222–224), that
- 18. care.diabetesjournals.org Position Statement S31 were culturally (225,226) and age appropriate (227,228) andwere tailored to individual needs and preferences, and that addressed psychosocial issues and incorporated behavioral strategies (207,208,218,219,229–231). Both individual and group approaches have been found effective (232,233). There is growing evidence for the role of a community health workers (234) and peer (235–239) and lay leaders (240) in delivering DSME and DSMS as part of the DSME/S team (241). Diabetes education is associated with increased use of primary and preventive services (220,242,243) and lower use of acute, inpatient hospital services (220). Patients who participate in diabetes education are more likely to follow best practice treatment recommendations, particularly among the Medicare population,andhavelowerMedicareand commercial claim costs (221,242). The National Standards for Diabetes Self-Management Education and Support The National Standards for Diabetes Self-ManagementEducationandSupport are designed to define quality DSME and DSMS and to assist diabetes educators in a variety of settings to provide evidence-based education and self- management support (206). The standards are reviewed and updated every 5 years byataskforcerepresenting key organizations involved in the field of diabetes education and care. Diabetes Self-Management Education and Support Providers and People With Prediabetes The standards for DSME and DSMS also apply to the education and support of peoplewithprediabetes. Currently,there are significant barriers to the provision of education and support to those with prediabetes. However, the strategies for supporting successful behavior change andthe healthy behaviors recommended for people with prediabetes are largely identicaltothoseforpeoplewithdiabetes. As barriers to care are overcome, providers of DSME and DSMS,given their training and experience, are particularly well equipped to assist people with prediabetesindevelopingandmaintaining behaviors that can prevent or delay the onset of diabetes (206,244,245). Reimbursement for Diabetes Self- Management Education and Support DSME,whenprovidedbyaprogramthat meets national standards for DSME and is recognized by ADA or other approval bodies, is reimbursed as part of the Medicare program as overseen by the Centers for Medicare and Medicaid Services (CMS). DSME is also covered by most health insurance plans. Although DSMS has been shown to be instrumental for improving outcomes, as described in “Evidence for the Benefits of Diabetes Self-Management Education and Support,” and can be provided in formats such as phone calls and via telehealth, it currently has limited reimbursement as face-to-face visits included as follow-up to DSME. G. Physical Activity Recommendations c As is the case for all children, children with diabetes or prediabetes should be encouraged to engage in at least 60 min of physical activity each day. B c Adultswithdiabetesshouldbeadvised to perform at least 150 min/week of moderate-intensity aerobic physical activity (50–70% of maximum heart rate), spreadoverat least 3 days/week with no more than 2 consecutive days without exercise. A c In the absence of contraindications, adults with type 2 diabetes should be encouraged to perform resistance training at least twice per week. A Exercise is an important part of the diabetes management plan. Regular exercise has been shown to improve blood glucose control, reduce cardiovascularrisk factors, contributeto weight loss, and improve well-being. Furthermore, regular exercise may prevent type 2 diabetes in high-risk individuals (23–25). Structured exercise interventions of at least 8 weeks’ duration have been shown to lower A1C by an average of 0.66% in people with type 2 diabetes, even with nosignificant change in BMI (246). There are considerable data for the health benefits (e.g., increased cardiovascular fitness, muscle strength, improved insulin sensitivity, etc.) of regular physical activity for those with type 1 diabetes (247). Higher levels of exercise intensity are associated with greater improvements in A1C and in fitness (248). Other benefits include slowing the decline in mobility among overweight patients with diabetes (249). Ajoint position statement of ADA and the American College of Sports Medicine summarizes the evidence for the benefits of exercise in people with type 2 diabetes (250). Frequency and Type of Exercise The U.S. Department of Health and Human Services’ Physical Activity Guidelines for Americans (251) suggest that adults over age 18 years do 150 min/week of moderate-intensity, or 75 min/week of vigorous aerobic physical activity, oranequivalentcombinationof the two. In addition, the guidelines suggest that adults also do muscle- strengthening activities that involve all major muscle groups 2 or more days/ week. The guidelinessuggestthat adults over age 65 years, or those with disabilities, follow theadult guidelines if possible or (if this is not possible) be as physically active as they are able. Studies included in the meta-analysis of effects of exercise interventions on glycemiccontrol (246) hadameanof3.4 sessions/week, with a mean of 49 min/ session. The DPP lifestyle intervention, which included 150 min/week of moderate-intensity exercise, had a beneficial effect on glycemia in those with prediabetes. Therefore, it seems reasonable to recommend that people with diabetes follow the physical activity guidelines for the general population. Progressive resistance exercise improves insulin sensitivity in oldermen with type 2 diabetes to the same or even a greater extent as aerobic exercise (252). Clinical trials have provided strong evidence for the A1C lowering value of resistance training in older adults with type 2 diabetes (253,254), and for an additive benefit of combined aerobic and resistance exercise in adults with type 2 diabetes (255,256). In the absence of contraindications, patients with type 2 diabetes should be encouraged to do at least two weekly sessions of resistance exercise (exercise with free weights or weight machines), with each session consisting of at least one set of five or