Recommended

Recommended
More Related Content
Recently uploaded
Recently uploaded (20)
Featured
Featured (20)
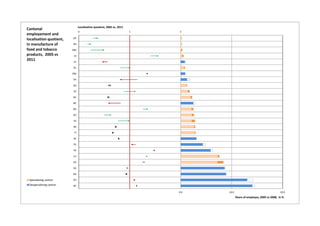
Localisation quotient, Switzerland economy, structure
- 1. 0 1 2 3 4 -20.0 -10.0 0.0 10.0 20.0 BE ZH AG SG VD LU FR TG BL TI BS VS SO GR NE GE SZ ZG SH OW GL JU AI NW AR UR Localisation quotient, 2005 vs. 2011 Share of employes, 2005 vs 2008, in % Specialising canton Despecialising canton Cantonal employement and localisation quotient, in manufacture of food and tobacco products, 2005 vs 2011