Cision Social Journalism-Studie 2013/14 - Ergebnisse für die USA
•
0 likes•1,221 views

Cision Social Journalism-Studie 2013/14 - Ergebnisse für die USA

Recommended
Recommended
More Related Content
What's hot
What's hot (20)
Similar to Cision Social Journalism-Studie 2013/14 - Ergebnisse für die USA
Similar to Cision Social Journalism-Studie 2013/14 - Ergebnisse für die USA (20)
More from REHKOPF & REHKOPF LTD.
More from REHKOPF & REHKOPF LTD. (12)
Recently uploaded
Recently uploaded (20)
Cision Social Journalism-Studie 2013/14 - Ergebnisse für die USA
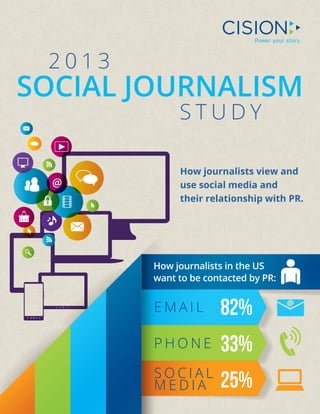
- 1. 2013 SOCIAL JOURNALISM STUDY How journalists view and u se social media and their relationship with PR. How journalists in the US want to be contacted by PR: EMAIL 82% PHONE 33% SOCIAL MEDIA 25%
- 2. 2013 SOCIAL JOURNALISM STUDY A. EXECUTIVE SUMMARY A. EXECUTIVE SUMMARY KEY FINDINGS: || Journalists indicated that PR professionals are their second most popular information source when sourcing a story, and that email dominates the communication channel but they would like to see more contact through social media. || Canadian journalists rank highest in our Social Journalism Barometer 2013; they use social media the most across their professional practices and their knowledge is the highest although their attitudes are more negative. || Finnish journalists ranked the highest in their attitudes toward using social media, although their scores for use, knowledge and practice are very low suggesting potential for growth in the future. || Building on the 2012 study, this year the analysis found the same groups of professional social media users, which are present in all countries and share very similar behaviors within each groups. These are, from the most to the least active; »» Architects are the movers and shakers of the professional social media world; »» Promoters are keen social media users focusing mainly on promoting themselves and advocating their work; »» Hunters are medium-level users who are keen networkers and use social media for sourcing information as well as finding contacts; »» Observers are the largest group and tend to be lighter users who use social media to source and publish, and are particularly keen on networking; »» Skeptics are the lowest users, although they still engage with social media. They have low knowledge and generally negative attitudes towards social media. || In 2013, Observers were the largest group of journalists (30%), followed by Architects (25%). The most surprising of all is that Skeptics have seen a significant decline since 2012 from 31% to 9%, suggesting journalists are becoming much more involved with social media with only a small persistent core of non-users remaining. || Breakdown of profile groups vary from country to country: the highest percentage of Architects are in the US; Promoters are largest in the UK and Australia; Observers high in Finland, Sweden and Australia; and Skeptics large in Finland and Germany. Hunters are similar across most countries except Finland and Germany where they are very small. © 2013–2014 Cision p. 1
- 3. 2013 SOCIAL JOURNALISM STUDY A. EXECUTIVE SUMMARY SURVEY BACKGROUND The 3rd annual Social Journalism Study, conducted by Cision and Canterbury Christ Church University, is charting the changes of how journalists and media professionals use social media for work and in their communication with PR professionals. Not surprisingly, one year on, respondents show an increasing use of social media and are moving up the Social Media Continuum. Unique to our research for the second year running is the identification of ‘The Social Suspects’, a typology which groups journalists into five categories: Architects, Hunters, Observers, Promoters and Skeptics. These distinctive groups share certain behaviors and attitudes towards social media and PR sources and professionals. In this report, we look at how these groups have changed over the year and give a more detailed look at the role of social media in the PR–journalist relationship. In addition, the report shows the findings on the Social Journalism Barometer, where countries are measured against each other in how they embed social media in their professional work. This year’s online study was compiled from over 3,000 journalists’ responses from 11 different countries: US, Canada, Australia, France, Germany, UK, Finland, Sweden, Italy, Spain and the Netherlands. SOCIAL JOURNALISM BAROMETER 2013 The Social Journalism Barometer ranks countries in relation to four dimensions: social media involvement, practice, knowledge and attitudes.1 Each country is measured against each of these four dimensions and then a combined ranking is achieved by taking an average rank score in each of the dimensions.2 1 2 Final Sums: Where applicable, not all numbers (percentages/totals/etc.) equate to 100% due to rounding. The four dimensions are calculated from values in nine indicators together measuring a total of 47 variables. The nine indicators are: yy Social Media Involvement: Daily Work Use (1); Number of Followers/Friends (2) yy Social Media Practice: Professional Social Media Activities (3); Social Media Types Used (4); Purposes of Professional Social Media Use (5) yy Social Media Knowledge: Perceived Knowledge (6) yy Social Media Attitudes: Views About Impacts on their Own Work (7); Views about Impacts on the Profession (8); Perceptions about Barriers (9) © 2013–2014 Cision p. 2
- 4. 2013 SOCIAL JOURNALISM STUDY 1. INVOLVEMENT 1. INVOLVEMENT Differences between the countries in terms of extent of social media use are now less significant than 12 months ago, although journalists in North America remain the highest users and Germany the lowest. The majority of journalists use social media up to four hours a day, however each country has a minority group that does not use social media for work on a daily basis. The largest of this non-user group is in Germany, where 13% of respondents said that they do not use social media daily, and interestingly 10% of US journalists also categorized themselves as non-users. However, the US also had the highest percentage (17%) of those who use social media for more than four hours a day. Figure 1—Differences in Social Media Use for Work (hours per day per country) US Canada Netherlands Sweden UK Australia Finland France Germany 0% 10% 20% 30% 40% 50% 60% 70% 80% 90% 100% None © 2013–2014 Cision Up to 2 Hours 2–4 Hours 4–6 Hours 6–8 Hours More than 8 Hours p. 3
- 5. 2013 SOCIAL JOURNALISM STUDY 1. INVOLVEMENT In terms of number of followers, significant differences remain between the countries. The UK and the Netherlands had the highest number of journalists with more than 500 followers on their preferred social media site (62% and 59% respectively), while Germany and Finland the lowest (33% and 29% respectively). These two countries also had the highest figures for journalists with ‘no followers’. For example, in Germany approximately three out of 10 journalists reported that they had no followers, and in Finland two out of 10. The UK had the lowest figure for those with ‘no followers’, a mere 6%. Figure 2—Number of Followers/Friends on Respondents’ Preferred Social Media Site UK Netherlands Canada US Australia France Sweden Finland Germany 0% 10% 20% 30% 40% 50% 60% 70% 80% 90% 100% None © 2013–2014 Cision Up to 100 101–500 More than 500 p. 4
- 6. 2013 SOCIAL JOURNALISM STUDY 1. INVOLVEMENT Ranking did change in terms of number of followers on preferred social media sites during the last 12 months. Last year American journalists had the most followers on average, while the figure for this year was highest for the UK. The reason for this (Figure 3) is that while the number of followers plateaued in North America, there was a significant increase in the UK, from 48% to 62%, who claimed they had more than 500+ followers on their preferred social media site. This figure also increased in Germany by 12%, Finland 11% and Sweden 9%. Figure 3—Percentages of Journalists with More than 500 Followers on Preferred Social Media Site (in percent) 51 50 Canada 53 51 US 62 48 UK 38 38 Australia 37 28 Sweden 32 30 France 29 18 Finland 33 21 Germany 0% 10% 20% 30% 40% 50% 60% 70% 2013 © 2013–2014 Cision 2012 p. 5
- 7. 2013 SOCIAL JOURNALISM STUDY 2. PRACTICE 2. PRACTICE The Social Journalism Barometer ranked countries in terms of professional social media activities, diversity of social media types used and purposes of professional social media use, and combined them to give a ‘practice’ score. Professional social media activities were compared on the basis of frequency averages of 20 specific activities, four of which are illustrated in Table 1. Like last year, Canadian journalists were the most active users in relation to this indicator, with more than half of them posting original comments on a social networking or microblogging site daily. Three out of 10 use social media daily to meet new people in their field of work; almost a quarter of them maintain a work-related blog daily; and more than a third of them reply to comments they receive on social media sites on a daily basis. And just like last year, journalists in Finland have the most inactive users in relation to this indicator: 6% of them maintain a work-related blog daily; 8% of them use social media to meet new people on a daily basis and a relatively low 12% reply daily to comments they receive on a social media site about their work. Table 1—Daily Use of Selected Social Media Activities (percent of respondents) Country Post original comment on social networking or microblogging site daily Use social media to meet new people in their field of work daily Maintain a work-related blog daily Reply to comments they receive in relation to their work on social media sites daily Canada 55 30 22 37 UK 58 26 13 34 Netherlands 51 24 18 40 France 37 14 14 22 US 45 21 21 34 Australia 43 21 9 29 Sweden 36 19 9 21 Germany 25 15 8 22 Finland 21 8 6 12 © 2013–2014 Cision p. 6
- 8. 2013 SOCIAL JOURNALISM STUDY 2. PRACTICE Professional social media activities for networking purposes have become more important in all countries during the last twelve months. For instance, 9% more Canadian, 10% more UK and 11% more Swedish journalists use social media daily to meet new people in their field of work compared to last year. The use of other types of professional activities varied. For example, the percentage of journalists posting original comments daily on a social networking or microblogging site increased in the UK from 47% to 58% and from 26% to 36% in Sweden, while the figures slightly declined in the US (from 47% to 45%). Figure 4—Number of Social Media Types Used for Work in a Typical Week (percent of respondents using 0–1, 2–3, 4–5 and 6–7 types of social media) Canada UK Australia Sweden US France Netherlands Finland Germany 0% 10% 20% 30% 40% 50% 60% 70% 80% 90% 100% 0–1 2–3 4–5 6–7 The survey distinguished seven main categories of social media tools: blogs, content communities and crowdsourcing sites, microblogs, professional social networks, social networks, audio-visual sites and social readers and bookmarking sites. Respondents were asked how many of these types they used for work. In every country, the largest category of respondents was of those who used 4–5 types of social media tools in a typical week for work. Apart from France where the figure was higher, approximately four out of 10 journalists belonged to this category. However, there were differences in relation to the other categories (Figure 4). The percentage of journalists using zero or one type of tool for work in a typical week was lowest in Canada (6%) and the UK (6%), © 2013–2014 Cision p. 7
- 9. 2013 SOCIAL JOURNALISM STUDY 2. PRACTICE while the highest was in Germany (19%) and Finland (10%). Conversely, the ratio of those who used 6–7 types were highest in Canada (39%), Australia (37%) and the UK (35%) and lowest in Germany (22%) and Finland (22%). This suggests that journalists in the most active countries use a greater variety of social media types. Unlike other indicators, the variety of social media types used has actually declined or stagnated in the surveyed countries in the last 12 months (Figure 5). This indicates a degree of saturation in a variety of social media use as well as maturation and segmentation among social media service providers. The ratio of journalists who used the highest number of tools declined the most in France (17% drop), US (14% drop) and Canada (9%). The figures rose slightly in the UK (2% increase) and Australia (1% increase), but even here the numbers suggest stagnation rather than expansion. The category which saw an increase in all countries was those who use 4–5 different social media forms regularly, suggesting that journalists have reached an optimum number of tools used for professional tasks. Figure 5—Percentages of Journalists Using 6–7 Types of Social Media for Work in a Typical Week (in percent) Canada 39 48 US 34 48 22 39 France 37 36 Australia 35 33 UK 30 30 Sweden 22 27 Germany 22 22 Finland 0% 10% 20% 30% 40% 50% 2013 © 2013–2014 Cision 2012 p. 8
- 10. 2013 SOCIAL JOURNALISM STUDY 2. PRACTICE When comparing all the countries together, it is apparent that the most popular social media types are social networking sites (82%), microblogs (80%), content communities and crowdsourcing sites (79%) and blogs (78%), while the least popular are social reader and bookmarking (39%). However, popularity of specific tools varied between the countries (Table 2). The highest variances were reported in relation to microblogs, such as Twitter, and professional social networking sites, such as LinkedIn, the use of which also varied the most in the 2012 Social Journalism survey. The use of microblogs was highest in the UK (92%), France (91%) and Canada (89%), while lowest in Germany (59%) and Finland (61%). The UK also topped the list in relation to use of professional social networking sites (83%) followed by Canada (78%) and the US (77%), while Finland (56%) and Germany (62%) reported the lowest levels of use, although still in the majority of users. Social readers and bookmarking tools were the least popular social media form in all countries, but levels of their use varied with Canada reporting highest rates (56%) and Finland the lowest (30%). Use of the other six social media tools was high in most countries where at least three quarters of journalists used all six tools for work in a typical week, with the exception of Germany and Finland. Table 2—Work-Related Use of Specific Social Media Type in a Typical Week (percent of respondents) Country Blogs Content communities/ crowdsourcing sites Canada 84% 82% 89% 78% 88% 80% 56% UK 82% 81% 92% 83% 82% 74% 39% Netherlands 81% 78% 88% 75% 82% 75% 39% France 80% 72% 91% 72% 85% 78% 33% US 79% 72% 79% 77% 84% 70% 46% Australia 74% 86% 85% 76% 83% 81% 33% Sweden 81% 85% 77% 65% 87% 71% 40% Germany 65% 75% 59% 62% 71% 63% 31% Finland 79% 83% 61% 56% 80% 68% 30% © 2013–2014 Cision Microbogs Proff. social networking sites Social networking sites Audiovisual sharing sites Social reader and bookmarking tools p. 9
- 11. 2013 SOCIAL JOURNALISM STUDY 2. PRACTICE In general, the use of social reader and bookmarking tools, microblogs and professional social networks have increased over the last 12 months, while the use of other tools have largely stayed the same. The use of social reader and bookmarking tools increased the most, by almost 20% on average with the largest increase in Canada (22%) and Finland (22%) (Figure 6). The use of microblogs also increased in all countries, although levels varied between the countries (Figure 8). The largest increases were reported in the UK (13%), Finland (14%), Australia (16%) and France (29%), while and lowest in the US (2%) and Canada (9%).The use of professional social networks have increased the most in Sweden (18%) and Finland (13%). Figure 6—Percentages of Journalists Using Microblogs, such as Twitter, for Work in a Typical Week (in percent) 79 77 US 92 79 UK 77 64 Sweden 59 46 Germany 91 62 France 61 47 Finland 89 80 Canada 85 69 Australia 0% 10% 20% 30% 40% 50% 60% 70% 80% 90% 100% 2013 © 2013–2014 Cision 2012 p. 10
- 12. 2013 SOCIAL JOURNALISM STUDY 2. PRACTICE Respondents were also asked about their reasons for using social media for work. Findings show that social media tools are used for a variety of professional tasks. Indeed the majority of journalists in the surveyed countries use the tools for most aspects of their work, indicating that social media are embedded in working practices. Overall, social media is most often used for sourcing information (86%) followed by publishing and promoting content (82%) and networking (78%). The least popular task for using social media was verifying (69%), but even this remains relatively high in the journalist’s social media toolkit. However, patterns of use varied between the countries (Figure 9). Levels were most similar in relation to using social media for sourcing, in all countries at least eight out of ten journalists reported using these tools for this reason. Countries varied the most in relation to using social media for networking. UK (87%) and Canadian (86%) journalists reported highest levels of uses for this purpose, while the figures were lowest in Finland (60%) and Germany (67%). There were also differences between the countries in relation to using social media for publishing and promoting with UK reporting highest figures (91%) and Finland and Germany (72% respectively) the lowest. Table 3—Social Media Use for Professional Tasks in a Typical Week (percent of respondents) Country Publishing Sourcing Networking Verifying Monitoring Canada 89% 89% 86% 71% 77% UK 91% 89% 87% 70% 76% Netherlands 89% 87% 82% 64% 69% France 81% 93% 78% 68% 80% US 84% 81% 80% 64% 73% Australia 82% 87% 82% 78% 81% Sweden 82% 88% 79% 76% 80% Germany 72% 79% 67% 60% 66% Finland 72% 85% 60% 68% 74% © 2013–2014 Cision p. 11
- 13. 2013 SOCIAL JOURNALISM STUDY 2. PRACTICE Over the last 12 months, publishing and promoting owned content was the professional task which saw the largest increase of social media use. The rise was especially significant in countries which reported the lowest levels of use for this task last year, namely Finland (22% increase), Sweden (19% increase) and Germany (15% increase). Countries which reported the highest levels of use last year—the US and Canada—both saw the smallest increases, 1% and 6% respectively, indicating a degree of saturation. Journalists in all countries also use social media more for networking compared to a year ago with largest increases in Sweden (18%), Australia (14%) and the UK (13%). Sourcing information is the professional task which saw the smallest increase of social media use. Indeed in some countries, namely in the US, Sweden and Australia, levels of use for this purpose stagnated. Only Finland saw a significant increase of social media use for sourcing from 44% in 2012 to 85% in 2013. Figure 7—Percentage of Journalists Using Social Media for Publishing and Promoting Content in a Typical Week (in percents) 84 83 US 91 81 UK 82 63 Sweden 72 57 Germany 81 65 France 72 50 Finland 89 83 Canada 82 74 Australia 0% 10% 20% 30% 40% 50% 60% 70% 80% 90% 100% 2013 © 2013–2014 Cision 2012 p. 12
- 14. 2013 SOCIAL JOURNALISM STUDY 3. KNOWLEDGE 3. KNOWLEDGE About three quarters of respondents rated their knowledge about social media tools as at least ‘good’ with just above a quarter reporting their knowledge as ‘limited’ or ‘non-existent’. Figures, again, varied between the countries (Figure 8). Countries with higher uses of the tools ranked, as to be expected, high on perceived knowledge too. In Canada, the UK and the US, 19%, 21% and 19% of journalists respectively told us that they had limited or no knowledge about social media, while the figure was 41% in Germany and 35% in Finland. Figure 8—Perceived Knowledge in Using Social Media Tools for Work (percent of respondents) Canada UK US Netherlands Sweden Australia France Germany Finland 0% 10% 20% 30% 40% 50% 60% 70% 80% 90% 100% None © 2013–2014 Cision Limited Good Extensive Expert p. 13
- 15. 2013 SOCIAL JOURNALISM STUDY 4. ATTITUDES 4. ATTITUDES The Social Journalism Barometer rated attitudes in relation to three indicators. The first indicator gaged the views of respondents about the impacts of social media on their work (Figure 9). They were asked to rate statements such as ‘Social media have improved the productivity of my work’ and ‘I would not be able to carry out my work without social media’. Journalists’ views varied greatly and there were significant differences between the countries, although at least 1/3 of respondents expressed ambivalence to the statements. French journalists were most ambivalent (65%), Germany journalists expressed the most negative views about the impact of social media on their work (31%) in contrast to Canada which had the least negative views (12%). Canada also had the highest percentage of those with positive views (48%) while France had the lowest (13%). Figure 9—Views About the Impacts of Social Media on Journalists’ Work (percent of respondents) Canada Sweden UK Netherlands US Australia Finland Germany France 0% 10% 20% 30% 40% 50% 60% 70% 80% 90% 100% Very Negative © 2013–2014 Cision Somewhat Negative Ambivalent Somewhat Positive Very Positive p. 14
- 16. 2013 SOCIAL JOURNALISM STUDY 4. ATTITUDES Interestingly, over the last 12 months the percentage of those with ambivalent views increased the most in all countries except Canada—where it remained the same— suggesting that journalists do not feel as strongly about social media as before. The level of increase was highest in France (41% to 65%) and the US (from 31% to 41%). The number of journalists with positive views remained largely the same in Finland, German, Sweden and the UK, but decreased in the other countries. The largest drop of those with positive views about the impacts of social media on their work was in France, where the figure dropped from 38% to 13%. In addition, Canada dropped from 60% to 48% and the US from 54% to 40%. The trend in these two countries is important to note because social media use has been the highest here, yet positive views about the impact of these tools on professional work has declined, which suggests a degree of disillusionment following the initial hype. Those with negative views decreased in Sweden, Germany, Finland and the UK (10%, 6%, 6% and 3% decline respectively). The figures for France, Canada and Australia remained largely the same, while there was a 4% increase of those with negative views in the US. Attitudes were also measured in relation to views about the impacts of social media on the journalistic profession (Figure 10). Respondents were asked to what extent they agreed with statements such as ‘Crowdsourcing will become the most important source of information’ and ‘Social media is undermining traditional journalistic values, such as objectivity’. Reinforcing the points made above, overall fewer respondents had negative views and a higher proportion expressed ambivalent views. Finnish journalists were the most positive—41% of them had a largely optimistic view about the impacts of social media on their profession. On the other end of the spectrum, US journalists were the most pessimistic with 31% of them expressing a generally negative view. For instance, while 3% of Finnish journalists agreed with the statement ‘Social media will lead to the death of professional journalism’, the figure for the US was 20%. It is notable that among the surveyed countries, European journalists were generally more positive about the impacts of social media on their profession compared to their counterparts in North America and Australia. This geographic divide in opinion is not present in relation to views about the impacts on journalists’ work. © 2013–2014 Cision p. 15
- 17. 2013 SOCIAL JOURNALISM STUDY 4. ATTITUDES Figure 10—Views about the Impacts of Social Media on the Profession (percent of respondents) Finland Sweden France UK Germany Netherlands Canada Australia US 0% 10% 20% 30% 40% 50% 60% 70% 80% 90% 100% Very Negative Somewhat Negative Ambivalent Somewhat Positive Very Positive During the last 12 months, opinions among journalists about the impacts of social media on their profession have hardened. The percentage of those who had overall negative views increased from 15% to 18%, and the figures for those with ambivalent views rose from 41% to 57%. Consequently, the proportion of those with positive views decreased from 45% to 25%. This trend indicates that the introductory phase of social media adoption—when enthusiasm about the potential use of these tools was high—has ended. In its place, journalists are entering the second phase when social media is fully integrated in a journalists’ work. Of particular note, it is the views about the impacts of social media on the profession that have hardened but not opinions about the use of these tools on journalists’ work. Behind these general trends, there were differences between the countries. Similar to last year, Scandinavian journalists have the most positive views about the impacts on their profession although the ranking switched, with Finland topping the indicator this year and Sweden in second. This was because positive views declined more in Sweden from 68% to 27%, while the drop in Finland was less marked, 46% to 41%. A significant change in the ranking of this indicator during the last 12 months was the drop of the two North American countries. Last year, Canada was third, this year it is seventh. The US was sixth last year and this year it is ninth. In both countries, the proportion of © 2013–2014 Cision p. 16
- 18. 2013 SOCIAL JOURNALISM STUDY 4. ATTITUDES respondents with generally positive views declined, from 44% to 17% in Canada and from 42% to 22% in the US. Significantly, the percentage of those with negative views also increased in these two countries, which was not the case in the surveyed European states. The percentage of those with negative views increased in Canada from 13% to 20%, and in the US from 19% to 31%. As these countries top the ranks for use of social media it is interesting that their views are less positive, reinforcing a view that there is a cooling of enthusiasm for social media amongst journalists. The final indicator concerned barriers to increased use of social media. The survey asked respondents about their views on online hate/trolling, concerns over privacy and data security as well as regulation of social media use in their organization. Overall, concern about accuracy was the most often cited barrier, followed by concerns about privacy and data security, while organizational regulations were seen as the least significant barrier. Most journalists had either ambivalent or positive attitudes to overcoming barriers. In most countries, at least half of the respondents had positive views in this regard, except France where the figure was 35%. Finish journalists were the most upbeat about overcoming barriers to social media use followed by their counterparts in Australia and the Netherlands (Figure 11). In contrast, France had the highest number of respondents who had negative views about overcoming barriers. Figure 11—Views about Overcoming Barriers to Social Media Use (percent respondents) Finland Australia Netherlands UK Germany Canada Sweden US France 0% 10% 20% 30% 40% 50% 60% 70% 80% 90% 100% Very Negative © 2013–2014 Cision Somewhat Negative Ambivalent Somewhat Positive Very Positive p. 17
- 19. 2013 SOCIAL JOURNALISM STUDY 4. ATTITUDES Journalists’ views about barriers have become somewhat more uncertain over the last 12 months. While the percentage of respondents with negative views decreased from 14% to 8% since last year, and those with positive views declined from 64% to 60%, the figure for those with ambivalent views increased from 27% to 32%. At both ends of the spectrum, the proportion of those with very negative and those with very positive views declined the most. Therefore, the ranking in this indicator changed considerably since the 2012 survey and Finland is now top with the highest percentage of those with positive views (83%). Similar to the previous indicator, it is notable that the rankings of the two North American countries have dropped. While Canada was third in this indicator last year, it is now sixth, and while the US was second last year it is now eighth. In both cases this was due to the fact that the decline in the percentages of those with positive views was higher than in many other countries. In Canada, the proportion of those with positive views dropped from 69% to 56%, while the figures decline from 73% to 50% in the US. 4.2 COMBINED RANKING The combined ranking of the Social Journalism Barometer is calculated by taking an average rank score for all four dimensions for each country (Table 4). Compared to last year, the ranking shows a more mixed and nuanced picture. The extent of differences, in terms of statistical variances, has decreased indicating that countries changed in different ways during the last 12 months. Canada still tops the combined ranking, but in terms of attitudes it is now in a middle position. The US dropped from second to fifth place in the combined ranking. US journalists are still among the highest users but their views about social media have become more reserved, especially in relation to impacts of social media on their profession and perceived barriers. Both the UK and Sweden improved in their ranking by one since last year because of continuing increase in social media use and less significant attitudinal changes compared to the two North American countries. Reasons for these changes are multi-fold, but two key issues are likely to have played a significant part. Firstly, countries have entered or are now entering, with different speeds, the second phase in social media adoption after the initial introductory phase. In this new phase, based on experiences of the first stage, understanding of the advantages and purposes of social media use are greater and opinions are better informed about the impacts of the tools. These lead to changes in practices as well as in attitudes, as we saw, in the cases of the two North American countries where attitudes have hardened during the last 12 months. Secondly, country-specific variables, such as journalistic cultures, socio-demographic characteristics in the profession and regulatory frameworks, are an increasingly important influence in the ways social media is being embedded in © 2013–2014 Cision p. 18
- 20. 2013 SOCIAL JOURNALISM STUDY 4. ATTITUDES journalists’ work. Similarly to last year, Finland, France and Germany are at the lowest positions, although in relation to most indicators there are no significant differences between these countries. However, both Finland and France ranked high in relation to a specific indicator. Finland topped two attitude indicators, while France was among the first four in relation to extent of professional social media activities. Table 4—Social Journalism Barometer 2013 Combined Ranking Country Involvement Practice Knowledge Attitudes Overall Rank Canada 1 1 1 5 1 UK 4 2 2 2 2 Sweden 5 4 5 2 3 Netherlands 1 7 4 4 4 US 1 4 3 9 5 Australia 5 3 6 6 6 Finland 8 8 9 1 7 France 7 6 7 8 8 Germany 9 9 8 7 9 © 2013–2014 Cision p. 19
- 21. 2013 SOCIAL JOURNALISM STUDY 5. SOCIAL MEDIA PROFILES 5. SOCIAL MEDIA PROFILES The study identified five types of professional social media users through cluster analysis, a statistical method to group journalists together based on similarities in attitude, behavior, use and engagement with social media. Globally in 2013, Observers are the largest cluster (30%) and Skeptics the smallest (9%). Since last year Observers have experienced the least change (only 4% growth) and Skeptics the most dramatic decline of 22%. Figure 12—The Social Journalist Development Chart (percentage of respondents in each cluster) 30% 25% 20% 31% 30% 26% 25% 20% 18% 15% 15% 10% 14% 11% 9% 5% 0% Architects Promoters Hunters 2013 Social Journalist EXPERT Observers Skeptics 2012 Social Journalist NOVICE On a scale of social journalism expertise--where the Architect is the mover and shaker of social media and the Skeptic is the novice--social media aptitude appears to progress from Skeptic to Observer, then to Promoter, next to Hunter and finally reaching Architect. This shows a clear pattern of journalists growing their skills and knowledge. The dramatic decline in Skeptics is evidence of this. © 2013–2014 Cision p. 20
- 22. 2013 SOCIAL JOURNALISM STUDY 5. SOCIAL MEDIA PROFILES A R C H I T E C T S : They use social media the most, with 34% using it for four hours or more per day. They also have the highest self-rated knowledge about social media, with 20% claiming they have expert knowledge and 41% having extensive knowledge. They also have the most positive views about social media, especially in relation to its improvement of productivity (72%) and that they could not work without social media (70%). Of all the groups, they are most likely to agree that PR practitioners are a reliable source of stories (51%) and that online sources are most important for them (55%). Their use of social media is the most diverse with a high percentage using it for a variety of professional tasks. For example, 99% use social media tools for publishing and promoting, but they also use the full range of social media tools like Twitter and audiovisual sharing sites such as YouTube. In addition to serving as content creators and contributors their daily tasks also include posting original comments (82%) reading posts of people they follow (79%) and reposting on a microblogging site (72%). Not surprisingly, online journalists are most likely to be found in this cluster and they are most likely to be freelancers or work for small organizations. Those who write reviews and/or columns/editorial are mostly likely to be Architects. This group rates social media as the second most preferred method for PR professionals to contact them and rates PR professionals as their main source of information when sourcing a story (55%). P R O M O T E R S : This group contains the second highest users of social media, with 17% using them for four hours or more per day. They have good self-rated knowledge about the tools with 44% saying they have extensive or expert knowledge. They have positive views about the impacts of social media, especially that it improved their relationship with their audience allowing them to communicate better with people in their field of work. They use the whole variety of social media tools just slightly less than the Architects, but have the highest use of microblogs for sourcing a story than any of the other groups. They use social media for different reasons with publishing and promoting (98%), sourcing (96%), and networking (95%) of considerable importance. They are only slightly less likely than Architects to have more than 500 followers. In terms of sourcing information, this group is mostly likely to refer to corporate organizations and PR sources. In their daily activities they are keen to post content, read other content and re-post on microblogging sites but wider networking activities are more likely to take place on a weekly basis. Promoters are most likely to be spread fairly equally across all media channels—although they slightly more likely to be in broadcasting (radio), work for a large company and contain hard news journalists (34%), and least likely to contain investigative journalists (2%). © 2013–2014 Cision p. 21
- 23. 2013 SOCIAL JOURNALISM STUDY 5. SOCIAL MEDIA PROFILES H U N T E R S : This group is in the middle in terms of time spent using social media, frequency of use and levels of knowledge, with 53% saying they have good knowledge. They tend to have positive views about social media—though not as strongly as the Architects or Promoters—and have strong concerns about accuracy which prevents them from using social media more. They use social media for a variety of reasons but networking and sourcing information are the key functions for them. They regularly use social media to meet new people in their field of work and follow people they know. They are also keen users of microblogs but are not frequent content creators. Hunters were most likely to state that they found microblogs (64%) and blogs (41%) the most valuable. Hunters prefer being contacted by email with telephone and social media being the second (37%) and third (33%) methods. Hunters are most likely to contain feature writers (29%) and least likely to contain investigative journalists (4%). They are also most likely to be online journalists (38%) followed by Print (Magazine) (24%), but are evenly spread through large (31%) and small (29%) organizations and slightly more likely to be female (53%). O B S E R V E R S : This group is the largest of all the clusters, having changed only marginally since last year. They represent journalists who keep a general eye on what is happening in social media but are not as negative as Skeptics and do not engage as frequently as hunters or Promoters. They are fairly low users with 78% reporting using social media up to two hours daily—they use most tools on a weekly basis with a high use of social networking (90%) and content communities (87%) but tend to use it for social networking on a monthly basis. They are keen users of social media for sourcing (89%) and publishing (85%) in a typical week, but their social media contribution, such as posting or commenting, occurs less frequently. Observers are the second least frequent users—weekly activities include reading posts, online forums, discussion groups and blogs, monitoring discussions, adding to and replying to comments and making original posts. Observers are the most likely of all the clusters to state that they find blogs one of the most valuable types of social media when sourcing a story (47%). Everything else they tend to perform on a monthly basis or not at all. They are not frequent content creators on social media, with 59% claiming never to contribute to content communities or write a work-related blog. Investigative journalists (37%) and hard news journalists (33%) are most likely to be Observers. Print journalists and broadcasters are most likely to be Observers with a slight female bias although they are found in equal measure in all different sized organizations. © 2013–2014 Cision p. 22
- 24. 2013 SOCIAL JOURNALISM STUDY 5. SOCIAL MEDIA PROFILES S K E P T I C S : This group represents the smallest out of all the journalists groups and represents the least active users. Although they are still users of social media, they do so reluctantly with 36% stating they have no followers on their preferred social networking site, and 61% reporting they have limited knowledge. They use all social media on a weekly basis mainly for sourcing (81%) but less for networking (51%) and monitoring (52%) than all the other groups—however, they are most likely to use content community and crowdsourcing sites (85%) for work on a weekly basis. They are particularly low users of microblogs for sourcing a story (12%) although they find professional social networking sites more valuable for sourcing than all the other clusters. They rarely, if ever, create content on social media sites and are poor networkers. Their self-rated knowledge about social media is low and most of them use only one or two types of social media forms. Their use of social media for publishing, promoting, networking and verifying are relatively low. They tend to have negative views about the impacts of social media, with 74% disagreeing that they wouldn’t be able to carry out their work without social media. Skeptics, like all groups, prefer to be contacted by email and then telephone, with the lowest response of all clusters for preferring social media as a PR contact method. Skeptics are most likely to contain hard news journalists (27%) and least likely to contain columns/editorial journalists (5%), print (magazine) journalists and work in large organizations (35%). This group is the smallest number of 18–27 year-olds and the largest number of over 46 year-olds (61%) although the gender balance is equal. CHANGE BY COUNTRY IN PROFESSIONAL SOCIAL MEDIA GROUPS The study revealed that the five professional social media profile groups were evident in all surveyed countries, but the proportion (Table 5) and specific characteristics of the profiles varied. The Architects are most likely to be from US (34%) and UK (25%) and least likely to be from Australia and Finland (both 3%). The Promoters are most likely to be from the UK (31%) and least likely to be from Australia and Finland (both 5%). The Hunters are most likely to be from the UK (31%) and least likely to be from Australia (4%) and Finland (6%). The Observers are most likely to be from the US (25%) and Finland (16%) and least likely to be from Australia (3%), the Netherlands and Canada (both 6%). Skeptics are an interesting group and again show the greatest variation between the smallest group size in Australia (1%) in contrast to the largest groups in Finland (28%) and Germany (37%). © 2013–2014 Cision p. 23
- 25. 2013 SOCIAL JOURNALISM STUDY 5. SOCIAL MEDIA PROFILES Table 5—Professional Social Media Profile Groups by Country 2012–2013 Cluster Architects Promoters Hunters Observers Skeptics Canada 2013 33% 15% 21% 25% 4% Canada 2012 24% 17% 24% 22% 14% UK 2013 28% 20% 27% 20% 4% UK 2012 12% 25% 35% 19% 9% US 2013 33% 14% 19% 29% 5% US 2012 20% 36% 15% 9% 20% Australia 2013 19% 22% 25% 30% 4% Australia 2012 24% 16% 29% 19% 12% Sweden 2013 19% 12% 15% 41% 12% Sweden 2012 6% 20% 23% 14% 36% Germany 2013 17% 15% 13% 35% 21% Germany 2012 21% 9% 12% 23% 35% 9% 9% 8% 16% 11% Average Change Year on year the change within these groups within the different countries indicate shifting patterns of social journalism. Canada and the UK remained fairly stable with the sizes of their groups which is interesting given they also were the highest performers on the Social Journalism Barometer. The global decline in Skeptics and growth of Architects, slight increases in Observers and Hunters and almost stable numbers of Promoters is reflected in most countries. However there are some noticeable differences in the changes within the countries. For example, average percentage change was the highest for Observers while Canada and the UK remained fairly stable in contrast to the US, Sweden, Australia and Finland which saw substantial increases of 20%, 27%, 11% and 30%. Hunters saw the lowest average change, although Finland in particular bucked the trend with a decline from 40% of to 12%. In the US some Skeptics have moved towards the Observers, and the large decline © 2013–2014 Cision p. 24
- 26. 2013 SOCIAL JOURNALISM STUDY 5. SOCIAL MEDIA PROFILES of Promoters (22% from 2012 to 2013) appears to have transferred to the growth in Architects, reinforcing the idea of social media progression. However, Finland appears to contradict this trend with a growth of 30% in Observers apparently having moved from Promoters and Hunters towards the more inactive social media side. Only trends from the following year will determine whether this pattern is consistent or not. SPECIFIC CHARACTERISTICS OF PROFESSIONAL SOCIAL MEDIA PROFILES Time spent on social media reflects the same categories of progression on the Social Journalist Development Chart (Table 6), with Architects spending the most hours per day using social media for work and Skeptics the least. Nearly all the Skeptics (91%) spend less than two hours a day using social media for their work. The Skeptics are also the only cluster not to have any members who report spending more than eight hours a day using social media for their work and to have less than 10% of respondents reporting that they spend more than two hours a day using social media for their work. The Observers are the second most infrequent users of social media. More than three quarters of their cluster (78%) report spending less than two hours using social media for their work and they are the only other cluster where less than a quarter (24%) of their members report spending more than two hours a day using social media for their work. The Architects are the most frequent users. They are the only cluster where the majority of their members (66%) spend more than two hours a day using social media for their work. They are also the only cluster where more than a third of their members (34%) spend more than four hours a day using social media for their work. In-fact, nearly 10% of their members (8%) report spending more than eight hours a day using it. The Promoters are the second most frequent users. Nearly half of their members (48%) spend more than two hours in an average day using social media for their work and 17% spend more than four hours a day using it. The Hunters are the more middling users. More than two thirds (69%) spend less than two hours a day using social media for their work and less than 10% (8%) spend more than four hours a day using it. © 2013–2014 Cision p. 25
- 27. 2013 SOCIAL JOURNALISM STUDY 5. SOCIAL MEDIA PROFILES Table 6—Time Clusters Spend on Social Media Up to 2 hours 2–4 Hours 4–6 Hours 6–8 Hours More than 8 Hours Architects 34% 34% 16% 10% 8% Promoters 52% 31% 7% 7% 3% Hunters 69% 23% 5% 2% 1% Observers 78% 17% 4% 2% 1% Skeptics 91% 4% 3% 1% 0% Cluster Social networking sites and content communities are the two most widely used social media tools and social reader and bookmarking sites the least used. When ranking the highest and lowers users of the different social media tools (Table 7) it is apparent that Architects use all tools the most, Promoters the second most for all tools and Skeptics always use them the least. Table 7—Professional Social Media Profiles and Use of Specific Social Media Tools Blogs Content communities/ crowdsourcing sites Microbogs Architects 1 1 1 1 Promoters 2 2 2 Hunters 4 5 Observers 3 Skeptics 5 Cluster © 2013–2014 Cision Audiovisual sharing sites Social reader and bookmarking tools Mean 1 1 1 1 2 2 2 2 2 3 3 4 3 4 3 3 4 4 3 4 3 4 4 5 5 5 5 5 5 Proff. Social social networking networking sites sites p. 26
- 28. 2013 SOCIAL JOURNALISM STUDY 5. SOCIAL MEDIA PROFILES Architects are the most avid users of all social media tools for their work with the exception of content communities, which are used by Promoters more (Table 8). Observers cite social networking (90%) as the most widely-used social media tool they use in a typical week for work. Architects (99%), Promoters (97%) and Hunters (96%) are avid users of microblogs as their preferred tool, whilst Skeptics, in contrast, are most likely to cite content communities (85%) and social networking as their preferred tools. Table 8—Use of Social Media Tool by Professional Media Group Cluster Blogs Content communities/ crowdsourcing sites Architects 97% 90% 99% 9% 96% 90% 61% 89% Promoters 87% 92% 97% 88% 94% 83% 50% 84% Hunters 85% 79% 96% 80% 89% 77% 38% 78% Observers 86% 87% 78% 76% 90% 75% 41% 76% Skeptics 62% 85% 51% 68% 75% 64% 33% 63% Microbogs Proff. Social social networking networking sites sites Audiovisual sharing sites Social reader and bookmarking tools Mean The spread of knowledge varies across the groups although there is evidence that nearly all groups have a least some knowledge of social media, with only Skeptics (2%) claiming they have no knowledge of social media (Table 9). Architects were the group most likely to report as having expert knowledge (20%) followed by Promoters (11%). Although Hunters and Observers are seen as being very similar with 4% of both groups claiming they have expert knowledge, (Table 7) almost double the number of Hunters (31%) claim to have extensive knowledge than Observers (16%). © 2013–2014 Cision p. 27
- 29. 2013 SOCIAL JOURNALISM STUDY 5. SOCIAL MEDIA PROFILES Table 9—Self-reported Levels of Knowledge Cluster None Limited Good Extensive Expert Architects 0% 4% 35% 41% 20% Promoters 0% 12% 45% 33% 11% Hunters 0% 13% 52% 31% 4% Observers 0% 28% 53% 16% 4% Skeptics 2% 61% 31% 4% 1% Overall the patterns of agreement with various attitude statements fitted in to the Social Media Development Chart model (Figure 12) with Architects and Promoters having the most positive opinions and Skeptics the most negative. For example, when asked whether social media enables them to be more engaged with their audience, there was almost unanimous agreement with this from Architects and Promoters compared to 40% of Skeptics. Figure 13—Percent ff Respondents in Each Groups Who Agree that Social Media Enables Them to be More Engaged With Their Audience 100% 90% 80% 93% 93% 87% 70% 73% 60% 50% 40% 40% 30% 20% 10% 0% Architects © 2013–2014 Cision Promoters Hunters Observers Skeptics p. 28
- 30. 2013 SOCIAL JOURNALISM STUDY 5. SOCIAL MEDIA PROFILES However, other opinions showed less variation across the groups. For example, between 59–63% of respondents from all groups disagreed with the statement that online hate or trolling restricts their social media use, between 69–78% all groups agree accuracy is the biggest problem and 67–75% disagree that there are too many regulations about social media use. Overall, this closer examination of some of the questions illustrates how the various professional groups emerged and how these variations in working practices need to be understood so that training can be put in place, and PR practitioners can segment these groups in the way they communicate to facilitate better working relationships. © 2013–2014 Cision p. 29
- 31. 2013 SOCIAL JOURNALISM STUDY 6. PREFERENCES 6. PREFERENCES RELATIONSHIP WITH PUBLIC RELATIONS Journalists stated that their first source of information for sourcing a story is directly from an organization (45%), possibly contacting the press office to identify the information needed. The second most popular source (41%) is PR sources although Architects cited PR sources as being the main place they would source information for a story. The top three methods used by PR professionals to contact journalists were via email (84%), telephone (47%) and social media (19%), but when asked how they would prefer to be contacted, email remained the most popular (82%), with telephone preferred by fewer journalists (33%) and social media preferred by the least journalists (25%). However, more journalists prefer social media than are currently being contacted through this channel. In terms of what social media tools are used specifically for sourcing information, microblogs were the most popular for Promoters (66%), Hunters (64%) and Architects (61%) compared to Observers (31%) and Skeptics (12%). The Skeptics are the only cluster to find content community and crowdsourcing sites (56%) the most valuable social media when sourcing a story and only Hunters were most likely to state that they found microblogs (64%) and blogs (41%) the most valuable. Figure 14—Comparison Between the Percent of Respondents in Each Cluster Currently Contacted by PR Professionals Via Social Media to the Percent Who Would Prefer to be Contact by this Method 47% 40% 41% 30% 33% 31% 20% 21% 21% 22% 16% 10% 6% 0% Architects © 2013–2014 Cision Promoters Currently Communicate Hunters Observers Prefer to Communicate 9% Skeptics p. 30
- 32. 2013 SOCIAL JOURNALISM STUDY 6. PREFERENCES All the professional social media groups stated they would like PR professionals to communicate more through social media than they are currently doing, illustrating that to improve the PR–journalist relationship, social media tools should be used more often—although email and face-to-face remain the most important contact methods. ABOUT THE DATA Most of the findings are based on over 3,000 responses, although social media profiles uses 2851 respondents as France, Italy and Spain had too few participants undertake meaningful analysis. This resulted in a response rate of 3.16%. The proportion of male and female was a perfect 50/50 split and slightly less than half fell in the 28–45 age bracket (46%). Magazine journalists (29%) and journalists who publish online (38%) made up two thirds of the sample. Figure 15—Characteristics of Data Age 12% 18–27 Organization Size Media Sector Journalistic Content 46% 28–45 32% Large 18% Newspaper 5% 7% Radio 25% Hard News Investigative 38% 46–64 18% Medium 29% Magazine 12% Soft News 32% Small 18% Freelance 5% TV 11% Reviews 3% 65+ 38% Online 11% 25% Feature Writing Columns/Editorials 0% 10% 20% 30% 40% 50% 60% 70% 80% 90% 100% © 2013–2014 Cision p. 31
- 33. 2013 SOCIAL JOURNALISM STUDY ABOUT THE SURVEY ABOUT THE SURVEY Cision Europe and Canterbury Christ Church University conducted an online survey about the uses and perceptions, attitudes and behaviors of social media among journalists. Respondents were taken from Cision’s media database of more than 1.6 million influencers, publications and blogs/bloggers globally. This year’s study received over 3,000 responses from journalists in 11 different countries; US, Canada, Australia, France, Germany, UK, Finland, Sweden, Italy, Spain and the Netherlands. The responses were in the following proportions: || Throughout the survey the term ‘journalist’ is used to include other media professionals e.g. researchers, editors etc. The statistical analysis, based on a 95% confidence interval, examined the differences and similarities between sub-populations of respondents. || The types of professional social media users were developed using cluster analysis. Therefore, figures for the clusters presented from comparing to the global data will differ slightly from cluster analysis performed on individual countries. || The survey is designed to enhance the media industry’s understanding of social media uptake and the impact of social media technologies and processes on journalists’ work. Cision conducts this survey on an annual basis to continue to inform on best practices within the PR and communications field and to deepen the industry’s understanding of how journalists and professional communicators use and value social media and other resources. || The research examined the patterns of social media usage of journalists, for what professional tasks they use social media and how they view the impact of social media on journalistic practices and professional values. © 2013–2014 Cision p. 32
- 34. 2013 SOCIAL JOURNALISM STUDY ABOUT THE SURVEY FOR MORE INFORMATION ABOUT THE SURVEY, PLEASE CONTACT: Falk Rehkopf (Cand. Ph.D., MBA, BA) Managing Director, Cision Germany GmbH falk.rehkopf@cision.com Dr. Ágnes Gulyás Reader, Department of Media, Art and Design, Canterbury Christ Church University agnes.gulyas@canterbury.ac.uk Kristine Pole Programme Director, Marketing, Business School, Canterbury Christ Church University kristine.pole@canterbury.ac.uk ABOUT CISION Cision is the leading provider of software, services, and tools to the public relations and marketing industry. Marketing and PR professionals use our products to help manage all aspects of their brands— from identifying key media and influencers to connecting with audiences; monitoring traditional and social media; and analyzing outcomes. Journalists, bloggers, and other influencers use Cision’s tools to research story ideas, track trends, and maintain their public profiles. Cision is present in Europe, North America and Asia, has partners in over 125 countries and is quoted on the Nordic Exchange with revenue of SEK 1.0 billion in 2011. For more information, visit www.cision.com ABOUT CANTERBURY CHRIST CHURCH UNIVERSITY Canterbury Christ Church University is a modern university with a particular strength in higher education for the public services. With nearly 20,000 students, and five campuses across Kent and Medway, its courses span a wide range of academic and professional expertise. 93% of our recent UK undergraduates were in employment of further study six months after completing their studies. Along with over a thousand undergraduate, postgraduate and professional training courses on offer, the University is also home to world-leading and internationally recognized research. For more information, visit: www.canterbury.ac.uk © 2013–2014 Cision p. 33