SlideShare a Scribd company logo
1 of 67
Derivatives in
Graphing and
Applications
Calculus-I
Chapter 4
Watch this!
 https://www.khanacademy.org/partner-
content/pixar/start/introduction/v/pipeline-video
 https://www.khanacademy.org/partner-
content/pixar/environment-modeling-2/mathematics-
of-parabolas2-ver2/a/parabolas-lesson-brief
 https://www.khanacademy.org/partner-
content/pixar/environment-modeling-2/animating-
parabolas-ver2/v/overview-parabolic-arcs
 https://www.khanacademy.org/partner-
content/pixar/environment-modeling-2/animating-
parabolas-ver2/v/environment-modeling2
4.1 Analysis of Functions- I (PG:232)
 Increase, Decrease and Concavity
Remember-
 To find Increasing/Decreasing functions, always
Read from Left to Right-
4.2 Analysis of Functions-II (pg:244)
 Relative Extrema;
 Graphing Polynomial
Slope of a Tangent line dy/dx
Rate of change and slope
 Secant line = Average Rate of Change = Slope

 A tangent line is a straight line that touches a
function at only one point. (See above.) The
tangent line represents the instantaneous rate
of change of the function at that one point. The
slope of the tangent line at a point on the
function is equal to the derivative of the function
at the same point (See below.)

 In this first animation we see the secant line
become the tangent line i.e we go from the
Average Rate of Change to the Instantaneous
Rate of Change by letting the interval over
which the Average Rate of Change is
measured go to zero.
 Secant line Tangent Line
 Tangent Line = Instantaneous Rate of Change =
Derivative
Finding SLOPE of a line
 Have you ever heard of Mr. SLOPE GUY?
Mnemonics-
Example: To find slopes
 For horizontal lines:
 Slope=0
 Z for zero
 For vertical lines:
 Slope is undefined
 N for No slope
Memorizing the formulas:
 Use- Pascal’s Triangle
Increasing and Decreasing Functions
 Definition: 4.1.1 (pg: 233)
.sin)(),()( 2121 functiongincreaanisxfthenxfxfimpliesxxIf 
.sin)(),()( 2121 functiongdecreaaisxfthenxfxfimpliesxxIf 
Increasing and Decreasing Functions
 Theorem 4.1.2 (pg:233)
 Let f be a function that is continuous on a closed
interval
[a, b] and differentiable on the open interval (a,
b).
(a) If f’(x) > 0 for every x in (a, b), then f is
increasing on (a,b)
(b) If f’(x) < 0 for every x in (a, b), then f is
decreasing on (a,b)
(c) If f’(x) = 0 for every x in (a, b), then f is constant
on (a,b)
Discontinuous function
Example
Use the graph below to make a conjecture about the
intervals on which f is increasing or decreasing.
21243)( 234
 xxxxf
is decreasing if 2f x  
is increasing if -2 0f x 
is decreasing if 0 1f x 
is increasing if 1f x 
Use increasing/decreasing test to verify your conjecture.
21243)( 234
 xxxxf
xxxxf 241212)( 23/

)1)(2(12)(/
 xxxxf
-2 0 1
- - - - - + + + - - - - + + +
Increasing:
Decreasing:
Continuous function
 Find the intervals on which the function f(x) is
increasing and where it is decreasing.
 Find the intervals on which the function f(x) is
increasing and where it is decreasing.
4.2 CRITICAL POINTS (pg:245)
 Critical Values: The x-values at which the f ‘(x)=0 or
f ‘(x) fails to exist.
 Note: 1. The x-values at which the f ‘(x)=0 are called
Stationary Points.
 Note: The critical values are the points where the
graph will switch from increasing to decreasing or vice
versa.
 Find the critical points for the following functions:
Examples:
1.f(x) = 3x2 – 6x + 3 2. f(x) = x3/2 – 3x + 7
x = 1 x = 4
Finding points where horizontal
tangents to a curve occur
4.2 Exp: 3 (pg:245)
 Find all critical points of
3/23/5
153)( xxxf 
Qs: 7 -14 Ex: 4.2 (pg: 252)
 Locate the critical points and identify which critical
points are stationary points.
 Qs: 8
 Qs: 9
x12x3)x(f 4

3x
1x
)x(f 2



Key Topics
 Relative maximum: the highest value for f(x) at that
particular “peak” in the graph
 Relative minimum: the lowest value for f(x) at that
particular “valley” in the graph
Relative maximum
Relative maximum
Relative minimum Relative minimum
Relative minimum
Key Topics
 How to determine whether it is a relative maximum or
a relative minimum at a focal point:
Step 1: Find the points of the graph to determine the
intervals on which f(x) is increasing or decreasing
Step 2: Choose an x-value in each interval to determine
whether the function is increasing or decreasing within that
interval
Step 3: If f(x) switches from increasing to decreasing at a
critical point, there is a relative maximum at that critical
point
If f(x) switches from decreasing to increasing at a critical
point, there is a relative minimum at that critical point.
Key Topics
 It might help to make a number line displaying
your findings
- - - | +++++++ | - - - - | +++++++ | - - - - - - - | +++
- to + means minimum
+ to - means maximum
First derivative test to check for
maximum and minimum points
 Let f be a twice differentiable function.
 Find f’(x), and put it equal to zero. Find the critical
points.
 Take test points, to check if f’(x) > 0 or < 0, for
increasing and decreasing function..
 If f ‘(x) changes sign from + to -, then x = c has a
maximum value, and if f changes sign from - to +,
then x = c has a minimum value.
 If f’(x) remains positive, then f is an increasing
function, and if it remains negative, it is a
deceasing function.
Relative Maxima and Minima
Exp: 5 (pg: 248)
Interval
Test values
Sign of f’(x)
Conclusion
Find the Relative Extrema of .
Hint: First find critical points using f’(x)=0.
Then find intervals where the function is inc/dec.
Let’s make a table:
35
x5x3)x(f 
4.1 Concavity- Up and Down
(pg:235)
CONCAVE UP CONCAVE DOWN
 A function f is
concave up on an
open interval if its
tangent lines have
increasing slopes on
that interval.
 In this case, the graph
of f lies above its
tangent lines.
 A function f is
concave down on an
open interval if its
tangent lines have
decreasing slopes on
that interval.
 In this case, the graph
of f lies below its
tangent lines.
concave up:
f’ is increasing.
tangent lines are
below the graph.
concave down:
f’ is decreasing.
tangent lines are
above the graph.
Concavity
Mathematical
Rhymes?
To determine the concavity of a
function using second derivative
Concave upward Concave downward
Think of
some
examples …
Finding Concavity
 Theorem 4.1.4 (pg:235)
 Let f be a function which is twice differentiable on
an open interval (a, b).
(a) If f”(x) > 0 for every x in (a, b), then f is concave
up on (a,b)
(b) If f”(x) < 0 for every x in (a, b), then f is concave
down on (a,b)
4.1 Inflection Points (pg:236)
If f is continuous on an open interval
containing a value x = d, and if f changes the
direction of its concavity at the point (d, f(d)),
then f has an inflection point at x = d.
Inflection Point
To find inflection points, find any point, c, in the domain
where ( ) 0 or ( )f x f x 
changes sign from the left to the right of c,
is undefined.
f If
Then (c, f(c)) is an inflection point of f.
Find point of inflection.
Concavity
Test for concavity
Find the second derivative.
Put f ”(x) = 0 (to find points of inflection). Take test points.
a) If for every value of x in I, then f is concave up
on I.
b) If for every value of x in I, then f is concave
down on I.
0)(//
xf
( ) 0f x 
Second derivative test to check for
Concavity, and point of inflection
 Let f be a twice differentiable function.
 Find f”(x), and put it equal to zero. Find the points
of inflection x= a.
 Take test points, to check if f”(a) > 0 for concave
up or
f”(a) < 0, for concave down.
 Note: Find f”(x); is
undefined, gives points of inflection.
( ) 0 or ( )f x f x 
Example
Given , find the intervals on which f is
increasing/decreasing and concave up/down. Locate all
points of inflection.
13)( 23
 xxxf
Solution
13)( 23
 xxxf
2
( ) 3 6f x x x     3 2x x 
( ) 0f x  at x = 0 and at x = 2
0 2 
+ ++ - - - + ++
Increasing: (-∞, 0) U (2, ∞)
Decreasing: (0, 2)
Sign analysis of
 1
 , 1
 1, 
This will tell us where it is concave up and down:
¢¢f x( )= 6x -6 f “(x) = 0
at x = 1
- - - + ++
Concave Up:
Concave Down:
Questions: Find the interval where f is
increasing/decreasing/concave up/concave
down/ point of inflections, if any.
 Q:1
 Q: 2
 Q: 3
 Q:4
34)( 2
 xxxf
x
exxf 
 )1()(
3
)( xxf 
3/1
x3x2)x(f 
4.2 Second Derivative Test: (pg:247)
 Suppose f is twice differentiable at the point x = c.
 (i) If f ’(x) = o and f “(x) > 0, then f has a relative
minimum at x = c.
 (ii) If f ’(x) = o and f “(x) < 0, then f has a relative
maximum at x = c.
 (iii) If f ’(x) = o and f “(x) = 0, then the test is
inconclusive;
that is, f may have a relative maximum, a
relative minimum, or neither at x = c.
Exp: Find the relative extrema using second
derivative test: f”(x)< 0 ---Max and f”(x)> 0 ---
Min
Interval
Test values
Sign of f”(x)
Conclusion
3/22
)4()(  xxf
Test for Concavity
1. If f”(x) > 0 for all x in I, then f is concave up.
2. If f”(x) < 0 for all x in I, then f is concave down.
2nd Derivative Test (Use C.pts. of 1st Derivative)
1. If f”(c) > 0, then f(c) is a relative min.
2. If f”(c) < 0, then f(c) is a relative max.
3. If f”(c) = 0, then the test fails. No min. or max.
9
-9
-16
-27
Ex. 2 Determine where f(x) = x4 – 4x3 is
increasing, decreasing, has max’s or min’s, is
concave up or down, has inflection points.
Ques: 54 Ex:4.2 (pg:
253)
 Draw the graph of the
polynomial, and label
the coordinates of the
intercepts, stationary
points, and inflection
points.
 Check your work with a
graphing utility
(Desmos).
32
xx2x2)x(f 
For Graphing the function:
 Collect all the
information :
 1. Critical points: f '(x) =
0.
 2. Increasing /
Decreasing intervals;
 3. Points of inflection:
f"(x) = 0
 4. Concavity: up/down
 5. End behaviour: Limits
as x tends to plus /
minus infinity (
)
 6. x- intercepts (put y =
0) and y intercepts
 xorx
32
xx2x2)x(f 
Ex. 1 Determine where f(x) = 6(x2 + 3)-1 is
increasing, decreasing, has max’s or min’s, is
concave up or down, has inflection points.
f’(x) = -6(x2 + 3)-2(2x)
 22
3
12



x
x
C.point x= 0
0
+ 
 
.
0,
inc
  
.
,0
dec

1st der.
test
(0,2)
max.
f '(x) 
12x
x2
 3 
2
f "(x) 
x2
 3 
2
12  12x  2  x2
 3 2x 
x2
 3 
4
f "(x) 
12  x2
 3  x2
 3  4x2
 
x2
 3 
4


12  x2
 3 3x2
 3 
x2
 3 
4

36 x2
1 
x2
 3 
3
C.N.’s -1, 1
-1 1

concave up

down

up
 1,  1,1  ,1
Inflection points (-1, ) (1, )2
3
2
3
2nd Derivative Test Plug C.N.’s of 1st der. into 2nd
derivative.
C.N. from 1st der. was 0.  
 32
2
3
136
)("



x
x
xf
 0)0("f 0 is a maximum
Remember, a neg. in the 2nd der. means concave down.
Therefore,
the point is a maximum.
(0,2) max
(-1, 3/2) Inf. pt. (1, 3/2) Inf. pt.
There are no x-intercepts
4.3 Graphs of Rational functions:
(pg:254)
 Properties of Graphs:
 1. Symmetries (replace x by -x and y by -y)
 2. x- intercepts (put y = 0) and y- intercepts (put x
= 0)
 3. Relative extrema (maxima and minima)
 4. Concavity (up or down)
 5. Intervals of increase and decrease (
)
 6. Inflection points (Put and take test
points)
 7. Asymptotes (Horizontal: Take limit as )
 (Vertical: Put denominator = 0, after factoring
and cancellation)
 8. End behavior as
0)x(for0)x(f 
0)x(f 
 xorx
Example: pg:255
 Sketch a graph of


 (Then check and confirm on Desmos)
16x
8x2
y 2
2



x x
40 2x-
( )40 2A x x= -
2
40 2A x x= -
40 4A x¢ = -
0 40 4x= -
4 40x =
10x =
( )10 40 2 10A = - ×
( )10 20A =
2
200 ftA =
40 2l x= -
w x= 10 ftw =
20 ftl =
A Classic Problem
You have 40 feet of fence to enclose a rectangular garden
along the side of a barn. What is the maximum area that
you can enclose?
Example 1
What dimensions for a one liter cylindrical can will
use the least amount of material? (Least amount
of surface area)
We can minimize the material by minimizing the surface a
2
2 2A r rhp p= +
area of
ends
lateral
area
We need another
equation that
relates r and h:
2
V r hp=
( )3
1 L 1000 cm=
2
1000 r hp=
2
1000
h
rp
=
2
2
10 0
2
0
2A r r
rp
p p= + ×
2 2000
2A r
r
p= +
¢A = 4pr -
2000
r2
= 0
Example 2
Now plug in for “h”
2
2000
4 r
r
p=
3
500
r
p
=
5.42 cmr » ( )
2
1000
5.42
h
p
»
10.83 cmh »
Area and Perimeter – Example
Find the dimensions of a rectangular area of 225
square meters that has the least perimeter.
Drawing a figure might help.
l
w
A = l · w = 225
P = 2 · l + 2 · w
From the area equation solve for l and substitute
w
225
l 
P = 2 · l + 2 · w = w2
w
450

P'(w) =
2w2
- 450
w2
=
2(w -15)(w +15)
w2
= 0
There is a critical value at 15 and -15
So w = 15 meters,
and l = 15 meters
(square area)
Perimeter = 60 m
Maximizing Revenue and Profit
A company manufactures and sells x television sets per month.
The monthly cost and price-demand equations are:
R (x) = xp =
C (x) = 60,000 + 60x and p = 200 – x/50
a. Find the maximum revenue.
Maximum at R’(x) = 0
50
200
2
x
x 
R ‘ (x) =
25
200
x

x = 5,000
R(5000) = $500,000
Application #1 continued
P (x) =
b. Find the maximum profit, the production level that will realize
the maximum profit, and the price the company should charge
for each television set.
P ‘ (x) has a critical
value at x =
000,60140
50
2


x
x
P (3500) =
p (3500) =
C (x) = 60,000 + 60x and p = 200 – x/50
P ‘ (x) =
- x
25
+140 = 0
3500.
$185,000
$130 per TV.
50
200
2
x
x R (x) =
P(x)= R(x)-C(x)
P(x) = 200x -
x2
50
æ
è
ç
ö
ø
÷- 60000+60x( )

More Related Content

What's hot

4.5 continuous functions and differentiable functions
4.5 continuous functions and differentiable functions4.5 continuous functions and differentiable functions
4.5 continuous functions and differentiable functions
math265
 
Lesson 4.1 Extreme Values
Lesson 4.1 Extreme ValuesLesson 4.1 Extreme Values
Lesson 4.1 Extreme Values
Sharon Henry
 
Lesson 3.3 3.4 - 1 st and 2nd Derivative Information
Lesson 3.3 3.4 - 1 st and 2nd Derivative InformationLesson 3.3 3.4 - 1 st and 2nd Derivative Information
Lesson 3.3 3.4 - 1 st and 2nd Derivative Information
Sharon Henry
 
Extreme Value
Extreme ValueExtreme Value
Extreme Value
nclamelas
 
5.7 rolle's thrm & mv theorem
5.7 rolle's thrm & mv theorem5.7 rolle's thrm & mv theorem
5.7 rolle's thrm & mv theorem
dicosmo178
 
Lesson 3.3 First Derivative Information
Lesson 3.3 First Derivative InformationLesson 3.3 First Derivative Information
Lesson 3.3 First Derivative Information
Sharon Henry
 
Lecture 12(point of inflection and concavity)
Lecture 12(point of inflection and concavity)Lecture 12(point of inflection and concavity)
Lecture 12(point of inflection and concavity)
FahadYaqoob5
 

What's hot (17)

Lecture 7(b) derivative as a function
Lecture 7(b)   derivative as a functionLecture 7(b)   derivative as a function
Lecture 7(b) derivative as a function
 
4.5 continuous functions and differentiable functions
4.5 continuous functions and differentiable functions4.5 continuous functions and differentiable functions
4.5 continuous functions and differentiable functions
 
Lesson 20: Derivatives and the Shapes of Curves (slides)
Lesson 20: Derivatives and the Shapes of Curves (slides)Lesson 20: Derivatives and the Shapes of Curves (slides)
Lesson 20: Derivatives and the Shapes of Curves (slides)
 
Lesson 4.1 Extreme Values
Lesson 4.1 Extreme ValuesLesson 4.1 Extreme Values
Lesson 4.1 Extreme Values
 
Calculus- Basics
Calculus- BasicsCalculus- Basics
Calculus- Basics
 
Lesson 3.3 3.4 - 1 st and 2nd Derivative Information
Lesson 3.3 3.4 - 1 st and 2nd Derivative InformationLesson 3.3 3.4 - 1 st and 2nd Derivative Information
Lesson 3.3 3.4 - 1 st and 2nd Derivative Information
 
Functions and its Applications in Mathematics
Functions and its Applications in MathematicsFunctions and its Applications in Mathematics
Functions and its Applications in Mathematics
 
Extreme Value
Extreme ValueExtreme Value
Extreme Value
 
Rolles theorem
Rolles theoremRolles theorem
Rolles theorem
 
5.7 rolle's thrm & mv theorem
5.7 rolle's thrm & mv theorem5.7 rolle's thrm & mv theorem
5.7 rolle's thrm & mv theorem
 
Second Derivative Information
Second Derivative InformationSecond Derivative Information
Second Derivative Information
 
Lesson 3.3 First Derivative Information
Lesson 3.3 First Derivative InformationLesson 3.3 First Derivative Information
Lesson 3.3 First Derivative Information
 
Lecture 12(point of inflection and concavity)
Lecture 12(point of inflection and concavity)Lecture 12(point of inflection and concavity)
Lecture 12(point of inflection and concavity)
 
Lar calc10 ch03_sec4
Lar calc10 ch03_sec4Lar calc10 ch03_sec4
Lar calc10 ch03_sec4
 
Scala collection methods flatMap and flatten are more powerful than monadic f...
Scala collection methods flatMap and flatten are more powerful than monadic f...Scala collection methods flatMap and flatten are more powerful than monadic f...
Scala collection methods flatMap and flatten are more powerful than monadic f...
 
MEAN VALUE THEOREM
MEAN VALUE THEOREMMEAN VALUE THEOREM
MEAN VALUE THEOREM
 
Assignment on Numerical Method C Code
Assignment on Numerical Method C CodeAssignment on Numerical Method C Code
Assignment on Numerical Method C Code
 

Viewers also liked

enchant js workshop on Calpoly
enchant js workshop  on Calpolyenchant js workshop  on Calpoly
enchant js workshop on Calpoly
Ryo Shimizu
 
Código das equipes atualizado
Código das equipes atualizadoCódigo das equipes atualizado
Código das equipes atualizado
Major Ribamar
 
Taylor Cutrer
Taylor CutrerTaylor Cutrer
Taylor Cutrer
adubose
 
ömer ismihan 20060450
ömer ismihan 20060450ömer ismihan 20060450
ömer ismihan 20060450
Omar İsmihan
 
Amber’s final magazine
Amber’s  final magazine Amber’s  final magazine
Amber’s final magazine
Amber_
 
Amber's evaluation
Amber's evaluationAmber's evaluation
Amber's evaluation
Amber_
 
Recruitment Process Outsourcing
Recruitment Process OutsourcingRecruitment Process Outsourcing
Recruitment Process Outsourcing
KapilKumar0111
 
Taylor Smith
Taylor SmithTaylor Smith
Taylor Smith
adubose
 

Viewers also liked (20)

IxDA Edu Summit 2015 - Pontus Warnestal
IxDA Edu Summit 2015 - Pontus WarnestalIxDA Edu Summit 2015 - Pontus Warnestal
IxDA Edu Summit 2015 - Pontus Warnestal
 
Volumes of solids of revolution dfs
Volumes of solids of revolution dfsVolumes of solids of revolution dfs
Volumes of solids of revolution dfs
 
Crestron Quickpacks - K-12 Classroom
Crestron Quickpacks - K-12 ClassroomCrestron Quickpacks - K-12 Classroom
Crestron Quickpacks - K-12 Classroom
 
Opening gCS
Opening gCSOpening gCS
Opening gCS
 
General Lew Wallace & His Study
General Lew Wallace & His StudyGeneral Lew Wallace & His Study
General Lew Wallace & His Study
 
enchant js workshop on Calpoly
enchant js workshop  on Calpolyenchant js workshop  on Calpoly
enchant js workshop on Calpoly
 
Beginning gl.enchant
Beginning gl.enchantBeginning gl.enchant
Beginning gl.enchant
 
Three dimensional space dfs
Three dimensional space dfsThree dimensional space dfs
Three dimensional space dfs
 
Código das equipes atualizado
Código das equipes atualizadoCódigo das equipes atualizado
Código das equipes atualizado
 
Taylor Cutrer
Taylor CutrerTaylor Cutrer
Taylor Cutrer
 
ömer ismihan 20060450
ömer ismihan 20060450ömer ismihan 20060450
ömer ismihan 20060450
 
Sin título 1
Sin título 1Sin título 1
Sin título 1
 
Freelance Translator 2.0
Freelance Translator 2.0Freelance Translator 2.0
Freelance Translator 2.0
 
Семинар "Аудит сайта презентация" компания ИМТ FriendsTime
Семинар "Аудит сайта презентация" компания ИМТ FriendsTimeСеминар "Аудит сайта презентация" компания ИМТ FriendsTime
Семинар "Аудит сайта презентация" компания ИМТ FriendsTime
 
Amber’s final magazine
Amber’s  final magazine Amber’s  final magazine
Amber’s final magazine
 
Amber's evaluation
Amber's evaluationAmber's evaluation
Amber's evaluation
 
Detoxifying your body dfs
Detoxifying your body dfsDetoxifying your body dfs
Detoxifying your body dfs
 
Recruitment Process Outsourcing
Recruitment Process OutsourcingRecruitment Process Outsourcing
Recruitment Process Outsourcing
 
my first ppt
my first pptmy first ppt
my first ppt
 
Taylor Smith
Taylor SmithTaylor Smith
Taylor Smith
 

Similar to Derivatives in graphing-dfs

Application of derivatives
Application of derivativesApplication of derivatives
Application of derivatives
indu thakur
 
Lecture 12(point of inflection and concavity)
Lecture 12(point of inflection and concavity)Lecture 12(point of inflection and concavity)
Lecture 12(point of inflection and concavity)
FahadYaqoob5
 
0.5.derivatives
0.5.derivatives0.5.derivatives
0.5.derivatives
m2699
 
SECTION 7.3 word.docx
SECTION 7.3 word.docxSECTION 7.3 word.docx
SECTION 7.3 word.docx
LMinhTm26
 
maxima & Minima thoeyr&solved.Module-4pdf
maxima & Minima thoeyr&solved.Module-4pdfmaxima & Minima thoeyr&solved.Module-4pdf
maxima & Minima thoeyr&solved.Module-4pdf
RajuSingh806014
 
extremevaluesofafunctionapplicationsofderivative-130905112534-.pdf
extremevaluesofafunctionapplicationsofderivative-130905112534-.pdfextremevaluesofafunctionapplicationsofderivative-130905112534-.pdf
extremevaluesofafunctionapplicationsofderivative-130905112534-.pdf
Waqas Mehmood
 
Chapter 4 review
Chapter 4 reviewChapter 4 review
Chapter 4 review
gregcross22
 

Similar to Derivatives in graphing-dfs (20)

Application of derivatives
Application of derivativesApplication of derivatives
Application of derivatives
 
Lecture 12(point of inflection and concavity)
Lecture 12(point of inflection and concavity)Lecture 12(point of inflection and concavity)
Lecture 12(point of inflection and concavity)
 
Application of derivative
Application of derivativeApplication of derivative
Application of derivative
 
Day 1a examples
Day 1a examplesDay 1a examples
Day 1a examples
 
Calc 3.4
Calc 3.4Calc 3.4
Calc 3.4
 
0.5.derivatives
0.5.derivatives0.5.derivatives
0.5.derivatives
 
SECTION 7.3 word.docx
SECTION 7.3 word.docxSECTION 7.3 word.docx
SECTION 7.3 word.docx
 
maxima & Minima thoeyr&solved.Module-4pdf
maxima & Minima thoeyr&solved.Module-4pdfmaxima & Minima thoeyr&solved.Module-4pdf
maxima & Minima thoeyr&solved.Module-4pdf
 
extremevaluesofafunctionapplicationsofderivative-130905112534-.pdf
extremevaluesofafunctionapplicationsofderivative-130905112534-.pdfextremevaluesofafunctionapplicationsofderivative-130905112534-.pdf
extremevaluesofafunctionapplicationsofderivative-130905112534-.pdf
 
Extreme values of a function & applications of derivative
Extreme values of a function & applications of derivativeExtreme values of a function & applications of derivative
Extreme values of a function & applications of derivative
 
Curve sketching
Curve sketchingCurve sketching
Curve sketching
 
Manyformulas
ManyformulasManyformulas
Manyformulas
 
Introductory maths analysis chapter 13 official
Introductory maths analysis   chapter 13 officialIntroductory maths analysis   chapter 13 official
Introductory maths analysis chapter 13 official
 
Chapter13 curvesketching-151007042831-lva1-app6891
Chapter13 curvesketching-151007042831-lva1-app6891Chapter13 curvesketching-151007042831-lva1-app6891
Chapter13 curvesketching-151007042831-lva1-app6891
 
Chapter 13 - Curve Sketching
Chapter 13 - Curve SketchingChapter 13 - Curve Sketching
Chapter 13 - Curve Sketching
 
Chapter 4 review
Chapter 4 reviewChapter 4 review
Chapter 4 review
 
Applying the derivative
Applying the derivativeApplying the derivative
Applying the derivative
 
Unit 1.2
Unit 1.2Unit 1.2
Unit 1.2
 
Mac2311 study guide-tcm6-49721
Mac2311 study guide-tcm6-49721Mac2311 study guide-tcm6-49721
Mac2311 study guide-tcm6-49721
 
Maxima & Minima
Maxima & MinimaMaxima & Minima
Maxima & Minima
 

More from Farhana Shaheen

More from Farhana Shaheen (20)

INTRODUCTION TO PROBABILITY.pptx
INTRODUCTION TO   PROBABILITY.pptxINTRODUCTION TO   PROBABILITY.pptx
INTRODUCTION TO PROBABILITY.pptx
 
Quadratic Functions.pptx
Quadratic Functions.pptxQuadratic Functions.pptx
Quadratic Functions.pptx
 
All About Functions- For a Layman.pptx
All About Functions- For a Layman.pptxAll About Functions- For a Layman.pptx
All About Functions- For a Layman.pptx
 
Geometrical transformation reflections
Geometrical transformation reflectionsGeometrical transformation reflections
Geometrical transformation reflections
 
Geometrical transformation
Geometrical transformationGeometrical transformation
Geometrical transformation
 
Sets and venn diagrams
Sets and venn diagramsSets and venn diagrams
Sets and venn diagrams
 
Polygons i-triangles-dfs
Polygons i-triangles-dfsPolygons i-triangles-dfs
Polygons i-triangles-dfs
 
One to one and onto lt 1.9 dfs
One to one and onto lt 1.9 dfsOne to one and onto lt 1.9 dfs
One to one and onto lt 1.9 dfs
 
Matrix of linear transformation 1.9-dfs
Matrix of linear transformation 1.9-dfsMatrix of linear transformation 1.9-dfs
Matrix of linear transformation 1.9-dfs
 
A Journey to Pakistan - Dr. Farhana Shaheen
A Journey to  Pakistan - Dr. Farhana ShaheenA Journey to  Pakistan - Dr. Farhana Shaheen
A Journey to Pakistan - Dr. Farhana Shaheen
 
Exploring the world of mathematics kust
Exploring the world of mathematics kustExploring the world of mathematics kust
Exploring the world of mathematics kust
 
3.1.2 Linear Equations in one Variable dfs
3.1.2 Linear Equations in one Variable dfs3.1.2 Linear Equations in one Variable dfs
3.1.2 Linear Equations in one Variable dfs
 
Fractions Dr. Farhana Shaheen
Fractions Dr. Farhana ShaheenFractions Dr. Farhana Shaheen
Fractions Dr. Farhana Shaheen
 
1.2 subsets of integers dfs
1.2 subsets of integers dfs1.2 subsets of integers dfs
1.2 subsets of integers dfs
 
Fractions, percentages, decimals
Fractions, percentages, decimalsFractions, percentages, decimals
Fractions, percentages, decimals
 
1.1 real number system dfs
1.1 real number system dfs1.1 real number system dfs
1.1 real number system dfs
 
Significance of Numbers in life Dr. Farhana Shaheen
Significance of Numbers in life Dr. Farhana ShaheenSignificance of Numbers in life Dr. Farhana Shaheen
Significance of Numbers in life Dr. Farhana Shaheen
 
Exploring the world of mathematics Dr. Farhana Shaheen
Exploring the world of mathematics Dr. Farhana ShaheenExploring the world of mathematics Dr. Farhana Shaheen
Exploring the world of mathematics Dr. Farhana Shaheen
 
Maths study skills dfs-edc
Maths study skills dfs-edcMaths study skills dfs-edc
Maths study skills dfs-edc
 
Mean median mode_range
Mean median mode_rangeMean median mode_range
Mean median mode_range
 

Recently uploaded

The basics of sentences session 3pptx.pptx
The basics of sentences session 3pptx.pptxThe basics of sentences session 3pptx.pptx
The basics of sentences session 3pptx.pptx
heathfieldcps1
 

Recently uploaded (20)

Holdier Curriculum Vitae (April 2024).pdf
Holdier Curriculum Vitae (April 2024).pdfHoldier Curriculum Vitae (April 2024).pdf
Holdier Curriculum Vitae (April 2024).pdf
 
ICT Role in 21st Century Education & its Challenges.pptx
ICT Role in 21st Century Education & its Challenges.pptxICT Role in 21st Century Education & its Challenges.pptx
ICT Role in 21st Century Education & its Challenges.pptx
 
Micro-Scholarship, What it is, How can it help me.pdf
Micro-Scholarship, What it is, How can it help me.pdfMicro-Scholarship, What it is, How can it help me.pdf
Micro-Scholarship, What it is, How can it help me.pdf
 
2024-NATIONAL-LEARNING-CAMP-AND-OTHER.pptx
2024-NATIONAL-LEARNING-CAMP-AND-OTHER.pptx2024-NATIONAL-LEARNING-CAMP-AND-OTHER.pptx
2024-NATIONAL-LEARNING-CAMP-AND-OTHER.pptx
 
Key note speaker Neum_Admir Softic_ENG.pdf
Key note speaker Neum_Admir Softic_ENG.pdfKey note speaker Neum_Admir Softic_ENG.pdf
Key note speaker Neum_Admir Softic_ENG.pdf
 
ICT role in 21st century education and it's challenges.
ICT role in 21st century education and it's challenges.ICT role in 21st century education and it's challenges.
ICT role in 21st century education and it's challenges.
 
On National Teacher Day, meet the 2024-25 Kenan Fellows
On National Teacher Day, meet the 2024-25 Kenan FellowsOn National Teacher Day, meet the 2024-25 Kenan Fellows
On National Teacher Day, meet the 2024-25 Kenan Fellows
 
Presentation by Andreas Schleicher Tackling the School Absenteeism Crisis 30 ...
Presentation by Andreas Schleicher Tackling the School Absenteeism Crisis 30 ...Presentation by Andreas Schleicher Tackling the School Absenteeism Crisis 30 ...
Presentation by Andreas Schleicher Tackling the School Absenteeism Crisis 30 ...
 
psychiatric nursing HISTORY COLLECTION .docx
psychiatric  nursing HISTORY  COLLECTION  .docxpsychiatric  nursing HISTORY  COLLECTION  .docx
psychiatric nursing HISTORY COLLECTION .docx
 
The basics of sentences session 3pptx.pptx
The basics of sentences session 3pptx.pptxThe basics of sentences session 3pptx.pptx
The basics of sentences session 3pptx.pptx
 
Measures of Dispersion and Variability: Range, QD, AD and SD
Measures of Dispersion and Variability: Range, QD, AD and SDMeasures of Dispersion and Variability: Range, QD, AD and SD
Measures of Dispersion and Variability: Range, QD, AD and SD
 
Python Notes for mca i year students osmania university.docx
Python Notes for mca i year students osmania university.docxPython Notes for mca i year students osmania university.docx
Python Notes for mca i year students osmania university.docx
 
Z Score,T Score, Percential Rank and Box Plot Graph
Z Score,T Score, Percential Rank and Box Plot GraphZ Score,T Score, Percential Rank and Box Plot Graph
Z Score,T Score, Percential Rank and Box Plot Graph
 
PROCESS RECORDING FORMAT.docx
PROCESS      RECORDING        FORMAT.docxPROCESS      RECORDING        FORMAT.docx
PROCESS RECORDING FORMAT.docx
 
Mehran University Newsletter Vol-X, Issue-I, 2024
Mehran University Newsletter Vol-X, Issue-I, 2024Mehran University Newsletter Vol-X, Issue-I, 2024
Mehran University Newsletter Vol-X, Issue-I, 2024
 
This PowerPoint helps students to consider the concept of infinity.
This PowerPoint helps students to consider the concept of infinity.This PowerPoint helps students to consider the concept of infinity.
This PowerPoint helps students to consider the concept of infinity.
 
Role Of Transgenic Animal In Target Validation-1.pptx
Role Of Transgenic Animal In Target Validation-1.pptxRole Of Transgenic Animal In Target Validation-1.pptx
Role Of Transgenic Animal In Target Validation-1.pptx
 
TỔNG ÔN TẬP THI VÀO LỚP 10 MÔN TIẾNG ANH NĂM HỌC 2023 - 2024 CÓ ĐÁP ÁN (NGỮ Â...
TỔNG ÔN TẬP THI VÀO LỚP 10 MÔN TIẾNG ANH NĂM HỌC 2023 - 2024 CÓ ĐÁP ÁN (NGỮ Â...TỔNG ÔN TẬP THI VÀO LỚP 10 MÔN TIẾNG ANH NĂM HỌC 2023 - 2024 CÓ ĐÁP ÁN (NGỮ Â...
TỔNG ÔN TẬP THI VÀO LỚP 10 MÔN TIẾNG ANH NĂM HỌC 2023 - 2024 CÓ ĐÁP ÁN (NGỮ Â...
 
Class 11th Physics NEET formula sheet pdf
Class 11th Physics NEET formula sheet pdfClass 11th Physics NEET formula sheet pdf
Class 11th Physics NEET formula sheet pdf
 
Unit-IV- Pharma. Marketing Channels.pptx
Unit-IV- Pharma. Marketing Channels.pptxUnit-IV- Pharma. Marketing Channels.pptx
Unit-IV- Pharma. Marketing Channels.pptx
 

Derivatives in graphing-dfs

  • 2. Watch this!  https://www.khanacademy.org/partner- content/pixar/start/introduction/v/pipeline-video  https://www.khanacademy.org/partner- content/pixar/environment-modeling-2/mathematics- of-parabolas2-ver2/a/parabolas-lesson-brief  https://www.khanacademy.org/partner- content/pixar/environment-modeling-2/animating- parabolas-ver2/v/overview-parabolic-arcs  https://www.khanacademy.org/partner- content/pixar/environment-modeling-2/animating- parabolas-ver2/v/environment-modeling2
  • 3.
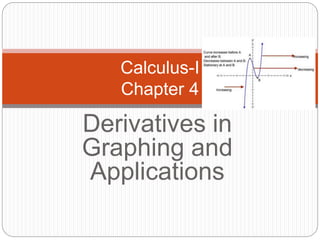
  • 4. 4.1 Analysis of Functions- I (PG:232)  Increase, Decrease and Concavity
  • 5. Remember-  To find Increasing/Decreasing functions, always Read from Left to Right-
  • 6.
  • 7. 4.2 Analysis of Functions-II (pg:244)  Relative Extrema;  Graphing Polynomial
  • 8. Slope of a Tangent line dy/dx Rate of change and slope
  • 9.  Secant line = Average Rate of Change = Slope 
  • 10.  A tangent line is a straight line that touches a function at only one point. (See above.) The tangent line represents the instantaneous rate of change of the function at that one point. The slope of the tangent line at a point on the function is equal to the derivative of the function at the same point (See below.) 
  • 11.  In this first animation we see the secant line become the tangent line i.e we go from the Average Rate of Change to the Instantaneous Rate of Change by letting the interval over which the Average Rate of Change is measured go to zero.
  • 12.  Secant line Tangent Line
  • 13.  Tangent Line = Instantaneous Rate of Change = Derivative
  • 14. Finding SLOPE of a line  Have you ever heard of Mr. SLOPE GUY?
  • 15. Mnemonics- Example: To find slopes  For horizontal lines:  Slope=0  Z for zero  For vertical lines:  Slope is undefined  N for No slope
  • 16. Memorizing the formulas:  Use- Pascal’s Triangle
  • 17. Increasing and Decreasing Functions  Definition: 4.1.1 (pg: 233) .sin)(),()( 2121 functiongincreaanisxfthenxfxfimpliesxxIf  .sin)(),()( 2121 functiongdecreaaisxfthenxfxfimpliesxxIf 
  • 18. Increasing and Decreasing Functions  Theorem 4.1.2 (pg:233)  Let f be a function that is continuous on a closed interval [a, b] and differentiable on the open interval (a, b). (a) If f’(x) > 0 for every x in (a, b), then f is increasing on (a,b) (b) If f’(x) < 0 for every x in (a, b), then f is decreasing on (a,b) (c) If f’(x) = 0 for every x in (a, b), then f is constant on (a,b)
  • 20.
  • 21. Example Use the graph below to make a conjecture about the intervals on which f is increasing or decreasing. 21243)( 234  xxxxf is decreasing if 2f x   is increasing if -2 0f x  is decreasing if 0 1f x  is increasing if 1f x 
  • 22. Use increasing/decreasing test to verify your conjecture. 21243)( 234  xxxxf xxxxf 241212)( 23/  )1)(2(12)(/  xxxxf -2 0 1 - - - - - + + + - - - - + + + Increasing: Decreasing:
  • 23.
  • 24. Continuous function  Find the intervals on which the function f(x) is increasing and where it is decreasing.
  • 25.  Find the intervals on which the function f(x) is increasing and where it is decreasing.
  • 26. 4.2 CRITICAL POINTS (pg:245)  Critical Values: The x-values at which the f ‘(x)=0 or f ‘(x) fails to exist.  Note: 1. The x-values at which the f ‘(x)=0 are called Stationary Points.  Note: The critical values are the points where the graph will switch from increasing to decreasing or vice versa.  Find the critical points for the following functions: Examples: 1.f(x) = 3x2 – 6x + 3 2. f(x) = x3/2 – 3x + 7 x = 1 x = 4
  • 27. Finding points where horizontal tangents to a curve occur
  • 28. 4.2 Exp: 3 (pg:245)  Find all critical points of 3/23/5 153)( xxxf 
  • 29. Qs: 7 -14 Ex: 4.2 (pg: 252)  Locate the critical points and identify which critical points are stationary points.  Qs: 8  Qs: 9 x12x3)x(f 4  3x 1x )x(f 2   
  • 30. Key Topics  Relative maximum: the highest value for f(x) at that particular “peak” in the graph  Relative minimum: the lowest value for f(x) at that particular “valley” in the graph Relative maximum Relative maximum Relative minimum Relative minimum Relative minimum
  • 31. Key Topics  How to determine whether it is a relative maximum or a relative minimum at a focal point: Step 1: Find the points of the graph to determine the intervals on which f(x) is increasing or decreasing Step 2: Choose an x-value in each interval to determine whether the function is increasing or decreasing within that interval Step 3: If f(x) switches from increasing to decreasing at a critical point, there is a relative maximum at that critical point If f(x) switches from decreasing to increasing at a critical point, there is a relative minimum at that critical point.
  • 32. Key Topics  It might help to make a number line displaying your findings - - - | +++++++ | - - - - | +++++++ | - - - - - - - | +++ - to + means minimum + to - means maximum
  • 33. First derivative test to check for maximum and minimum points  Let f be a twice differentiable function.  Find f’(x), and put it equal to zero. Find the critical points.  Take test points, to check if f’(x) > 0 or < 0, for increasing and decreasing function..  If f ‘(x) changes sign from + to -, then x = c has a maximum value, and if f changes sign from - to +, then x = c has a minimum value.  If f’(x) remains positive, then f is an increasing function, and if it remains negative, it is a deceasing function.
  • 35. Exp: 5 (pg: 248) Interval Test values Sign of f’(x) Conclusion Find the Relative Extrema of . Hint: First find critical points using f’(x)=0. Then find intervals where the function is inc/dec. Let’s make a table: 35 x5x3)x(f 
  • 36. 4.1 Concavity- Up and Down (pg:235) CONCAVE UP CONCAVE DOWN  A function f is concave up on an open interval if its tangent lines have increasing slopes on that interval.  In this case, the graph of f lies above its tangent lines.  A function f is concave down on an open interval if its tangent lines have decreasing slopes on that interval.  In this case, the graph of f lies below its tangent lines.
  • 37. concave up: f’ is increasing. tangent lines are below the graph. concave down: f’ is decreasing. tangent lines are above the graph.
  • 40. To determine the concavity of a function using second derivative Concave upward Concave downward Think of some examples …
  • 41. Finding Concavity  Theorem 4.1.4 (pg:235)  Let f be a function which is twice differentiable on an open interval (a, b). (a) If f”(x) > 0 for every x in (a, b), then f is concave up on (a,b) (b) If f”(x) < 0 for every x in (a, b), then f is concave down on (a,b)
  • 42. 4.1 Inflection Points (pg:236) If f is continuous on an open interval containing a value x = d, and if f changes the direction of its concavity at the point (d, f(d)), then f has an inflection point at x = d.
  • 43. Inflection Point To find inflection points, find any point, c, in the domain where ( ) 0 or ( )f x f x  changes sign from the left to the right of c, is undefined. f If Then (c, f(c)) is an inflection point of f.
  • 44. Find point of inflection.
  • 45. Concavity Test for concavity Find the second derivative. Put f ”(x) = 0 (to find points of inflection). Take test points. a) If for every value of x in I, then f is concave up on I. b) If for every value of x in I, then f is concave down on I. 0)(// xf ( ) 0f x 
  • 46. Second derivative test to check for Concavity, and point of inflection  Let f be a twice differentiable function.  Find f”(x), and put it equal to zero. Find the points of inflection x= a.  Take test points, to check if f”(a) > 0 for concave up or f”(a) < 0, for concave down.  Note: Find f”(x); is undefined, gives points of inflection. ( ) 0 or ( )f x f x 
  • 47. Example Given , find the intervals on which f is increasing/decreasing and concave up/down. Locate all points of inflection. 13)( 23  xxxf Solution 13)( 23  xxxf 2 ( ) 3 6f x x x     3 2x x  ( ) 0f x  at x = 0 and at x = 2 0 2  + ++ - - - + ++ Increasing: (-∞, 0) U (2, ∞) Decreasing: (0, 2)
  • 48. Sign analysis of  1  , 1  1,  This will tell us where it is concave up and down: ¢¢f x( )= 6x -6 f “(x) = 0 at x = 1 - - - + ++ Concave Up: Concave Down:
  • 49. Questions: Find the interval where f is increasing/decreasing/concave up/concave down/ point of inflections, if any.  Q:1  Q: 2  Q: 3  Q:4 34)( 2  xxxf x exxf   )1()( 3 )( xxf  3/1 x3x2)x(f 
  • 50. 4.2 Second Derivative Test: (pg:247)
  • 51. 4.2 Second Derivative Test: (pg:247)  Suppose f is twice differentiable at the point x = c.  (i) If f ’(x) = o and f “(x) > 0, then f has a relative minimum at x = c.  (ii) If f ’(x) = o and f “(x) < 0, then f has a relative maximum at x = c.  (iii) If f ’(x) = o and f “(x) = 0, then the test is inconclusive; that is, f may have a relative maximum, a relative minimum, or neither at x = c.
  • 52. Exp: Find the relative extrema using second derivative test: f”(x)< 0 ---Max and f”(x)> 0 --- Min Interval Test values Sign of f”(x) Conclusion 3/22 )4()(  xxf
  • 53. Test for Concavity 1. If f”(x) > 0 for all x in I, then f is concave up. 2. If f”(x) < 0 for all x in I, then f is concave down. 2nd Derivative Test (Use C.pts. of 1st Derivative) 1. If f”(c) > 0, then f(c) is a relative min. 2. If f”(c) < 0, then f(c) is a relative max. 3. If f”(c) = 0, then the test fails. No min. or max.
  • 54. 9 -9 -16 -27 Ex. 2 Determine where f(x) = x4 – 4x3 is increasing, decreasing, has max’s or min’s, is concave up or down, has inflection points.
  • 55. Ques: 54 Ex:4.2 (pg: 253)  Draw the graph of the polynomial, and label the coordinates of the intercepts, stationary points, and inflection points.  Check your work with a graphing utility (Desmos). 32 xx2x2)x(f 
  • 56. For Graphing the function:  Collect all the information :  1. Critical points: f '(x) = 0.  2. Increasing / Decreasing intervals;  3. Points of inflection: f"(x) = 0  4. Concavity: up/down  5. End behaviour: Limits as x tends to plus / minus infinity ( )  6. x- intercepts (put y = 0) and y intercepts  xorx 32 xx2x2)x(f 
  • 57. Ex. 1 Determine where f(x) = 6(x2 + 3)-1 is increasing, decreasing, has max’s or min’s, is concave up or down, has inflection points. f’(x) = -6(x2 + 3)-2(2x)  22 3 12    x x C.point x= 0 0 +    . 0, inc    . ,0 dec  1st der. test (0,2) max.
  • 58. f '(x)  12x x2  3  2 f "(x)  x2  3  2 12  12x  2  x2  3 2x  x2  3  4 f "(x)  12  x2  3  x2  3  4x2   x2  3  4   12  x2  3 3x2  3  x2  3  4  36 x2 1  x2  3  3 C.N.’s -1, 1 -1 1  concave up  down  up  1,  1,1  ,1 Inflection points (-1, ) (1, )2 3 2 3
  • 59. 2nd Derivative Test Plug C.N.’s of 1st der. into 2nd derivative. C.N. from 1st der. was 0.    32 2 3 136 )("    x x xf  0)0("f 0 is a maximum Remember, a neg. in the 2nd der. means concave down. Therefore, the point is a maximum.
  • 60. (0,2) max (-1, 3/2) Inf. pt. (1, 3/2) Inf. pt. There are no x-intercepts
  • 61. 4.3 Graphs of Rational functions: (pg:254)  Properties of Graphs:  1. Symmetries (replace x by -x and y by -y)  2. x- intercepts (put y = 0) and y- intercepts (put x = 0)  3. Relative extrema (maxima and minima)  4. Concavity (up or down)  5. Intervals of increase and decrease ( )  6. Inflection points (Put and take test points)  7. Asymptotes (Horizontal: Take limit as )  (Vertical: Put denominator = 0, after factoring and cancellation)  8. End behavior as 0)x(for0)x(f  0)x(f   xorx
  • 62. Example: pg:255  Sketch a graph of    (Then check and confirm on Desmos) 16x 8x2 y 2 2   
  • 63. x x 40 2x- ( )40 2A x x= - 2 40 2A x x= - 40 4A x¢ = - 0 40 4x= - 4 40x = 10x = ( )10 40 2 10A = - × ( )10 20A = 2 200 ftA = 40 2l x= - w x= 10 ftw = 20 ftl = A Classic Problem You have 40 feet of fence to enclose a rectangular garden along the side of a barn. What is the maximum area that you can enclose? Example 1
  • 64. What dimensions for a one liter cylindrical can will use the least amount of material? (Least amount of surface area) We can minimize the material by minimizing the surface a 2 2 2A r rhp p= + area of ends lateral area We need another equation that relates r and h: 2 V r hp= ( )3 1 L 1000 cm= 2 1000 r hp= 2 1000 h rp = 2 2 10 0 2 0 2A r r rp p p= + × 2 2000 2A r r p= + ¢A = 4pr - 2000 r2 = 0 Example 2 Now plug in for “h” 2 2000 4 r r p= 3 500 r p = 5.42 cmr » ( ) 2 1000 5.42 h p » 10.83 cmh »
  • 65. Area and Perimeter – Example Find the dimensions of a rectangular area of 225 square meters that has the least perimeter. Drawing a figure might help. l w A = l · w = 225 P = 2 · l + 2 · w From the area equation solve for l and substitute w 225 l  P = 2 · l + 2 · w = w2 w 450  P'(w) = 2w2 - 450 w2 = 2(w -15)(w +15) w2 = 0 There is a critical value at 15 and -15 So w = 15 meters, and l = 15 meters (square area) Perimeter = 60 m
  • 66. Maximizing Revenue and Profit A company manufactures and sells x television sets per month. The monthly cost and price-demand equations are: R (x) = xp = C (x) = 60,000 + 60x and p = 200 – x/50 a. Find the maximum revenue. Maximum at R’(x) = 0 50 200 2 x x  R ‘ (x) = 25 200 x  x = 5,000 R(5000) = $500,000
  • 67. Application #1 continued P (x) = b. Find the maximum profit, the production level that will realize the maximum profit, and the price the company should charge for each television set. P ‘ (x) has a critical value at x = 000,60140 50 2   x x P (3500) = p (3500) = C (x) = 60,000 + 60x and p = 200 – x/50 P ‘ (x) = - x 25 +140 = 0 3500. $185,000 $130 per TV. 50 200 2 x x R (x) = P(x)= R(x)-C(x) P(x) = 200x - x2 50 æ è ç ö ø ÷- 60000+60x( )