SlideShare une entreprise Scribd logo
1  sur  7
Télécharger pour lire hors ligne
PROGRESS ENERGY, INC.
                                          UNAUDITED CONSOLIDATED INTERIM FINANCIAL INFORMATION


STATEMENTS OF INCOME
                                                                                    Three Months Ended                         Six Months Ended
                                                                                              June 30                                  June 30
(In thousands except per share amounts)                                             2001                    2000           2001                   2000
Operating Revenues
 Electric                                                                    $       1,565,947          $   773,914    $   3,197,994       $      1,555,300
 Natural gas                                                                            68,575               75,350          207,149                147,448
 Diversified businesses                                                                681,121               38,484          818,591                 63,618
   Total Operating Revenues                                                          2,315,643              887,748        4,223,734              1,766,366

Operating Expenses
 Fuel used in electric generation                                                     378,288               137,001         748,144                297,388
 Purchased power                                                                      211,876                85,067         429,424                155,326
 Gas purchased for resale                                                              57,184                59,836         166,778                103,734
 Other operation and maintenance                                                      304,400               164,989         599,497                363,216
 Depreciation and amortization                                                        264,131               136,949         580,920                274,720
 Taxes other than on income                                                            93,945                35,511         193,592                 72,845
 Diversified businesses                                                               721,744                58,767         911,447                102,922
   Total Operating Expenses                                                          2,031,568              678,120        3,629,802              1,370,151

Operating Income                                                                      284,075               209,628         593,932                396,215

Other Income (Expense)
 Interest income                                                                         7,172                2,048           17,114                 5,311
 Other, net                                                                            (13,102)                (975)         (10,180)                1,101

   Total Other Income (Expense)                                                            (5,930)            1,073           6,934                  6,412

Income before Interest Charges and Income Taxes                                       278,145               210,701         600,866                402,627

Interest Charges
 Long-term debt                                                                       156,063                54,851         282,506                104,923
 Other interest charges                                                                37,950                 4,279          74,652                  9,280
 Allowance for borrowed funds used during construction                                 (1,873)               (6,323)         (5,353)               (10,929)

   Net Interest Charges                                                               192,140                52,807         351,805                103,274
Income before Income Taxes                                                             86,005               157,894         249,061                299,353
Income Taxes                                                                          (25,697)               50,434         (16,644)               106,632
Net Income                                                                   $        111,702           $   107,460         265,705                192,721

Average Common Shares Outstanding                                                     200,043               153,311         199,922                153,183
Basic Earnings per Common Share                                              $           0.56           $      0.70    $       1.33        $          1.26
Diluted Earnings per Common Share                                            $           0.56           $      0.70    $       1.32        $          1.26
Dividends Declared per Common Share                                          $          0.530           $     0.515    $      1.060        $         1.030


This financial information should be read in conjunction with the Company's 2000 Annual Report to shareholders. These
statements have been prepared for the purpose of providing information concerning the Company and not in connection
with any sale, offer for sale, or solicitation of an offer to buy any securities.
Progress Energy, Inc.
BALANCE SHEETS                                                                          June 30           December 31
(In thousands)                                                                           2001                2000

                                            ASSETS

Utility Plant
 Electric utility plant in service                                                  $   18,716,993    $      18,124,036
 Gas utility plant in service                                                              483,538              378,464
 Accumulated depreciation                                                               (9,761,687)          (9,350,172)
      Utility plant in service, net                                                      9,438,844            9,152,328
 Held for future use                                                                        15,380               16,302
 Construction work in progress                                                             851,412            1,043,376
 Nuclear fuel, net of amortization                                                         243,816              224,692
    Total Utility Plant, Net                                                            10,549,452           10,436,698

Current Assets
 Cash and cash equivalents                                                                  73,667             101,296
 Accounts receivable                                                                       992,059             925,911
 Taxes receivable                                                                           13,220                   -
 Inventory                                                                                 771,479             420,985
 Deferred fuel cost                                                                        214,021             217,806
 Prepayments                                                                                17,304              50,040
 Assets Held for Sale, net                                                                  58,504             747,745
 Other current assets                                                                      178,707             192,347
     Total Current Assets                                                                2,318,961            2,656,130

Deferred Debits and Other Assets
 Income taxes recoverable through future rates                                             238,876              228,686
 Harris Plant deferred costs                                                                38,796               44,813
 Unamortized debt expense                                                                   39,597               38,771
 Nuclear decommissioning trust funds                                                       824,854              811,998
 Diversified business property, net                                                      1,074,653              720,231
 Miscellaneous other property and investments                                              608,170              636,677
 Deferred purchased power contract termination costs                                       148,757              226,656
 Goodwill, net                                                                           3,723,868            3,652,429
 Other assets and deferred debits                                                          669,705              657,612
     Total Deferred Debits and Other Assets                                              7,367,276            7,017,873
     Total Assets                                                                   $   20,235,689    $      20,110,701

                            CAPITALIZATION AND LIABILITIES

Capitalization
 Common stock equity                                                                $    5,459,040    $       5,424,201
 Preferred stock of subsidiary - redemption not required                                    92,831               92,831
 Long-term debt, net                                                                     9,413,639            5,890,099
     Total Capitalization                                                               14,965,510           11,407,131

Current Liabilities
 Current portion of long-term debt                                                         209,550              184,037
 Accounts payable                                                                          618,098              828,568
 Taxes accrued                                                                                   -                  932
 Interest accrued                                                                          204,670              121,433
 Dividends declared                                                                        107,886              107,645
 Short-term Obligations                                                                    744,458            3,972,674
 Other current liabilities                                                                 571,052              447,370
     Total Current Liabilities                                                           2,455,714            5,662,659

Deferred Credits and Other Liabilities
 Accumulated deferred income taxes                                                       1,680,446            1,807,192
 Accumulated deferred investment tax credits                                               236,051              261,255
 Other liabilities and deferred credits                                                    897,968              972,464
     Total Deferred Credits and Other Liabilities                                        2,814,465            3,040,911

     Total Capitalization and Liabilities                                           $   20,235,689    $      20,110,701

SCHEDULES OF COMMON STOCK EQUITY
(In thousands)
  Common stock (without par value, authorized 500,000,000, issued and outstanding   $    3,614,279    $       3,608,902
                  206,089,274 and 206,089,047 shares, respectively)
  Unearned ESOP common stock                                                              (117,268)            (127,211)
  Accumulated other comprehensive loss                                                     (34,214)                   -
  Retained earnings                                                                      1,996,243            1,942,510

     Total Common Stock Equity                                                      $    5,459,040    $       5,424,201
Progress Energy, Inc.
SUPPLEMENTAL DATA                                                  Three Months Ended                      Six Months Ended
                                                                               June 30                               June 30
                                                                   2001                  2000            2001                  2000
Operating Revenues (in thousands)
Electric
 Retail                                                    $       1,295,650       $     597,702         2,622,453 $       1,232,471
 Wholesale                                                           214,908             133,725           475,555           265,600
 Unbilled                                                             15,099              25,029           (46,780)           24,221
 Miscellaneous revenue                                                40,290              17,458           146,766            33,008
       Total Electric                                              1,565,947             773,914         3,197,994         1,555,300
 Natural gas                                                          68,575              75,350           207,149           147,448
 Diversified businesses                                              681,121              38,484           818,591            63,618
       Total Operating Revenues                                $   2,315,643       $     887,748         4,223,734    $    1,766,366

Energy Sales
Electric (millions of kWh)
  Retail
   Residential                                                        7,204                3,023           15,926                6,951
   Commercial                                                         5,682                2,803           10,956                5,359
   Industrial                                                         4,401                3,676            8,594                7,077
   Other retail                                                       1,007                  323            1,970                  663
     Total Retail                                                    18,294                9,825           37,446               20,050
  Unbilled                                                              624                  425             (543)                 361
  Wholesale                                                           4,080                3,287            8,859                7,004
       Total Electric                                                22,998               13,537           45,762               27,415

Natural Gas (thousands of dt)                                        11,096               13,497           25,942               30,841

Energy Supply (millions of kWh)
 Generated - steam                                                   11,877                6,885           23,791               14,345
             nuclear                                                  6,813                5,433           13,950               11,097
             hydro                                                       64                  157              117                  333
             combustion turbines                                      1,672                  282            2,809                  316
 Purchased                                                            3,711                1,299            7,385                2,331
      Total Energy Supply (Company Share)                            24,137               14,056           48,052               28,422

Detail of Income Taxes (in thousands)
  Income tax expense (credit) - current                        $      (6,730)      $       73,099           28,475 $           162,936
                                 deferred                            (12,723)             (20,066)         (31,904)            (51,106)
                                 investment tax credit                (6,244)              (2,599)         (13,215)             (5,198)
          Total Income Tax Expense                             $     (25,697)      $       50,434          (16,644) $          106,632

FINANCIAL STATISTICS
Ratio of earnings to fixed charges                                                                           2.16                 3.98
Return on average common stock equity                                                                       11.95 %              12.27
Book value per common share                                                                          $      27.28 $              22.57
Capitalization ratios
  Common stock equity                                                                                       36.48 %              52.40
  Preferred stock of subsidiary- redemption not required                                                     0.62                 0.90
  Long-term debt, net                                                                                       62.90                46.70
       Total                                                                                               100.00 %             100.00
Progress Energy, Inc.
                                                                   Segment Earnings Variance Analysis
                                                                     Year to Date June 2001 vs. 2000

                                                                  Florida           Regulated                                     Other
($ Per share)                           CP&L                      Power               Natural              Energy               Diversified           Corporate           Consolidated
                                      (Electric)                 (Electric)             Gas               Ventures              Businesses
2000 earnings                                1.10                       -                   0.06                  0.27                 (0.17)                                     1.26
Weather                                        -                                                                                                                                   -
Customer growth and usage                      -                                                                                                                                   -
Other margin                                   -                                           (0.03)                                                                                 (0.03)


Addition of FPC operations                                             0.72                                       0.38                 (0.07)              (0.15)                 0.88
                                                                              (C)                                                                                   (E)

O&M                                          0.07                                          (0.02)                                                                                 0.05
                                                     (A)


Interest charges                            (0.05)                                                                                                         (0.36)                 (0.41)
Goodwill amortization                                                                                                                                      (0.21)                 (0.21)


Diversified businesses                                                                                            0.10                  0.13                                      0.23


Share dilution                              (0.26)                                                               (0.06)                 0.03                                      (0.29)
                                                     (B)                                                                  (B)                   (B)                                        (B)

Eliminations/other                           0.01                                                                                                          (0.16)                 (0.15)
                                                                                                                                                                    (E)

2001 earnings                                0.87                      0.72                 0.01                  0.69                 (0.08)              (0.88)                 1.33
                                                                              (C)                                         (D)


Regulated Natural Gas includes NCNG
Energy Ventures includes Electric Fuels (less Rail & Barge), Progress Energy Ventures, Monroe Power, and Energy Marketing & Trading
Other Diversified Businesses includes SRS, Progress Telecom and Progress Rail
Corporate includes eliminations, interest expense, goodwill and intra-period tax allocations


(A) Establishment of service company reduced CP&L share of costs, $.04 related to Jan 2000 ice storm, offset by planned nuclear outage costs in 2001.
(B) Related to issuance of 46.5 million common shares in connection with FPC acquisition in Dec 2000
(C) See Table 1
(D) Approximately $.14 per share in CP&L and $.06 per share in Florida Power related to functions managed by Energy Ventures.
(E) Includes $.23 for intra-period tax allocation adjustment which will vary each quarter. These adjustments will reverse for the year 2001.


Press Release June 01.xls                                                                                                                                             7/25/20019:32 AM
Table 1
            Florida Power
  Segment Earnings Variance Analysis
          June 2001 vs 2000

                            YTD
2000 earnings         $       1.45
Weather                        -
Customer growth and usage     0.08
Other margin                  0.02
O&M                           0.02
Share dilution               (0.73)
Depreciation                 (0.02)
Other taxes                  (0.03)
Interest expense              0.02
Trading and marketing        (0.06)
Eliminations/other           (0.03)
2001 earnings         $       0.72


Press Release June 01.xls              7/25/20019:32 AM
Progress Energy, Inc.
                                                                   Segment Earnings Variance Analysis
                                                                      Second Quarter 2001 vs. 2000

                                                                 Florida            Regulated                                     Other
($ Per share)                           CP&L                      Power               Natural             Energy                Diversified               Corporate           Consolidated
                                       (Electric)               (Electric)              Gas              Ventures               Businesses
2000 earnings                                  0.61                    -                      -                  0.17                      (0.08)                -                    0.70
Weather                                         -                                                                                                                                      -
Customer growth and usage                    (0.07)                                                                                                                                   (0.07)
Other margin                                    -                                          (0.02)                                                                                     (0.02)


Addition of FPC operations                                            0.40                                       0.20                      (0.07)              (0.02)                 0.51
                                                                             (C)                                                                                        (E)

O&M                                          (0.03)                                        (0.01)                                                                                     (0.04)
                                                      (A)


Interest charges                             (0.02)                                                                                                            (0.18)                 (0.20)
Goodwill amortization                                                                                                                                          (0.11)                 (0.11)


Diversified businesses                                                                                           0.04                      0.06                                       0.10


Share dilution                               (0.14)                                                              (0.04)                    0.02                                       (0.16)
                                                      (B)                                                                 (B)                       (B)                                        (B)

Eliminations/other                                                                                                                                             (0.15)                 (0.15)
                                                                                                                                                                        (E)

2001 earnings                                  0.35                   0.40                 (0.03)                0.37                      (0.07)              (0.46)                 0.56
                                                                             (C)                                          (D)


Regulated Natural Gas includes NCNG
Energy Ventures includes Electric Fuels (less Rail & Barge), Progress Energy Ventures, Monroe Power, and Energy Marketing & Trading
Other Diversified Businesses includes SRS, Progress Telecom and Progress Rail
Corporate includes eliminations, interest expense, goodwill and intra-period tax allocations


(A) Costs related to planned nuclear outage.
(B) Related to issuance of 46.5 million common shares in connection with FPC acquisition in Dec 2000
(C) See Table 1
(D) Approximately $.07 per share in CP&L and $.02 per share in Florida Power is related to functions managed by Energy Ventures.
(E) Includes $.13 intra-period tax allocation adjustment which will vary each quarter. These adjustments will reverse for the year 2001.


 Press Release June 01.xls                                                                                                                                                    7/25/20019:33 AM
Table 1
           Florida Power
 Segment Earnings Variance Analysis
    Second Quarter 2001 vs. 2000

2000 earnings         $      0.81
Weather                     (0.04)
Customer growth and usage    0.06
Other margin                 0.01
O&M                          0.02
Share dilution              (0.41)
Depreciation                (0.01)
Other taxes                 (0.01)
Interest expense             0.02
Trading and marketing       (0.02)
Eliminations/other          (0.03)
2001 earnings         $      0.40


Press Release June 01.xls             7/25/20019:33 AM

Contenu connexe

Tendances

Q1 2009 Earning Report of Smith International, Inc.
Q1 2009 Earning Report of Smith International, Inc. Q1 2009 Earning Report of Smith International, Inc.
Q1 2009 Earning Report of Smith International, Inc. earningreport earningreport
 
xel_08/15/01b
xel_08/15/01bxel_08/15/01b
xel_08/15/01bfinance26
 
danaher 04-4Q-REL
danaher 04-4Q-RELdanaher 04-4Q-REL
danaher 04-4Q-RELfinance24
 
dte_q305supp
dte_q305suppdte_q305supp
dte_q305suppfinance41
 
first energy 3Q 2007
first energy 3Q 2007first energy 3Q 2007
first energy 3Q 2007finance21
 
first energy NEW 8/08
first energy NEW 8/08first energy NEW 8/08
first energy NEW 8/08finance21
 
alltel 1Q06_Supplement
alltel  1Q06_Supplementalltel  1Q06_Supplement
alltel 1Q06_Supplementfinance27
 
alltel 2Q06_Supplement
alltel  2Q06_Supplementalltel  2Q06_Supplement
alltel 2Q06_Supplementfinance27
 
Conforming Wireless P&L for 12 Months Ending 9/30/07
 	Conforming Wireless P&L for 12 Months Ending 9/30/07 	Conforming Wireless P&L for 12 Months Ending 9/30/07
Conforming Wireless P&L for 12 Months Ending 9/30/07finance6
 

Tendances (10)

Q1 2009 Earning Report of Smith International, Inc.
Q1 2009 Earning Report of Smith International, Inc. Q1 2009 Earning Report of Smith International, Inc.
Q1 2009 Earning Report of Smith International, Inc.
 
Q1 2009 Financial Report of Crane Co.
Q1 2009 Financial Report of Crane Co.Q1 2009 Financial Report of Crane Co.
Q1 2009 Financial Report of Crane Co.
 
xel_08/15/01b
xel_08/15/01bxel_08/15/01b
xel_08/15/01b
 
danaher 04-4Q-REL
danaher 04-4Q-RELdanaher 04-4Q-REL
danaher 04-4Q-REL
 
dte_q305supp
dte_q305suppdte_q305supp
dte_q305supp
 
first energy 3Q 2007
first energy 3Q 2007first energy 3Q 2007
first energy 3Q 2007
 
first energy NEW 8/08
first energy NEW 8/08first energy NEW 8/08
first energy NEW 8/08
 
alltel 1Q06_Supplement
alltel  1Q06_Supplementalltel  1Q06_Supplement
alltel 1Q06_Supplement
 
alltel 2Q06_Supplement
alltel  2Q06_Supplementalltel  2Q06_Supplement
alltel 2Q06_Supplement
 
Conforming Wireless P&L for 12 Months Ending 9/30/07
 	Conforming Wireless P&L for 12 Months Ending 9/30/07 	Conforming Wireless P&L for 12 Months Ending 9/30/07
Conforming Wireless P&L for 12 Months Ending 9/30/07
 

En vedette

น้ำหมักจุลินทรีย์มหัศจรรย์
น้ำหมักจุลินทรีย์มหัศจรรย์น้ำหมักจุลินทรีย์มหัศจรรย์
น้ำหมักจุลินทรีย์มหัศจรรย์Thawinan Emsiranunt
 
progress energy q2 2006 release
progress energy q2 2006 releaseprogress energy q2 2006 release
progress energy q2 2006 releasefinance25
 
bai1-gioithieu
bai1-gioithieubai1-gioithieu
bai1-gioithieuMio Class
 
Baden y los bosques de viena
Baden y los bosques de vienaBaden y los bosques de viena
Baden y los bosques de vienaLilianaB2008
 
Social Media Start with the Listening
Social Media Start with the ListeningSocial Media Start with the Listening
Social Media Start with the Listeningsiriporn pongvinyoo
 
Oshkosh Truck Corp. Earning Presentation
Oshkosh Truck Corp. Earning PresentationOshkosh Truck Corp. Earning Presentation
Oshkosh Truck Corp. Earning PresentationManya Mohan
 
Barlangcavernoso
BarlangcavernosoBarlangcavernoso
Barlangcavernosoguest0ad09c
 
บทที่4 Recruitment_Selection
บทที่4 Recruitment_Selectionบทที่4 Recruitment_Selection
บทที่4 Recruitment_SelectionSakda Hwankaew
 
Louis aston knight ra
Louis aston knight raLouis aston knight ra
Louis aston knight raLilianaB2008
 
Prokudin Gorskii
Prokudin GorskiiProkudin Gorskii
Prokudin GorskiiArt 37
 
El viaje a panama
El viaje a panamaEl viaje a panama
El viaje a panamafavavavac
 
Ilustraciones libros leídos 3ª ficha
Ilustraciones libros leídos 3ª fichaIlustraciones libros leídos 3ª ficha
Ilustraciones libros leídos 3ª fichaAulamcarmenq de Burgos
 
progress energy Q1 04 earnings release
progress energy Q1 04 earnings releaseprogress energy Q1 04 earnings release
progress energy Q1 04 earnings releasefinance25
 
Taiwan international orchid_show
Taiwan international orchid_showTaiwan international orchid_show
Taiwan international orchid_showLilianaB2008
 

En vedette (20)

Escallol
EscallolEscallol
Escallol
 
น้ำหมักจุลินทรีย์มหัศจรรย์
น้ำหมักจุลินทรีย์มหัศจรรย์น้ำหมักจุลินทรีย์มหัศจรรย์
น้ำหมักจุลินทรีย์มหัศจรรย์
 
progress energy q2 2006 release
progress energy q2 2006 releaseprogress energy q2 2006 release
progress energy q2 2006 release
 
bai1-gioithieu
bai1-gioithieubai1-gioithieu
bai1-gioithieu
 
Ans50
Ans50Ans50
Ans50
 
Baden y los bosques de viena
Baden y los bosques de vienaBaden y los bosques de viena
Baden y los bosques de viena
 
Social Media Start with the Listening
Social Media Start with the ListeningSocial Media Start with the Listening
Social Media Start with the Listening
 
Oshkosh Truck Corp. Earning Presentation
Oshkosh Truck Corp. Earning PresentationOshkosh Truck Corp. Earning Presentation
Oshkosh Truck Corp. Earning Presentation
 
Barlangcavernoso
BarlangcavernosoBarlangcavernoso
Barlangcavernoso
 
บทที่4 Recruitment_Selection
บทที่4 Recruitment_Selectionบทที่4 Recruitment_Selection
บทที่4 Recruitment_Selection
 
Louis aston knight ra
Louis aston knight raLouis aston knight ra
Louis aston knight ra
 
Prokudin Gorskii
Prokudin GorskiiProkudin Gorskii
Prokudin Gorskii
 
Correo
CorreoCorreo
Correo
 
El viaje a panama
El viaje a panamaEl viaje a panama
El viaje a panama
 
Ilustraciones libros leídos 3ª ficha
Ilustraciones libros leídos 3ª fichaIlustraciones libros leídos 3ª ficha
Ilustraciones libros leídos 3ª ficha
 
progress energy Q1 04 earnings release
progress energy Q1 04 earnings releaseprogress energy Q1 04 earnings release
progress energy Q1 04 earnings release
 
Taiwan international orchid_show
Taiwan international orchid_showTaiwan international orchid_show
Taiwan international orchid_show
 
Poema
PoemaPoema
Poema
 
Swine Flu Info
Swine Flu InfoSwine Flu Info
Swine Flu Info
 
Cristal waves
Cristal wavesCristal waves
Cristal waves
 

Similaire à progress energy 07/25/2001

energy east 2Q08_EAS_release
energy east 2Q08_EAS_releaseenergy east 2Q08_EAS_release
energy east 2Q08_EAS_releasefinance40
 
reliance steel & aluminum 2005_Annual_Report
reliance steel & aluminum  2005_Annual_Reportreliance steel & aluminum  2005_Annual_Report
reliance steel & aluminum 2005_Annual_Reportfinance32
 
conoco phillips 2008Second Quarter
conoco phillips 2008Second Quarterconoco phillips 2008Second Quarter
conoco phillips 2008Second Quarterfinance1
 
atmos enerrgy segmentinfo040408
atmos enerrgy segmentinfo040408atmos enerrgy segmentinfo040408
atmos enerrgy segmentinfo040408finance35
 
energy east Q32007ER
energy east Q32007ERenergy east Q32007ER
energy east Q32007ERfinance40
 
energy east Q12007ER
energy east Q12007ERenergy east Q12007ER
energy east Q12007ERfinance40
 
conoco phillips 2008 First Quarter
conoco phillips 2008 First Quarterconoco phillips 2008 First Quarter
conoco phillips 2008 First Quarterfinance1
 
conoco phillips 2008Third Quarter
conoco phillips 2008Third Quarterconoco phillips 2008Third Quarter
conoco phillips 2008Third Quarterfinance1
 
dover Q208_Supplement_r232g32g32g
dover Q208_Supplement_r232g32g32gdover Q208_Supplement_r232g32g32g
dover Q208_Supplement_r232g32g32gfinance30
 
state street corp stt_finrev02
state street corp stt_finrev02state street corp stt_finrev02
state street corp stt_finrev02finance23
 
state street corp stt_finrev02
state street corp stt_finrev02state street corp stt_finrev02
state street corp stt_finrev02finance23
 
occidental petroleum Consolidated Statements of Operations
occidental petroleum Consolidated Statements of Operationsoccidental petroleum Consolidated Statements of Operations
occidental petroleum Consolidated Statements of Operationsfinance13
 
conoco phillips 2008Fourth Quarter
conoco phillips 2008Fourth Quarterconoco phillips 2008Fourth Quarter
conoco phillips 2008Fourth Quarterfinance1
 
allstate Financial Section 1999
allstate Financial Section 1999allstate Financial Section 1999
allstate Financial Section 1999finance7
 
alltel 3Q06_InvestorSupplementa
alltel  3Q06_InvestorSupplementaalltel  3Q06_InvestorSupplementa
alltel 3Q06_InvestorSupplementafinance27
 
conoco phillips 2006Third Quarter
conoco phillips 2006Third Quarterconoco phillips 2006Third Quarter
conoco phillips 2006Third Quarterfinance1
 
tjx Annual Reports1998
tjx Annual Reports1998tjx Annual Reports1998
tjx Annual Reports1998finance14
 
conoco phillips 2007Third Quarter
conoco phillips 2007Third Quarterconoco phillips 2007Third Quarter
conoco phillips 2007Third Quarterfinance1
 

Similaire à progress energy 07/25/2001 (20)

energy east 2Q08_EAS_release
energy east 2Q08_EAS_releaseenergy east 2Q08_EAS_release
energy east 2Q08_EAS_release
 
reliance steel & aluminum 2005_Annual_Report
reliance steel & aluminum  2005_Annual_Reportreliance steel & aluminum  2005_Annual_Report
reliance steel & aluminum 2005_Annual_Report
 
EAS_Q407_ER
EAS_Q407_EREAS_Q407_ER
EAS_Q407_ER
 
conoco phillips 2008Second Quarter
conoco phillips 2008Second Quarterconoco phillips 2008Second Quarter
conoco phillips 2008Second Quarter
 
atmos enerrgy segmentinfo040408
atmos enerrgy segmentinfo040408atmos enerrgy segmentinfo040408
atmos enerrgy segmentinfo040408
 
energy east Q32007ER
energy east Q32007ERenergy east Q32007ER
energy east Q32007ER
 
energy east Q12007ER
energy east Q12007ERenergy east Q12007ER
energy east Q12007ER
 
EAS_Q108_ER
EAS_Q108_EREAS_Q108_ER
EAS_Q108_ER
 
conoco phillips 2008 First Quarter
conoco phillips 2008 First Quarterconoco phillips 2008 First Quarter
conoco phillips 2008 First Quarter
 
conoco phillips 2008Third Quarter
conoco phillips 2008Third Quarterconoco phillips 2008Third Quarter
conoco phillips 2008Third Quarter
 
dover Q208_Supplement_r232g32g32g
dover Q208_Supplement_r232g32g32gdover Q208_Supplement_r232g32g32g
dover Q208_Supplement_r232g32g32g
 
state street corp stt_finrev02
state street corp stt_finrev02state street corp stt_finrev02
state street corp stt_finrev02
 
state street corp stt_finrev02
state street corp stt_finrev02state street corp stt_finrev02
state street corp stt_finrev02
 
occidental petroleum Consolidated Statements of Operations
occidental petroleum Consolidated Statements of Operationsoccidental petroleum Consolidated Statements of Operations
occidental petroleum Consolidated Statements of Operations
 
conoco phillips 2008Fourth Quarter
conoco phillips 2008Fourth Quarterconoco phillips 2008Fourth Quarter
conoco phillips 2008Fourth Quarter
 
allstate Financial Section 1999
allstate Financial Section 1999allstate Financial Section 1999
allstate Financial Section 1999
 
alltel 3Q06_InvestorSupplementa
alltel  3Q06_InvestorSupplementaalltel  3Q06_InvestorSupplementa
alltel 3Q06_InvestorSupplementa
 
conoco phillips 2006Third Quarter
conoco phillips 2006Third Quarterconoco phillips 2006Third Quarter
conoco phillips 2006Third Quarter
 
tjx Annual Reports1998
tjx Annual Reports1998tjx Annual Reports1998
tjx Annual Reports1998
 
conoco phillips 2007Third Quarter
conoco phillips 2007Third Quarterconoco phillips 2007Third Quarter
conoco phillips 2007Third Quarter
 

Plus de finance25

AR BBT Annual2005
AR BBT Annual2005AR BBT Annual2005
AR BBT Annual2005finance25
 
BBTsq4 2008 Fourth Quarte 2008 Shareholders_Report
BBTsq4 2008 Fourth Quarte 2008 Shareholders_ReportBBTsq4 2008 Fourth Quarte 2008 Shareholders_Report
BBTsq4 2008 Fourth Quarte 2008 Shareholders_Reportfinance25
 
BBTfq4 2008 Fourth Quarter 2008_Financial_Tables
BBTfq4 2008 Fourth Quarter 2008_Financial_TablesBBTfq4 2008 Fourth Quarter 2008_Financial_Tables
BBTfq4 2008 Fourth Quarter 2008_Financial_Tablesfinance25
 
progress-energy 2008 cpl proxy
progress-energy 2008 cpl proxyprogress-energy 2008 cpl proxy
progress-energy 2008 cpl proxyfinance25
 
progress-energy 2008 proxy
progress-energy 2008 proxyprogress-energy 2008 proxy
progress-energy 2008 proxyfinance25
 
progress energy 4/3/08
progress energy 4/3/08progress energy 4/3/08
progress energy 4/3/08finance25
 
progress energy 05/14/08
progress energy 05/14/08progress energy 05/14/08
progress energy 05/14/08finance25
 
progress energy q1 2008
progress energy q1 2008progress energy q1 2008
progress energy q1 2008finance25
 
progress energy 08/07/08slides
progress energy 08/07/08slidesprogress energy 08/07/08slides
progress energy 08/07/08slidesfinance25
 
progress energy lehman
progress energy lehmanprogress energy lehman
progress energy lehmanfinance25
 
progress energy 09/24/08
progress energy 09/24/08progress energy 09/24/08
progress energy 09/24/08finance25
 
progress energy Qslides10/08
progress energy Qslides10/08progress energy Qslides10/08
progress energy Qslides10/08finance25
 
progress energy i2
progress energy i2progress energy i2
progress energy i2finance25
 
progress energy 08
progress energy 08progress energy 08
progress energy 08finance25
 
progress energy Q4 2008_earnings call
progress energy Q4 2008_earnings callprogress energy Q4 2008_earnings call
progress energy Q4 2008_earnings callfinance25
 
progress energy 4Q 2001
progress energy 4Q 2001progress energy 4Q 2001
progress energy 4Q 2001finance25
 
progress energy 1Q 02 earnings releaseFinal_all
progress energy 1Q 02 earnings releaseFinal_allprogress energy 1Q 02 earnings releaseFinal_all
progress energy 1Q 02 earnings releaseFinal_allfinance25
 
progress energy 2Q 02earnings release Final
progress energy 2Q 02earnings release Finalprogress energy 2Q 02earnings release Final
progress energy 2Q 02earnings release Finalfinance25
 
progress energy 3Q 02.earnings.release.andfinancials
progress energy 3Q 02.earnings.release.andfinancialsprogress energy 3Q 02.earnings.release.andfinancials
progress energy 3Q 02.earnings.release.andfinancialsfinance25
 
progress energy Q1 03 earnings release
progress energy Q1 03 earnings releaseprogress energy Q1 03 earnings release
progress energy Q1 03 earnings releasefinance25
 

Plus de finance25 (20)

AR BBT Annual2005
AR BBT Annual2005AR BBT Annual2005
AR BBT Annual2005
 
BBTsq4 2008 Fourth Quarte 2008 Shareholders_Report
BBTsq4 2008 Fourth Quarte 2008 Shareholders_ReportBBTsq4 2008 Fourth Quarte 2008 Shareholders_Report
BBTsq4 2008 Fourth Quarte 2008 Shareholders_Report
 
BBTfq4 2008 Fourth Quarter 2008_Financial_Tables
BBTfq4 2008 Fourth Quarter 2008_Financial_TablesBBTfq4 2008 Fourth Quarter 2008_Financial_Tables
BBTfq4 2008 Fourth Quarter 2008_Financial_Tables
 
progress-energy 2008 cpl proxy
progress-energy 2008 cpl proxyprogress-energy 2008 cpl proxy
progress-energy 2008 cpl proxy
 
progress-energy 2008 proxy
progress-energy 2008 proxyprogress-energy 2008 proxy
progress-energy 2008 proxy
 
progress energy 4/3/08
progress energy 4/3/08progress energy 4/3/08
progress energy 4/3/08
 
progress energy 05/14/08
progress energy 05/14/08progress energy 05/14/08
progress energy 05/14/08
 
progress energy q1 2008
progress energy q1 2008progress energy q1 2008
progress energy q1 2008
 
progress energy 08/07/08slides
progress energy 08/07/08slidesprogress energy 08/07/08slides
progress energy 08/07/08slides
 
progress energy lehman
progress energy lehmanprogress energy lehman
progress energy lehman
 
progress energy 09/24/08
progress energy 09/24/08progress energy 09/24/08
progress energy 09/24/08
 
progress energy Qslides10/08
progress energy Qslides10/08progress energy Qslides10/08
progress energy Qslides10/08
 
progress energy i2
progress energy i2progress energy i2
progress energy i2
 
progress energy 08
progress energy 08progress energy 08
progress energy 08
 
progress energy Q4 2008_earnings call
progress energy Q4 2008_earnings callprogress energy Q4 2008_earnings call
progress energy Q4 2008_earnings call
 
progress energy 4Q 2001
progress energy 4Q 2001progress energy 4Q 2001
progress energy 4Q 2001
 
progress energy 1Q 02 earnings releaseFinal_all
progress energy 1Q 02 earnings releaseFinal_allprogress energy 1Q 02 earnings releaseFinal_all
progress energy 1Q 02 earnings releaseFinal_all
 
progress energy 2Q 02earnings release Final
progress energy 2Q 02earnings release Finalprogress energy 2Q 02earnings release Final
progress energy 2Q 02earnings release Final
 
progress energy 3Q 02.earnings.release.andfinancials
progress energy 3Q 02.earnings.release.andfinancialsprogress energy 3Q 02.earnings.release.andfinancials
progress energy 3Q 02.earnings.release.andfinancials
 
progress energy Q1 03 earnings release
progress energy Q1 03 earnings releaseprogress energy Q1 03 earnings release
progress energy Q1 03 earnings release
 

Dernier

Vp Girls near me Delhi Call Now or WhatsApp
Vp Girls near me Delhi Call Now or WhatsAppVp Girls near me Delhi Call Now or WhatsApp
Vp Girls near me Delhi Call Now or WhatsAppmiss dipika
 
NO1 Certified Amil Baba In Lahore Kala Jadu In Lahore Best Amil In Lahore Ami...
NO1 Certified Amil Baba In Lahore Kala Jadu In Lahore Best Amil In Lahore Ami...NO1 Certified Amil Baba In Lahore Kala Jadu In Lahore Best Amil In Lahore Ami...
NO1 Certified Amil Baba In Lahore Kala Jadu In Lahore Best Amil In Lahore Ami...Amil baba
 
government_intervention_in_business_ownership[1].pdf
government_intervention_in_business_ownership[1].pdfgovernment_intervention_in_business_ownership[1].pdf
government_intervention_in_business_ownership[1].pdfshaunmashale756
 
SBP-Market-Operations and market managment
SBP-Market-Operations and market managmentSBP-Market-Operations and market managment
SBP-Market-Operations and market managmentfactical
 
The Inspirational Story of Julio Herrera Velutini - Global Finance Leader
The Inspirational Story of Julio Herrera Velutini - Global Finance LeaderThe Inspirational Story of Julio Herrera Velutini - Global Finance Leader
The Inspirational Story of Julio Herrera Velutini - Global Finance LeaderArianna Varetto
 
NO1 WorldWide Love marriage specialist baba ji Amil Baba Kala ilam powerful v...
NO1 WorldWide Love marriage specialist baba ji Amil Baba Kala ilam powerful v...NO1 WorldWide Love marriage specialist baba ji Amil Baba Kala ilam powerful v...
NO1 WorldWide Love marriage specialist baba ji Amil Baba Kala ilam powerful v...Amil baba
 
The Core Functions of the Bangko Sentral ng Pilipinas
The Core Functions of the Bangko Sentral ng PilipinasThe Core Functions of the Bangko Sentral ng Pilipinas
The Core Functions of the Bangko Sentral ng PilipinasCherylouCamus
 
The Triple Threat | Article on Global Resession | Harsh Kumar
The Triple Threat | Article on Global Resession | Harsh KumarThe Triple Threat | Article on Global Resession | Harsh Kumar
The Triple Threat | Article on Global Resession | Harsh KumarHarsh Kumar
 
Bladex 1Q24 Earning Results Presentation
Bladex 1Q24 Earning Results PresentationBladex 1Q24 Earning Results Presentation
Bladex 1Q24 Earning Results PresentationBladex
 
(办理学位证)加拿大萨省大学毕业证成绩单原版一比一
(办理学位证)加拿大萨省大学毕业证成绩单原版一比一(办理学位证)加拿大萨省大学毕业证成绩单原版一比一
(办理学位证)加拿大萨省大学毕业证成绩单原版一比一S SDS
 
Economic Risk Factor Update: April 2024 [SlideShare]
Economic Risk Factor Update: April 2024 [SlideShare]Economic Risk Factor Update: April 2024 [SlideShare]
Economic Risk Factor Update: April 2024 [SlideShare]Commonwealth
 
Overview of Inkel Unlisted Shares Price.
Overview of Inkel Unlisted Shares Price.Overview of Inkel Unlisted Shares Price.
Overview of Inkel Unlisted Shares Price.Precize Formely Leadoff
 
(中央兰开夏大学毕业证学位证成绩单-案例)
(中央兰开夏大学毕业证学位证成绩单-案例)(中央兰开夏大学毕业证学位证成绩单-案例)
(中央兰开夏大学毕业证学位证成绩单-案例)twfkn8xj
 
Role of Information and technology in banking and finance .pptx
Role of Information and technology in banking and finance .pptxRole of Information and technology in banking and finance .pptx
Role of Information and technology in banking and finance .pptxNarayaniTripathi2
 
2024 Q1 Crypto Industry Report | CoinGecko
2024 Q1 Crypto Industry Report | CoinGecko2024 Q1 Crypto Industry Report | CoinGecko
2024 Q1 Crypto Industry Report | CoinGeckoCoinGecko
 
GOODSANDSERVICETAX IN INDIAN ECONOMY IMPACT
GOODSANDSERVICETAX IN INDIAN ECONOMY IMPACTGOODSANDSERVICETAX IN INDIAN ECONOMY IMPACT
GOODSANDSERVICETAX IN INDIAN ECONOMY IMPACTharshitverma1762
 
原版1:1复刻堪萨斯大学毕业证KU毕业证留信学历认证
原版1:1复刻堪萨斯大学毕业证KU毕业证留信学历认证原版1:1复刻堪萨斯大学毕业证KU毕业证留信学历认证
原版1:1复刻堪萨斯大学毕业证KU毕业证留信学历认证jdkhjh
 
Call Girls Near Golden Tulip Essential Hotel, New Delhi 9873777170
Call Girls Near Golden Tulip Essential Hotel, New Delhi 9873777170Call Girls Near Golden Tulip Essential Hotel, New Delhi 9873777170
Call Girls Near Golden Tulip Essential Hotel, New Delhi 9873777170Sonam Pathan
 
Call Girls Near Me WhatsApp:+91-9833363713
Call Girls Near Me WhatsApp:+91-9833363713Call Girls Near Me WhatsApp:+91-9833363713
Call Girls Near Me WhatsApp:+91-9833363713Sonam Pathan
 

Dernier (20)

Vp Girls near me Delhi Call Now or WhatsApp
Vp Girls near me Delhi Call Now or WhatsAppVp Girls near me Delhi Call Now or WhatsApp
Vp Girls near me Delhi Call Now or WhatsApp
 
NO1 Certified Amil Baba In Lahore Kala Jadu In Lahore Best Amil In Lahore Ami...
NO1 Certified Amil Baba In Lahore Kala Jadu In Lahore Best Amil In Lahore Ami...NO1 Certified Amil Baba In Lahore Kala Jadu In Lahore Best Amil In Lahore Ami...
NO1 Certified Amil Baba In Lahore Kala Jadu In Lahore Best Amil In Lahore Ami...
 
government_intervention_in_business_ownership[1].pdf
government_intervention_in_business_ownership[1].pdfgovernment_intervention_in_business_ownership[1].pdf
government_intervention_in_business_ownership[1].pdf
 
SBP-Market-Operations and market managment
SBP-Market-Operations and market managmentSBP-Market-Operations and market managment
SBP-Market-Operations and market managment
 
The Inspirational Story of Julio Herrera Velutini - Global Finance Leader
The Inspirational Story of Julio Herrera Velutini - Global Finance LeaderThe Inspirational Story of Julio Herrera Velutini - Global Finance Leader
The Inspirational Story of Julio Herrera Velutini - Global Finance Leader
 
🔝+919953056974 🔝young Delhi Escort service Pusa Road
🔝+919953056974 🔝young Delhi Escort service Pusa Road🔝+919953056974 🔝young Delhi Escort service Pusa Road
🔝+919953056974 🔝young Delhi Escort service Pusa Road
 
NO1 WorldWide Love marriage specialist baba ji Amil Baba Kala ilam powerful v...
NO1 WorldWide Love marriage specialist baba ji Amil Baba Kala ilam powerful v...NO1 WorldWide Love marriage specialist baba ji Amil Baba Kala ilam powerful v...
NO1 WorldWide Love marriage specialist baba ji Amil Baba Kala ilam powerful v...
 
The Core Functions of the Bangko Sentral ng Pilipinas
The Core Functions of the Bangko Sentral ng PilipinasThe Core Functions of the Bangko Sentral ng Pilipinas
The Core Functions of the Bangko Sentral ng Pilipinas
 
The Triple Threat | Article on Global Resession | Harsh Kumar
The Triple Threat | Article on Global Resession | Harsh KumarThe Triple Threat | Article on Global Resession | Harsh Kumar
The Triple Threat | Article on Global Resession | Harsh Kumar
 
Bladex 1Q24 Earning Results Presentation
Bladex 1Q24 Earning Results PresentationBladex 1Q24 Earning Results Presentation
Bladex 1Q24 Earning Results Presentation
 
(办理学位证)加拿大萨省大学毕业证成绩单原版一比一
(办理学位证)加拿大萨省大学毕业证成绩单原版一比一(办理学位证)加拿大萨省大学毕业证成绩单原版一比一
(办理学位证)加拿大萨省大学毕业证成绩单原版一比一
 
Economic Risk Factor Update: April 2024 [SlideShare]
Economic Risk Factor Update: April 2024 [SlideShare]Economic Risk Factor Update: April 2024 [SlideShare]
Economic Risk Factor Update: April 2024 [SlideShare]
 
Overview of Inkel Unlisted Shares Price.
Overview of Inkel Unlisted Shares Price.Overview of Inkel Unlisted Shares Price.
Overview of Inkel Unlisted Shares Price.
 
(中央兰开夏大学毕业证学位证成绩单-案例)
(中央兰开夏大学毕业证学位证成绩单-案例)(中央兰开夏大学毕业证学位证成绩单-案例)
(中央兰开夏大学毕业证学位证成绩单-案例)
 
Role of Information and technology in banking and finance .pptx
Role of Information and technology in banking and finance .pptxRole of Information and technology in banking and finance .pptx
Role of Information and technology in banking and finance .pptx
 
2024 Q1 Crypto Industry Report | CoinGecko
2024 Q1 Crypto Industry Report | CoinGecko2024 Q1 Crypto Industry Report | CoinGecko
2024 Q1 Crypto Industry Report | CoinGecko
 
GOODSANDSERVICETAX IN INDIAN ECONOMY IMPACT
GOODSANDSERVICETAX IN INDIAN ECONOMY IMPACTGOODSANDSERVICETAX IN INDIAN ECONOMY IMPACT
GOODSANDSERVICETAX IN INDIAN ECONOMY IMPACT
 
原版1:1复刻堪萨斯大学毕业证KU毕业证留信学历认证
原版1:1复刻堪萨斯大学毕业证KU毕业证留信学历认证原版1:1复刻堪萨斯大学毕业证KU毕业证留信学历认证
原版1:1复刻堪萨斯大学毕业证KU毕业证留信学历认证
 
Call Girls Near Golden Tulip Essential Hotel, New Delhi 9873777170
Call Girls Near Golden Tulip Essential Hotel, New Delhi 9873777170Call Girls Near Golden Tulip Essential Hotel, New Delhi 9873777170
Call Girls Near Golden Tulip Essential Hotel, New Delhi 9873777170
 
Call Girls Near Me WhatsApp:+91-9833363713
Call Girls Near Me WhatsApp:+91-9833363713Call Girls Near Me WhatsApp:+91-9833363713
Call Girls Near Me WhatsApp:+91-9833363713
 

progress energy 07/25/2001

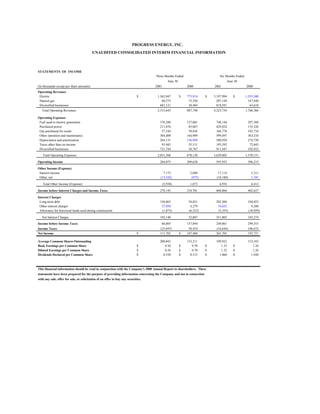
  • 1. PROGRESS ENERGY, INC. UNAUDITED CONSOLIDATED INTERIM FINANCIAL INFORMATION STATEMENTS OF INCOME Three Months Ended Six Months Ended June 30 June 30 (In thousands except per share amounts) 2001 2000 2001 2000 Operating Revenues Electric $ 1,565,947 $ 773,914 $ 3,197,994 $ 1,555,300 Natural gas 68,575 75,350 207,149 147,448 Diversified businesses 681,121 38,484 818,591 63,618 Total Operating Revenues 2,315,643 887,748 4,223,734 1,766,366 Operating Expenses Fuel used in electric generation 378,288 137,001 748,144 297,388 Purchased power 211,876 85,067 429,424 155,326 Gas purchased for resale 57,184 59,836 166,778 103,734 Other operation and maintenance 304,400 164,989 599,497 363,216 Depreciation and amortization 264,131 136,949 580,920 274,720 Taxes other than on income 93,945 35,511 193,592 72,845 Diversified businesses 721,744 58,767 911,447 102,922 Total Operating Expenses 2,031,568 678,120 3,629,802 1,370,151 Operating Income 284,075 209,628 593,932 396,215 Other Income (Expense) Interest income 7,172 2,048 17,114 5,311 Other, net (13,102) (975) (10,180) 1,101 Total Other Income (Expense) (5,930) 1,073 6,934 6,412 Income before Interest Charges and Income Taxes 278,145 210,701 600,866 402,627 Interest Charges Long-term debt 156,063 54,851 282,506 104,923 Other interest charges 37,950 4,279 74,652 9,280 Allowance for borrowed funds used during construction (1,873) (6,323) (5,353) (10,929) Net Interest Charges 192,140 52,807 351,805 103,274 Income before Income Taxes 86,005 157,894 249,061 299,353 Income Taxes (25,697) 50,434 (16,644) 106,632 Net Income $ 111,702 $ 107,460 265,705 192,721 Average Common Shares Outstanding 200,043 153,311 199,922 153,183 Basic Earnings per Common Share $ 0.56 $ 0.70 $ 1.33 $ 1.26 Diluted Earnings per Common Share $ 0.56 $ 0.70 $ 1.32 $ 1.26 Dividends Declared per Common Share $ 0.530 $ 0.515 $ 1.060 $ 1.030 This financial information should be read in conjunction with the Company's 2000 Annual Report to shareholders. These statements have been prepared for the purpose of providing information concerning the Company and not in connection with any sale, offer for sale, or solicitation of an offer to buy any securities.
  • 2. Progress Energy, Inc. BALANCE SHEETS June 30 December 31 (In thousands) 2001 2000 ASSETS Utility Plant Electric utility plant in service $ 18,716,993 $ 18,124,036 Gas utility plant in service 483,538 378,464 Accumulated depreciation (9,761,687) (9,350,172) Utility plant in service, net 9,438,844 9,152,328 Held for future use 15,380 16,302 Construction work in progress 851,412 1,043,376 Nuclear fuel, net of amortization 243,816 224,692 Total Utility Plant, Net 10,549,452 10,436,698 Current Assets Cash and cash equivalents 73,667 101,296 Accounts receivable 992,059 925,911 Taxes receivable 13,220 - Inventory 771,479 420,985 Deferred fuel cost 214,021 217,806 Prepayments 17,304 50,040 Assets Held for Sale, net 58,504 747,745 Other current assets 178,707 192,347 Total Current Assets 2,318,961 2,656,130 Deferred Debits and Other Assets Income taxes recoverable through future rates 238,876 228,686 Harris Plant deferred costs 38,796 44,813 Unamortized debt expense 39,597 38,771 Nuclear decommissioning trust funds 824,854 811,998 Diversified business property, net 1,074,653 720,231 Miscellaneous other property and investments 608,170 636,677 Deferred purchased power contract termination costs 148,757 226,656 Goodwill, net 3,723,868 3,652,429 Other assets and deferred debits 669,705 657,612 Total Deferred Debits and Other Assets 7,367,276 7,017,873 Total Assets $ 20,235,689 $ 20,110,701 CAPITALIZATION AND LIABILITIES Capitalization Common stock equity $ 5,459,040 $ 5,424,201 Preferred stock of subsidiary - redemption not required 92,831 92,831 Long-term debt, net 9,413,639 5,890,099 Total Capitalization 14,965,510 11,407,131 Current Liabilities Current portion of long-term debt 209,550 184,037 Accounts payable 618,098 828,568 Taxes accrued - 932 Interest accrued 204,670 121,433 Dividends declared 107,886 107,645 Short-term Obligations 744,458 3,972,674 Other current liabilities 571,052 447,370 Total Current Liabilities 2,455,714 5,662,659 Deferred Credits and Other Liabilities Accumulated deferred income taxes 1,680,446 1,807,192 Accumulated deferred investment tax credits 236,051 261,255 Other liabilities and deferred credits 897,968 972,464 Total Deferred Credits and Other Liabilities 2,814,465 3,040,911 Total Capitalization and Liabilities $ 20,235,689 $ 20,110,701 SCHEDULES OF COMMON STOCK EQUITY (In thousands) Common stock (without par value, authorized 500,000,000, issued and outstanding $ 3,614,279 $ 3,608,902 206,089,274 and 206,089,047 shares, respectively) Unearned ESOP common stock (117,268) (127,211) Accumulated other comprehensive loss (34,214) - Retained earnings 1,996,243 1,942,510 Total Common Stock Equity $ 5,459,040 $ 5,424,201
  • 3. Progress Energy, Inc. SUPPLEMENTAL DATA Three Months Ended Six Months Ended June 30 June 30 2001 2000 2001 2000 Operating Revenues (in thousands) Electric Retail $ 1,295,650 $ 597,702 2,622,453 $ 1,232,471 Wholesale 214,908 133,725 475,555 265,600 Unbilled 15,099 25,029 (46,780) 24,221 Miscellaneous revenue 40,290 17,458 146,766 33,008 Total Electric 1,565,947 773,914 3,197,994 1,555,300 Natural gas 68,575 75,350 207,149 147,448 Diversified businesses 681,121 38,484 818,591 63,618 Total Operating Revenues $ 2,315,643 $ 887,748 4,223,734 $ 1,766,366 Energy Sales Electric (millions of kWh) Retail Residential 7,204 3,023 15,926 6,951 Commercial 5,682 2,803 10,956 5,359 Industrial 4,401 3,676 8,594 7,077 Other retail 1,007 323 1,970 663 Total Retail 18,294 9,825 37,446 20,050 Unbilled 624 425 (543) 361 Wholesale 4,080 3,287 8,859 7,004 Total Electric 22,998 13,537 45,762 27,415 Natural Gas (thousands of dt) 11,096 13,497 25,942 30,841 Energy Supply (millions of kWh) Generated - steam 11,877 6,885 23,791 14,345 nuclear 6,813 5,433 13,950 11,097 hydro 64 157 117 333 combustion turbines 1,672 282 2,809 316 Purchased 3,711 1,299 7,385 2,331 Total Energy Supply (Company Share) 24,137 14,056 48,052 28,422 Detail of Income Taxes (in thousands) Income tax expense (credit) - current $ (6,730) $ 73,099 28,475 $ 162,936 deferred (12,723) (20,066) (31,904) (51,106) investment tax credit (6,244) (2,599) (13,215) (5,198) Total Income Tax Expense $ (25,697) $ 50,434 (16,644) $ 106,632 FINANCIAL STATISTICS Ratio of earnings to fixed charges 2.16 3.98 Return on average common stock equity 11.95 % 12.27 Book value per common share $ 27.28 $ 22.57 Capitalization ratios Common stock equity 36.48 % 52.40 Preferred stock of subsidiary- redemption not required 0.62 0.90 Long-term debt, net 62.90 46.70 Total 100.00 % 100.00
  • 4. Progress Energy, Inc. Segment Earnings Variance Analysis Year to Date June 2001 vs. 2000 Florida Regulated Other ($ Per share) CP&L Power Natural Energy Diversified Corporate Consolidated (Electric) (Electric) Gas Ventures Businesses 2000 earnings 1.10 - 0.06 0.27 (0.17) 1.26 Weather - - Customer growth and usage - - Other margin - (0.03) (0.03) Addition of FPC operations 0.72 0.38 (0.07) (0.15) 0.88 (C) (E) O&M 0.07 (0.02) 0.05 (A) Interest charges (0.05) (0.36) (0.41) Goodwill amortization (0.21) (0.21) Diversified businesses 0.10 0.13 0.23 Share dilution (0.26) (0.06) 0.03 (0.29) (B) (B) (B) (B) Eliminations/other 0.01 (0.16) (0.15) (E) 2001 earnings 0.87 0.72 0.01 0.69 (0.08) (0.88) 1.33 (C) (D) Regulated Natural Gas includes NCNG Energy Ventures includes Electric Fuels (less Rail & Barge), Progress Energy Ventures, Monroe Power, and Energy Marketing & Trading Other Diversified Businesses includes SRS, Progress Telecom and Progress Rail Corporate includes eliminations, interest expense, goodwill and intra-period tax allocations (A) Establishment of service company reduced CP&L share of costs, $.04 related to Jan 2000 ice storm, offset by planned nuclear outage costs in 2001. (B) Related to issuance of 46.5 million common shares in connection with FPC acquisition in Dec 2000 (C) See Table 1 (D) Approximately $.14 per share in CP&L and $.06 per share in Florida Power related to functions managed by Energy Ventures. (E) Includes $.23 for intra-period tax allocation adjustment which will vary each quarter. These adjustments will reverse for the year 2001. Press Release June 01.xls 7/25/20019:32 AM
  • 5. Table 1 Florida Power Segment Earnings Variance Analysis June 2001 vs 2000 YTD 2000 earnings $ 1.45 Weather - Customer growth and usage 0.08 Other margin 0.02 O&M 0.02 Share dilution (0.73) Depreciation (0.02) Other taxes (0.03) Interest expense 0.02 Trading and marketing (0.06) Eliminations/other (0.03) 2001 earnings $ 0.72 Press Release June 01.xls 7/25/20019:32 AM
  • 6. Progress Energy, Inc. Segment Earnings Variance Analysis Second Quarter 2001 vs. 2000 Florida Regulated Other ($ Per share) CP&L Power Natural Energy Diversified Corporate Consolidated (Electric) (Electric) Gas Ventures Businesses 2000 earnings 0.61 - - 0.17 (0.08) - 0.70 Weather - - Customer growth and usage (0.07) (0.07) Other margin - (0.02) (0.02) Addition of FPC operations 0.40 0.20 (0.07) (0.02) 0.51 (C) (E) O&M (0.03) (0.01) (0.04) (A) Interest charges (0.02) (0.18) (0.20) Goodwill amortization (0.11) (0.11) Diversified businesses 0.04 0.06 0.10 Share dilution (0.14) (0.04) 0.02 (0.16) (B) (B) (B) (B) Eliminations/other (0.15) (0.15) (E) 2001 earnings 0.35 0.40 (0.03) 0.37 (0.07) (0.46) 0.56 (C) (D) Regulated Natural Gas includes NCNG Energy Ventures includes Electric Fuels (less Rail & Barge), Progress Energy Ventures, Monroe Power, and Energy Marketing & Trading Other Diversified Businesses includes SRS, Progress Telecom and Progress Rail Corporate includes eliminations, interest expense, goodwill and intra-period tax allocations (A) Costs related to planned nuclear outage. (B) Related to issuance of 46.5 million common shares in connection with FPC acquisition in Dec 2000 (C) See Table 1 (D) Approximately $.07 per share in CP&L and $.02 per share in Florida Power is related to functions managed by Energy Ventures. (E) Includes $.13 intra-period tax allocation adjustment which will vary each quarter. These adjustments will reverse for the year 2001. Press Release June 01.xls 7/25/20019:33 AM
  • 7. Table 1 Florida Power Segment Earnings Variance Analysis Second Quarter 2001 vs. 2000 2000 earnings $ 0.81 Weather (0.04) Customer growth and usage 0.06 Other margin 0.01 O&M 0.02 Share dilution (0.41) Depreciation (0.01) Other taxes (0.01) Interest expense 0.02 Trading and marketing (0.02) Eliminations/other (0.03) 2001 earnings $ 0.40 Press Release June 01.xls 7/25/20019:33 AM