More Related Content
Similar to MGM MIRAGE MGM_MIRAGE_Supp_Data_103007
Similar to MGM MIRAGE MGM_MIRAGE_Supp_Data_103007 (17)
MGM MIRAGE MGM_MIRAGE_Supp_Data_103007
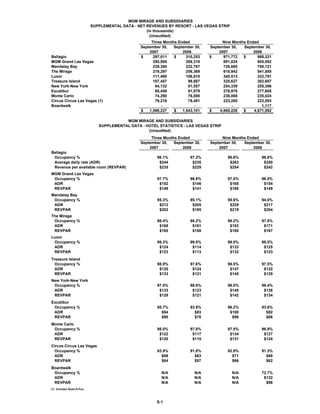
- 1. MGM MIRAGE AND SUBSIDIARIES
SUPPLEMENTAL DATA - NET REVENUES BY RESORT - LAS VEGAS STRIP
(In thousands)
(Unaudited)
Three Months Ended Nine Months Ended
September 30, September 30, September 30, September 30,
2007 2006 2007 2006
Bellagio $ 297,011 $ 310,253 $ 971,772 $ 988,321
MGM Grand Las Vegas 290,506 269,318 891,024 805,092
Mandalay Bay 239,380 222,767 726,680 708,121
The Mirage 219,297 206,369 618,942 541,885
Luxor 111,490 106,810 340,513 332,791
Treasure Island 107,457 99,887 325,627 302,657
New York-New York 84,132 81,557 254,339 255,386
Excalibur 95,458 91,579 276,978 277,605
Monte Carlo 74,290 76,080 236,068 235,024
Circus Circus Las Vegas (1) 79,216 78,481 223,285 223,093
Boardwalk - - - 1,117
$ 1,598,237 $ 1,543,101 $ 4,865,228 $ 4,671,092
MGM MIRAGE AND SUBSIDIARIES
SUPPLEMENTAL DATA - HOTEL STATISTICS - LAS VEGAS STRIP
(Unaudited)
Three Months Ended Nine Months Ended
September 30, September 30, September 30, September 30,
2007 2006 2007 2006
Bellagio
Occupancy % 96.1% 97.2% 96.6% 96.8%
Average daily rate (ADR) $244 $235 $263 $250
Revenue per available room (REVPAR) $235 $229 $254 $242
MGM Grand Las Vegas
Occupancy % 97.7% 96.8% 97.0% 96.5%
ADR $152 $146 $165 $154
REVPAR $149 $141 $160 $149
Mandalay Bay
Occupancy % 95.3% 95.1% 95.6% 94.0%
ADR $212 $205 $229 $217
REVPAR $202 $195 $219 $204
The Mirage
Occupancy % 98.4% 98.2% 98.2% 97.8%
ADR $168 $161 $183 $171
REVPAR $165 $158 $180 $167
Luxor
Occupancy % 99.3% 99.0% 99.0% 98.5%
ADR $124 $114 $133 $125
REVPAR $123 $113 $132 $123
Treasure Island
Occupancy % 98.9% 97.6% 98.5% 97.5%
ADR $135 $124 $147 $132
REVPAR $133 $121 $145 $129
New York-New York
Occupancy % 97.5% 98.6% 98.0% 98.4%
ADR $133 $123 $145 $136
REVPAR $129 $121 $142 $134
Excalibur
Occupancy % 95.7% 93.9% 96.2% 93.6%
ADR $94 $83 $100 $92
REVPAR $90 $78 $96 $86
Monte Carlo
Occupancy % 98.0% 97.8% 97.5% 96.9%
ADR $122 $117 $134 $127
REVPAR $120 $115 $131 $124
Circus Circus Las Vegas
Occupancy % 93.9% 91.8% 92.9% 91.3%
ADR $69 $63 $71 $68
REVPAR $64 $57 $66 $62
Boardwalk
Occupancy % N/A N/A N/A 72.7%
ADR N/A N/A N/A $132
REVPAR N/A N/A N/A $96
(1) Includes Slots-A-Fun.
S-1
- 2. MGM MIRAGE AND SUBSIDIARIES
SUPPLEMENTAL DATA - PROPERTY EBITDA BY RESORT - LAS VEGAS STRIP
(In thousands)
(Unaudited)
Three Months Ended Nine Months Ended
September 30, September 30, September 30, September 30,
2007 2006 2007 2006
Bellagio $ 83,938 $ 98,168 $ 322,253 $ 339,635
MGM Grand Las Vegas 81,811 83,630 284,985 239,659
Mandalay Bay 60,120 60,014 211,407 214,996
The Mirage 71,751 70,037 184,438 177,345
Luxor 40,606 37,502 130,418 122,592
Treasure Island 30,569 25,937 98,277 86,319
New York-New York 34,447 33,665 106,641 109,156
Excalibur 36,236 33,336 106,177 104,878
Monte Carlo 21,791 27,479 86,992 82,648
Circus Circus Las Vegas (1) 22,223 21,481 64,330 62,203
CityCenter (13,894) (4,628) (46,254) (9,474)
Boardwalk - - - (1,840)
$ 469,598 $ 486,621 $ 1,549,664 $ 1,528,117
MGM MIRAGE AND SUBSIDIARIES
DETAIL OF CERTAIN CHARGES AFFECTING PROPERTY EBITDA - LAS VEGAS STRIP
(In thousands)
(Unaudited)
Three Months Ended September 30, 2007
Preopening and Property
start-up Restructuring transactions,
expenses costs net Total
Bellagio $ - $ - $ 82 $ 82
MGM Grand Las Vegas 33 - 6,893 6,926
Mandalay Bay - - 8,575 8,575
The Mirage - - 939 939
Luxor - - 233 233
Treasure Island - - 93 93
New York-New York 45 - 300 345
Excalibur - - 48 48
Monte Carlo 911 - 572 1,483
Circus Circus Las Vegas (1) - - - -
CityCenter 4,653 - - 4,653
Boardwalk - - - -
$ 5,642 $ - $ 17,735 $ 23,377
Three Months Ended September 30, 2006
Preopening and Property
start-up Restructuring transactions,
expenses costs net Total
Bellagio $ - $ - $ (75) $ (75)
MGM Grand Las Vegas 916 - 104 1,020
Mandalay Bay - - - -
The Mirage - - - -
Luxor - - - -
Treasure Island - - 40 40
New York-New York - - 15 15
Excalibur - - (34) (34)
Monte Carlo 82 - 9 91
Circus Circus Las Vegas (1) - - 10 10
CityCenter 3,000 - - 3,000
Boardwalk - - - -
$ 3,998 $ - $ 69 $ 4,067
(1) Includes Slots-A-Fun.
S-2
- 3. MGM MIRAGE AND SUBSIDIARIES
DETAIL OF CERTAIN CHARGES AFFECTING PROPERTY EBITDA - LAS VEGAS STRIP (Continued)
(In thousands)
(Unaudited)
Nine Months Ended September 30, 2007
Preopening and Property
start-up Restructuring transactions,
expenses costs net Total
Bellagio $ - $ - $ (143) $ (143)
MGM Grand Las Vegas 1,271 - 6,893 8,164
Mandalay Bay - - 9,162 9,162
The Mirage - - 1,165 1,165
Luxor - - 1,892 1,892
Treasure Island - - 100 100
New York-New York 45 - 302 347
Excalibur - - 243 243
Monte Carlo 1,128 - 979 2,107
Circus Circus Las Vegas (1) - - 7 7
Project CityCenter 18,801 - - 18,801
Boardwalk - - - -
$ 21,245 $ - $ 20,600 $ 41,845
Nine Months Ended September 30, 2006
Preopening and Property
start-up Restructuring transactions,
expenses costs (credit) net Total
Bellagio $ - $ - $ 12,259 $ 12,259
MGM Grand Las Vegas 7,651 - 2,071 9,722
Mandalay Bay - - 3,525 3,525
The Mirage 4,534 - 564 5,098
Luxor 497 - 4,221 4,718
Treasure Island 53 - 269 322
New York-New York - - 9 9
Excalibur - - 339 339
Monte Carlo 82 - 9,368 9,450
Circus Circus Las Vegas (1) - - 10 10
Project CityCenter 6,207 - - 6,207
Boardwalk - 1,035 - 1,035
$ 19,024 $ 1,035 $ 32,635 $ 52,694
MGM MIRAGE AND SUBSIDIARIES
SUPPLEMENTAL DATA - RECONCILIATION OF OPERATING INCOME
TO PROPERTY EBITDA - LAS VEGAS STRIP
(In thousands)
(Unaudited)
Three Months Ended September 30, 2007
Depreciation
Operating and
income (loss) amortization EBITDA
Bellagio $ 52,465 $ 31,473 $ 83,938
MGM Grand Las Vegas 57,973 23,838 81,811
Mandalay Bay 37,359 22,761 60,120
The Mirage 57,114 14,637 71,751
Luxor 30,739 9,867 40,606
Treasure Island 22,627 7,942 30,569
New York-New York 26,973 7,474 34,447
Excalibur 30,937 5,299 36,236
Monte Carlo 16,266 5,525 21,791
Circus Circus Las Vegas (1) 16,994 5,229 22,223
CityCenter (15,229) 1,335 (13,894)
Boardwalk - - -
$ 334,218 $ 135,380 $ 469,598
(1) Includes Slots-A-Fun.
S-3
- 4. MGM MIRAGE AND SUBSIDIARIES
SUPPLEMENTAL DATA - RECONCILIATION OF OPERATING INCOME
TO PROPERTY EBITDA - LAS VEGAS STRIP (Continued)
(In thousands)
(Unaudited)
Three Months Ended September 30, 2006
Depreciation
Operating and
income (loss) amortization EBITDA
Bellagio $ 66,612 $ 31,556 $ 98,168
MGM Grand Las Vegas 60,501 23,129 83,630
Mandalay Bay 40,259 19,755 60,014
The Mirage 54,539 15,498 70,037
Luxor 27,469 10,033 37,502
Treasure Island 18,408 7,529 25,937
New York-New York 25,251 8,414 33,665
Excalibur 28,785 4,551 33,336
Monte Carlo 21,804 5,675 27,479
Circus Circus Las Vegas (1) 16,282 5,199 21,481
CityCenter (4,628) - (4,628)
Boardwalk - - -
$ 355,282 $ 131,339 $ 486,621
Nine Months Ended September 30, 2007
Depreciation
Operating and
income (loss) amortization EBITDA
Bellagio $ 229,341 $ 92,912 $ 322,253
MGM Grand Las Vegas 211,822 73,163 284,985
Mandalay Bay 145,157 66,250 211,407
The Mirage 140,355 44,083 184,438
Luxor 101,452 28,966 130,418
Treasure Island 74,787 23,490 98,277
New York-New York 83,728 22,913 106,641
Excalibur 89,719 16,458 106,177
Monte Carlo 70,427 16,565 86,992
Circus Circus Las Vegas (1) 48,735 15,595 64,330
Project CityCenter (48,629) 2,375 (46,254)
Boardwalk - - -
$ 1,146,894 $ 402,770 $ 1,549,664
Nine Months Ended September 30, 2006
Depreciation
Operating and
income (loss) amortization EBITDA
Bellagio $ 246,547 $ 93,088 $ 339,635
MGM Grand Las Vegas 164,459 75,200 239,659
Mandalay Bay 154,328 60,668 214,996
The Mirage 134,707 42,638 177,345
Luxor 93,345 29,247 122,592
Treasure Island 64,737 21,582 86,319
New York-New York 84,042 25,114 109,156
Excalibur 91,312 13,566 104,878
Monte Carlo 62,648 20,000 82,648
Circus Circus Las Vegas (1) 46,467 15,736 62,203
Project CityCenter (9,474) - (9,474)
Boardwalk (1,840) - (1,840)
$ 1,131,278 $ 396,839 $ 1,528,117
(1) Includes Slots-A-Fun.
S-4