MGM Resorts Las Vegas Strip Revenue and Property EBITDA Q1 2008
- 1. MGM MIRAGE AND SUBSIDIARIES
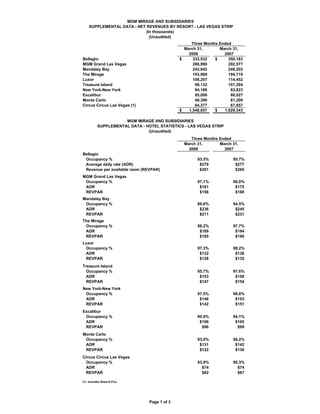
SUPPLEMENTAL DATA - NET REVENUES BY RESORT - LAS VEGAS STRIP
(In thousands)
(Unaudited)
Three Months Ended
March 31, March 31,
2008 2007
Bellagio $ 333,932 $ 350,183
MGM Grand Las Vegas 286,990 292,577
Mandalay Bay 243,842 248,202
The Mirage 193,989 194,719
Luxor 108,207 114,452
Treasure Island 99,132 107,294
New York-New York 84,186 83,823
Excalibur 85,006 86,027
Monte Carlo 48,396 81,209
Circus Circus Las Vegas (1) 64,377 67,857
$ 1,548,057 $ 1,626,343
MGM MIRAGE AND SUBSIDIARIES
SUPPLEMENTAL DATA - HOTEL STATISTICS - LAS VEGAS STRIP
(Unaudited)
Three Months Ended
March 31, March 31,
2008 2007
Bellagio
Occupancy % 93.5% 95.7%
Average daily rate (ADR) $279 $277
Revenue per available room (REVPAR) $261 $265
MGM Grand Las Vegas
Occupancy % 97.1% 96.0%
ADR $161 $175
REVPAR $156 $168
Mandalay Bay
Occupancy % 89.6% 94.5%
ADR $236 $245
REVPAR $211 $231
The Mirage
Occupancy % 98.2% 97.7%
ADR $189 $194
REVPAR $185 $190
Luxor
Occupancy % 97.3% 98.2%
ADR $132 $138
REVPAR $128 $135
Treasure Island
Occupancy % 95.7% 97.6%
ADR $153 $158
REVPAR $147 $154
New York-New York
Occupancy % 97.5% 98.8%
ADR $146 $153
REVPAR $142 $151
Excalibur
Occupancy % 90.9% 94.1%
ADR $106 $105
REVPAR $96 $99
Monte Carlo
Occupancy % 93.0% 96.2%
ADR $131 $142
REVPAR $122 $136
Circus Circus Las Vegas
Occupancy % 83.9% 90.3%
ADR $74 $74
REVPAR $62 $67
(1) Includes Slots-A-Fun.
Page 1 of 3
- 2. MGM MIRAGE AND SUBSIDIARIES
SUPPLEMENTAL DATA - PROPERTY EBITDA BY RESORT - LAS VEGAS STRIP
(In thousands)
(Unaudited)
Three Months Ended
March 31, March 31,
2008 2007
Bellagio $ 109,869 $ 131,614
MGM Grand Las Vegas 79,945 95,669
Mandalay Bay 74,366 83,655
The Mirage 51,499 53,811
Luxor 40,003 45,600
Treasure Island 29,589 33,687
New York-New York 34,294 34,904
Excalibur 31,372 31,560
Monte Carlo 13,628 33,567
Circus Circus Las Vegas (1) 14,931 18,749
CityCenter - (13,974)
$ 479,496 $ 548,842
MGM MIRAGE AND SUBSIDIARIES
DETAIL OF CERTAIN CHARGES AFFECTING PROPERTY EBITDA - LAS VEGAS STRIP
(In thousands)
(Unaudited)
Three Months Ended March 31, 2008
Preopening and Property
start-up Restructuring transactions,
expenses costs net Total
Bellagio $ - $ - $ 1,099 $ 1,099
MGM Grand Las Vegas 164 - 2 166
Mandalay Bay - - 1,138 1,138
The Mirage - - 395 395
Luxor - - 2 2
Treasure Island - - 73 73
New York-New York 62 - - 62
Excalibur - - (3) (3)
Monte Carlo - 75 83 158
Circus Circus Las Vegas (1) - 254 - 254
CityCenter - - - -
$ 226 $ 329 $ 2,789 $ 3,344
Three Months Ended March 31, 2007
Preopening and Property
start-up Restructuring transactions,
expenses costs net Total
Bellagio $ - $ - $ (275) $ (275)
MGM Grand Las Vegas 220 - - 220
Mandalay Bay - - 17 17
The Mirage - - - -
Luxor - - (25) (25)
Treasure Island - - (3) (3)
New York-New York - - - -
Excalibur - - 189 189
Monte Carlo 110 - 368 478
Circus Circus Las Vegas (1) - - 7 7
CityCenter 8,142 - - 8,142
$ 8,472 $ - $ 278 $ 8,750
(1) Includes Slots-A-Fun.
Page 2 of 3
- 3. MGM MIRAGE AND SUBSIDIARIES
SUPPLEMENTAL DATA - RECONCILIATION OF OPERATING INCOME
TO PROPERTY EBITDA - LAS VEGAS STRIP
(In thousands)
(Unaudited)
Three Months Ended March 31, 2008
Depreciation
Operating and
income (loss) amortization EBITDA
Bellagio $ 75,822 $ 34,047 $ 109,869
MGM Grand Las Vegas 55,029 24,916 79,945
Mandalay Bay 49,142 25,224 74,366
The Mirage 36,672 14,827 51,499
Luxor 27,486 12,517 40,003
Treasure Island 21,259 8,330 29,589
New York-New York 25,912 8,382 34,294
Excalibur 24,651 6,721 31,372
Monte Carlo 7,609 6,019 13,628
Circus Circus Las Vegas (1) 9,715 5,216 14,931
CityCenter - - -
$ 333,297 $ 146,199 $ 479,496
Three Months Ended March 31, 2007
Depreciation
Operating and
income (loss) amortization EBITDA
Bellagio $ 100,643 $ 30,971 $ 131,614
MGM Grand Las Vegas 71,231 24,438 95,669
Mandalay Bay 62,297 21,358 83,655
The Mirage 38,260 15,551 53,811
Luxor 36,122 9,478 45,600
Treasure Island 25,849 7,838 33,687
New York-New York 27,295 7,609 34,904
Excalibur 26,023 5,537 31,560
Monte Carlo 28,176 5,391 33,567
Circus Circus Las Vegas (1) 13,604 5,145 18,749
CityCenter (14,555) 581 (13,974)
$ 414,945 $ 133,897 $ 548,842
(1) Includes Slots-A-Fun.
Page 3 of 3