1. SLM CORPORATION
Supplemental Earnings Disclosure
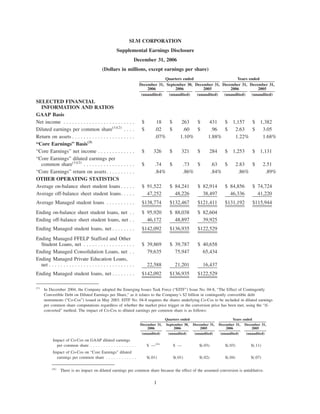
December 31, 2006
(Dollars in millions, except earnings per share)
Quarters ended Years ended
December 31, September 30, December 31, December 31, December 31,
2006 2006 2005 2006 2005
(unaudited) (unaudited) (unaudited) (unaudited) (unaudited)
SELECTED FINANCIAL
INFORMATION AND RATIOS
GAAP Basis
Net income . . . . . . . . . . . . . . . . . . . . . . . . . $ 18 $ 263 $ 431 $ 1,157 $ 1,382
Diluted earnings per common share(1)(2) . . . . $ .02 $ .60 $ .96 $ 2.63 $ 3.05
Return on assets . . . . . . . . . . . . . . . . . . . . . . .07% 1.10% 1.88% 1.22% 1.68%
“Core Earnings” Basis(3)
“Core Earnings” net income . . . . . . . . . . . . . $ 326 $ 321 $ 284 $ 1,253 $ 1,131
“Core Earnings” diluted earnings per
common share(1)(2) . . . . . . . . . . . . . . . . . . $ .74 $ .73 $ .63 $ 2.83 $ 2.51
“Core Earnings” return on assets . . . . . . . . . . .84% .86% .84% .86% .89%
OTHER OPERATING STATISTICS
Average on-balance sheet student loans . . . . . $ 91,522 $ 84,241 $ 82,914 $ 84,856 $ 74,724
Average off-balance sheet student loans. . . . . 47,252 48,226 38,497 46,336 41,220
Average Managed student loans . . . . . . . . . . $138,774 $132,467 $121,411 $131,192 $115,944
Ending on-balance sheet student loans, net . . $ 95,920 $ 88,038 $ 82,604
Ending off-balance sheet student loans, net . . 46,172 48,897 39,925
Ending Managed student loans, net . . . . . . . . $142,092 $136,935 $122,529
Ending Managed FFELP Stafford and Other
Student Loans, net . . . . . . . . . . . . . . . . . . $ 39,869 $ 39,787 $ 40,658
Ending Managed Consolidation Loans, net . . 79,635 75,947 65,434
Ending Managed Private Education Loans,
net . . . . . . . . . . . . . . . . . . . . . . . . . . . . . . 22,588 21,201 16,437
Ending Managed student loans, net . . . . . . . . $142,092 $136,935 $122,529
(1)
In December 2004, the Company adopted the Emerging Issues Task Force (“EITF”) Issue No. 04-8, “The Effect of Contingently
Convertible Debt on Diluted Earnings per Share,” as it relates to the Company’s $2 billion in contingently convertible debt
instruments (“Co-Cos”) issued in May 2003. EITF No. 04-8 requires the shares underlying Co-Cos to be included in diluted earnings
per common share computations regardless of whether the market price trigger or the conversion price has been met, using the “if-
converted” method. The impact of Co-Cos to diluted earnings per common share is as follows:
Quarters ended Years ended
December 31, September 30, December 31, December 31, December 31,
2006 2006 2005 2006 2005
(unaudited) (unaudited) (unaudited) (unaudited) (unaudited)
Impact of Co-Cos on GAAP diluted earnings
$ —(A)
per common share . . . . . . . . . . . . . . . . . . $— $(.03) $(.03) $(.11)
Impact of Co-Cos on “Core Earnings” diluted
earnings per common share . . . . . . . . . . . . $(.01) $(.01) $(.02) $(.04) $(.07)
(A)
There is no impact on diluted earnings per common share because the effect of the assumed conversion is antidilutive.
1
2. (2)
During the first quarter of 2006, the Company adopted the Financial Accounting Standards Board’s (“FASB’s”) Statement of
Financial Accounting Standards (“SFAS”) No. 123(R), “Share-Based Payment,” which is a revision of SFAS No. 123, “Accounting
for Stock-Based Compensation.” SFAS No. 123(R) requires all share based payments to employees to be recognized in the income
statement based on their fair values. For the quarters ended December 31, 2006 and September 30, 2006, reported net income
attributable to common stock included $9 million and $10 million, respectively, related to stock option compensation expense, net of
related tax effects. The following table is a pro forma presentation of the Company’s results had SFAS No. 123(R) been in effect for
all periods presented.
Quarters ended Years ended
December 31, September 30, December 31, December 31, December 31,
2006 2006 2005 2006 2005
(unaudited) (unaudited) (unaudited) (unaudited) (unaudited)
Pro forma GAAP diluted earnings per common
share . . . . . . . . . . . . . . . . . . . . . . . . . . . . . . $.02 $.60 $.93 $2.63 $2.97
Pro forma “Core Earnings” diluted earnings per
common share . . . . . . . . . . . . . . . . . . . . . . . . $.74 $.73 $.61 $2.83 $2.43
(3)
See explanation of “Core Earnings” performance measures under “Reconciliation of ‘Core Earnings’ Net Income to GAAP Net
Income.”
2
5. SLM CORPORATION
Segment and “Core Earnings”
Consolidated Statements of Income
(In thousands)
Quarter ended December 31, 2006
Corporate Total ‘‘Core Total
Lending DMO and Other Earnings” Adjustments GAAP
(unaudited)
Interest income:
FFELP Stafford and Other
Student Loans . . . . . . . . . . . $ 700,961 $ — $ — $ 700,961 $ (292,234) $ 408,727
Consolidation Loans . . . . . . . . 1,305,744 — — 1,305,744 (338,904) 966,840
Private Education Loans . . . . . 620,092 — — 620,092 (328,667) 291,425
Other loans . . . . . . . . . . . . . . . 26,556 — — 26,556 — 26,556
Cash and investments . . . . . . . 197,161 — 2,225 199,386 (58,231) 141,155
Total interest income . . . . . . . . . . 2,850,514 — 2,225 2,852,739 (1,018,036) 1,834,703
Total interest expense . . . . . . . . . 2,189,781 6,440 5,630 2,201,851 (739,118) 1,462,733
Net interest income . . . . . . . . . . . 660,733 (6,440) (3,405) 650,888 (278,918) 371,970
Less: provisions for losses . . . . . . 87,895 — 298 88,193 3,812 92,005
Net interest income after
provisions for losses . . . . . . . . 572,838 (6,440) (3,703) 562,695 (282,730) 279,965
Fee income . . . . . . . . . . . . . . . . . — 92,501 33,089 125,590 — 125,590
Collections revenue . . . . . . . . . . . — 57,473 — 57,473 405 57,878
Other income . . . . . . . . . . . . . . . 40,034 — 59,690 99,724 (80,090) 19,634
Total other income . . . . . . . . . . . 40,034 149,974 92,779 282,787 (79,685) 203,102
Operating expenses(1) . . . . . . . . . 164,289 91,833 71,567 327,689 25,058 352,747
Income before income taxes and
minority interest in net
earnings of subsidiaries . . . . . . 448,583 51,701 17,509 517,793 (387,473) 130,320
Income tax expense(2) . . . . . . . . . 165,976 19,178 6,429 191,583 (79,831) 111,752
Minority interest in net earnings
of subsidiaries . . . . . . . . . . . . . — 463 — 463 — 463
Net income . . . . . . . . . . . . . . . . . $ 282,607 $ 32,060 $11,080 $ 325,747 $ (307,642) $ 18,105
(1)
Operating expenses for the Lending, DMO, and Corporate and Other business segments include $8 million, $3 million, and $3 million,
respectively, of stock option compensation expense due to the implementation of SFAS No. 123(R) in the first quarter of 2006.
(2)
Income taxes are based on a percentage of net income before tax for the individual reportable segment.
5
6. Quarter ended September 30, 2006
Corporate Total ‘‘Core Total
Lending DMO and Other Earnings” Adjustments GAAP
(unaudited)
Interest income:
FFELP Stafford and Other Student
Loans . . . . . . . . . . . . . . . . . . . . . . . . $ 701,615 $ — $ — $ 701,615 $ (336,994) $ 364,621
Consolidation Loans . . . . . . . . . . . . . . . 1,241,999 — — 1,241,999 (325,908) 916,091
Private Education Loans . . . . . . . . . . . . . 557,787 — — 557,787 (303,040) 254,747
Other loans . . . . . . . . . . . . . . . . . . . . . . 24,550 — — 24,550 — 24,550
Cash and investments . . . . . . . . . . . . . . . 206,837 — 2,782 209,619 (68,536) 141,083
Total interest income . . . . . . . . . . . . . . . . . 2,732,788 — 2,782 2,735,570 (1,034,478) 1,701,092
Total interest expense . . . . . . . . . . . . . . . . 2,124,587 6,088 3,515 2,134,190 (770,919) 1,363,271
Net interest income . . . . . . . . . . . . . . . . . . 608,201 (6,088) (733) 601,380 (263,559) 337,821
Less: provisions for losses . . . . . . . . . . . . . 79,774 — (3) 79,771 (12,529) 67,242
Net interest income after provisions for
losses . . . . . . . . . . . . . . . . . . . . . . . . . . 528,427 (6,088) (730) 521,609 (251,030) 270,579
Fee income . . . . . . . . . . . . . . . . . . . . . . . — 122,556 38,848 161,404 — 161,404
Collections revenue . . . . . . . . . . . . . . . . . . — 57,744 — 57,744 169 57,913
Other income . . . . . . . . . . . . . . . . . . . . . . 46,074 — 40,988 87,062 244,793 331,855
Total other income . . . . . . . . . . . . . . . . . . 46,074 180,300 79,836 306,210 244,962 551,172
Operating expenses(1) . . . . . . . . . . . . . . . . 156,168 91,341 69,644 317,153 36,341 353,494
Income before income taxes and minority
interest in net earnings of subsidiaries . .. 418,333 82,871 9,462 510,666 (42,409) 468,257
Income tax expense(2) . . . . . . . . . . . . . . .. 154,783 30,662 3,502 188,947 14,739 203,686
Minority interest in net earnings of
subsidiaries . . . . . . . . . . . . . . . . . . . . .. — 1,099 — 1,099 — 1,099
Net income . . . . . . . . . . . . . . . . . . . . . .. $ 263,550 $ 51,110 $ 5,960 $ 320,620 $ (57,148) $ 263,472
(1)
Operating expenses for the Lending, DMO, and Corporate and Other business segments include $8 million, $4 million, and $4 million,
respectively, of stock option compensation expense due to the implementation of SFAS No. 123(R) in the first quarter of 2006.
(2)
Income taxes are based on a percentage of net income before tax for the individual reportable segment.
6
7. Quarter ended December 31, 2005
Corporate Total “Core Total
Lending(2) DMO(2) and Other(2) Earnings” Adjustments GAAP
(unaudited)
Interest income:
FFELP Stafford and Other Student
Loans . . . . . . . . . . . . . . . . . . . . . . . $ 619,987 $ — $ — $ 619,987 $(304,823) $ 315,164
Consolidation Loans . . . . . . . . . . . . . . 934,096 — — 934,096 (173,758) 760,338
Private Education Loans . . . . . . . . . . . . 373,801 — — 373,801 (169,809) 203,992
Other loans . . . . . . . . . . . . . . . . . . . . . 22,851 — — 22,851 — 22,851
Cash and investments . . . . . . . . . . . . . . 127,418 — 1,564 128,982 (39,061) 89,921
Total interest income . . . . . . . . . . . . . . . . 2,078,153 — 1,564 2,079,717 (687,451) 1,392,266
Total interest expense . . . . . . . . . . . . . . . 1,506,852 5,531 1,455 1,513,838 (511,705) 1,002,133
Net interest income . . . . . . . . . . . . . . . . . 571,301 (5,531) 109 565,879 (175,746) 390,133
Less: provisions for losses . . . . . . . . . . . . 69,243 — (7) 69,236 (3,918) 65,318
Net interest income after provisions for
losses . . . . . . . . . . . . . . . . . . . . . . . . . 502,058 (5,531) 116 496,643 (171,828) 324,815
Fee income . . . . . . . . . . . . . . . . . . . . . . — 98,839 21,555 120,394 — 120,394
Collections revenue . . . . . . . . . . . . . . . . . — 48,112 — 48,112 192 48,304
Other income . . . . . . . . . . . . . . . . . . . . . 37,696 — 28,355 66,051 384,995 451,046
Total other income . . . . . . . . . . . . . . . . . 37,696 146,951 49,910 234,557 385,187 619,744
Operating expenses . . . . . . . . . . . . . . . . . 138,778 83,920 55,895 278,593 18,070 296,663
Income before income taxes and minority
interest in net earnings of subsidiaries . . 400,976 57,500 (5,869) 452,607 195,289 647,896
Income tax expense(1) . . . . . . . . . . . . . . . 148,362 21,275 (2,172) 167,465 48,442 215,907
Minority interest in net earnings of
subsidiaries . . . . . . . . . . . . . . . . . . . . . — 954 — 954 — 954
Net income . . . . . . . . . . . . . . . . . . . . . . $ 252,614 $ 35,271 $ (3,697) $ 284,188 $ 146,847 $ 431,035
(1)
Income taxes are based on a percentage of net income before tax for the individual reportable segment.
(2)
In the first quarter of 2006, the Company changed its method for allocating certain Corporate and Other expenses to the other
business segments. All periods presented have been updated to reflect the new allocation methodology.
7
8. Year ended December 31, 2006
Corporate Total ‘‘Core Total
Lending DMO and Other Earnings” Adjustments GAAP
(unaudited)
Interest income:
FFELP Stafford and Other Student
Loans. . . . . . . . . . . . . . . . . . . . . . . $ 2,771,236 $ —$ — $ 2,771,236 $(1,362,298) $1,408,938
Consolidation Loans . . . . . . . . . . . . . . 4,690,060 — — 4,690,060 (1,144,203) 3,545,857
Private Education Loans . . . . . . . . . . . 2,092,068 — — 2,092,068 (1,070,847) 1,021,221
Other loans . . . . . . . . . . . . . . . . . . . . 97,954 — — 97,954 — 97,954
Cash and investments . . . . . . . . . . . . . 704,336 — 6,989 711,325 (208,323) 503,002
Total interest income . . . . . . . . . . . . . . . 10,355,654 — 6,989 10,362,643 (3,785,671) 6,576,972
Total interest expense . . . . . . . . . . . . . . . 7,877,263 23,150 11,768 7,912,181 (2,789,326) 5,122,855
Net interest income . . . . . . . . . . . . . . . . 2,478,391 (23,150) (4,779) 2,450,462 (996,345) 1,454,117
Less: provisions for losses . . . . . . . . . . . . 302,498 — 282 302,780 (15,818) 286,962
Net interest income after provisions for
losses . . . . . . . . . . . . . . . . . . . . . . . . 2,175,893 (23,150) (5,061) 2,147,682 (980,527) 1,167,155
Fee income . . . . . . . . . . . . . . . . . . . . . . — 396,830 132,100 528,930 — 528,930
Collections revenue . . . . . . . . . . . . . . . . — 238,970 — 238,970 859 239,829
Other income . . . . . . . . . . . . . . . . . . . . . 177,451 — 155,025 332,476 1,073,036 1,405,512
Total other income . . . . . . . . . . . . . . . . . 177,451 635,800 287,125 1,100,376 1,073,895 2,174,271
Operating expenses(1) . . . . . . . . . . . . . . . 645,057 357,797 249,958 1,252,812 93,340 1,346,152
Income before income taxes and minority
interest in net earnings of subsidiaries . . 1,708,287 254,853 32,106 1,995,246 28 1,995,274
Income tax expense(2) . . . . . . . . . . . . . . . 632,067 94,344 11,830 738,241 96,070 834,311
Minority interest in net earnings of
subsidiaries . . . . . . . . . . . . . . . . . . . . — 4,007 — 4,007 — 4,007
Net income . . . . . . . . . . . . . . . . . . . . . . $ 1,076,220 $156,502 $ 20,276 $ 1,252,998 $ (96,042) $1,156,956
(1)
Operating expenses for the Lending, DMO, and Corporate and Other business segments include $34 million, $12 million, and
$17 million, respectively, of stock option compensation expense due to the implementation of SFAS No. 123(R) in the first quarter of
2006.
(2)
Income taxes are based on a percentage of net income before tax for the individual reportable segment.
8
9. Year ended December 31, 2005
Corporate Total ‘‘Core Total
Lending(2) DMO(2) and Other(2) Earnings” Adjustments GAAP
(unaudited)
Interest income:
FFELP Stafford and Other Student
Loans. . . . . . . . . . . . . . . . . . . $2,298,256 $ — $ — $2,298,256 $(1,283,405) $1,014,851
Consolidation Loans . . . . . . . . . . 3,014,383 — — 3,014,383 (514,375) 2,500,008
Private Education Loans . . . . . . . 1,160,239 — — 1,160,239 (526,355) 633,884
Other loans . . . . . . . . . . . . . . . . 84,664 — — 84,664 — 84,664
Cash and investments . . . . . . . . . 395,613 — 4,734 400,347 (123,591) 276,756
Total interest income . . . . . . . . . . . 6,953,155 — 4,734 6,957,889 (2,447,726) 4,510,163
Total interest expense . . . . . . . . . . . 4,797,271 19,176 5,998 4,822,445 (1,763,727) 3,058,718
Net interest income . . . . . . . . . . . . 2,155,884 (19,176) (1,264) 2,135,444 (683,999) 1,451,445
Less: provisions for losses . . . . . . . . 138,026 — 177 138,203 64,803 203,006
Net interest income after provisions
for losses . . . . . . . . . . . . . . . . . . 2,017,858 (19,176) (1,441) 1,997,241 (748,802) 1,248,439
Fee income . . . . . . . . . . . . . . . . . . — 359,907 115,477 475,384 — 475,384
Collections revenue . . . . . . . . . . . . — 166,648 — 166,648 192 166,840
Other income . . . . . . . . . . . . . . . . . 109,700 1 126,086 235,787 1,129,341 1,365,128
Total other income . . . . . . . . . . . . . 109,700 526,556 241,563 877,819 1,129,533 2,007,352
Operating expenses. . . . . . . . . . . . . 547,405 287,050 235,430 1,069,885 68,443 1,138,328
Income before income taxes and
minority interest in net earnings of
subsidiaries . . . . . . . . . . . . . . . . 1,580,153 220,330 4,692 1,805,175 312,288 2,117,463
Income tax expense(1) . . . . . . . . . . . 584,657 81,522 1,736 667,915 60,852 728,767
Minority interest in net earnings of
subsidiaries . . . . . . . . . . . . . . . . 1,749 4,403 — 6,152 260 6,412
Net income . . . . . . . . . . . . . . . . . . $ 993,747 $134,405 $ 2,956 $1,131,108 $ 251,176 $1,382,284
(1)
Income taxes are based on a percentage of net income before tax for the individual reportable segment.
(2)
In the first quarter of 2006, the Company changed its method for allocating certain Corporate and Other expenses to the other
business segments. All periods presented have been updated to reflect the new allocation methodology.
9
10. SLM CORPORATION
Reconciliation of “Core Earnings” Net Income to GAAP Net Income
(In thousands, except per share amounts)
Quarters ended Years ended
December 31, September 30, December 31, December 31, December 31,
2006 2006 2005 2006 2005
(unaudited) (unaudited) (unaudited) (unaudited) (unaudited)
“Core Earnings” net income(A) . . . $ 325,747 $ 320,620 $284,188 $1,252,998 $1,131,108
“Core Earnings” adjustments:
Net impact of securitization
accounting . . . . . . . . . . . . . . . (67,984) 159,468 117,520 532,506 (60,069)
Net impact of derivative
accounting . . . . . . . . . . . . . . . (242,614) (112,699) 149,755 (229,452) 637,460
Net impact of Floor Income . . . . (51,762) (52,781) (56,108) (209,445) (203,943)
Net impact of acquired
intangibles(B) . . . . . . . . . . . . . (25,113) (36,397) (15,878) (93,581) (61,160)
Total “Core Earnings” adjustments
before income taxes and
minority interest in net earnings
of subsidiaries . . . . . . . . . . . . . . (387,473) (42,409) 195,289 28 312,288
Net tax effect(C) . . . . . . . . . . . . . . . 79,831 (14,739) (48,442) (96,070) (60,852)
Total “Core Earnings” adjustments
before minority interest in net
earnings of subsidiaries . . . . . . . (307,642) (57,148) 146,847 (96,042) 251,436
Minority interest in net earnings of
subsidiaries . . . . . . . . . . . . . . . . — — — — (260)
Total “Core Earnings”
adjustments . . . . . . . . . . . . . . . . (307,642) (57,148) 146,847 (96,042) 251,176
GAAP net income . . . . . . . . . . . . $ 18,105 $ 263,472 $431,035 $1,156,956 $1,382,284
GAAP diluted earnings per
common share . . . . . . . . . . . . . . $ .02 $ .60 $ .96 $ 2.63 $ 3.05
(A)
“Core Earnings” diluted earnings per
common share . . . . . . . . . . . . . . . . . $ .74 $ .73 $ .63 $ 2.83 $ 2.51
(B)
Represents goodwill and intangible impairment and the amortization of acquired intangibles.
(C)
Such tax effect is based upon the Company’s “Core Earnings” effective tax rate for the year. The net tax effect results primarily from
the exclusion of the permanent income tax impact of the equity forward contracts.
“Core Earnings”
In accordance with the Rules and Regulations of the Securities and Exchange Commission (“SEC”), we
prepare financial statements in accordance with generally accepted accounting principles in the United States
of America (“GAAP”). In addition to evaluating the Company’s GAAP-based financial information, manage-
ment evaluates the Company’s business segments on a basis that, as allowed under SFAS No. 131, “Disclo-
sures about Segments of an Enterprise and Related Information,” differs from GAAP. We refer to
management’s basis of evaluating our segment results as “Core Earnings” presentations for each business
segment and we refer to this information in our presentations with credit rating agencies and lenders. While
“Core Earnings” are not a substitute for reported results under GAAP, we rely on “Core Earnings” to manage
each operating segment because we believe these measures provide additional information regarding the
operational and performance indicators that are most closely assessed by management.
10
11. Our “Core Earnings” are the primary financial performance measures used by management to evaluate
performance and to allocate resources. Accordingly, financial information is reported to management on a
“Core Earnings” basis by reportable segment, as these are the measures used regularly by our chief operating
decision maker. Our “Core Earnings” are used in developing our financial plans and tracking results, and also
in establishing corporate performance targets and determining incentive compensation. Management believes
this information provides additional insight into the financial performance of the Company’s core business
activities. Our “Core Earnings” are not defined terms within GAAP and may not be comparable to similarly
titled measures reported by other companies. “Core Earnings” reflect only current period adjustments to GAAP
as described below. Accordingly, the Company’s “Core Earnings” presentation does not represent another
comprehensive basis of accounting. A more detailed discussion of the differences between GAAP and “Core
Earnings” follows.
Limitations of “Core Earnings”
While GAAP provides a uniform, comprehensive basis of accounting, for the reasons described above,
management believes that “Core Earnings” are an important additional tool for providing a more complete
understanding of the Company’s results of operations. Nevertheless, “Core Earnings” are subject to certain
general and specific limitations that investors should carefully consider. For example, as stated above, unlike
financial accounting, there is no comprehensive, authoritative guidance for management reporting. Our “Core
Earnings” are not defined terms within GAAP and may not be comparable to similarly titled measures
reported by other companies. Unlike GAAP, “Core Earnings” reflect only current period adjustments to GAAP.
Accordingly, the Company’s “Core Earnings” presentation does not represent a comprehensive basis of
accounting. Investors, therefore, may not compare our Company’s performance with that of other financial
services companies based upon “Core Earnings.” “Core Earnings” results are only meant to supplement GAAP
results by providing additional information regarding the operational and performance indicators that are most
closely used by management, the Company’s board of directors, rating agencies and lenders to assess
performance.
Other limitations arise from the specific adjustments that management makes to GAAP results to derive
“Core Earnings” results. For example, in reversing the unrealized gains and losses that result from
SFAS No. 133, “Accounting for Derivative Instruments and Hedging Activities,” on derivatives that do not
qualify for “hedge treatment,” as well as on derivatives that do qualify but are in part ineffective because they
are not perfect hedges, we focus on the long-term economic effectiveness of those instruments relative to the
underlying hedged item and isolate the effects of interest rate volatility, changing credit spreads and changes
in our stock price on the fair value of such instruments during the period. Under GAAP, the effects of these
factors on the fair value of the derivative instruments (but not on the underlying hedged item) tend to show
more volatility in the short term. While our presentation of our results on a Managed Basis provides important
information regarding the performance of our Managed portfolio, a limitation of this presentation is that we
are presenting the ongoing spread income on loans that have been sold to a trust managed by us. While we
believe that our Managed Basis presentation presents the economic substance of our Managed loan portfolio, it
understates earnings volatility from securitization gains. Our “Core Earnings” results exclude certain Floor
Income, which is real cash income, from our reported results and therefore may understate earnings in certain
periods. Management’s financial planning and valuation of operating results, however, does not take into
account Floor Income because of its inherent uncertainty, except when it is economically hedged through Floor
Income Contracts.
Pre-Tax Differences between “Core Earnings” and GAAP
Our “Core Earnings” are the primary financial performance measures used by management to evaluate
performance and to allocate resources. Accordingly, financial information is reported to management on a
“Core Earnings” basis by reportable segment, as these are the measures used regularly by our chief operating
decision maker. Our “Core Earnings” are used in developing our financial plans and tracking results, and also
in establishing corporate performance targets and determining incentive compensation. Management believes
this information provides additional insight into the financial performance of the Company’s core business
11
12. activities. “Core Earnings” reflect only current period adjustments to GAAP, as described in the more detailed
discussion of the differences between GAAP and “Core Earnings” that follows, which includes further detail
on each specific adjustment required to reconcile our “Core Earnings” segment presentation to our GAAP
earnings.
1) Securitization Accounting: Under GAAP, certain securitization transactions in our Lending operating
segment are accounted for as sales of assets. Under “Core Earnings” for the Lending operating
segment, we present all securitization transactions on a Managed Basis as long-term non-recourse
financings. The upfront “gains” on sale from securitization transactions as well as ongoing “servicing
and securitization revenue” presented in accordance with GAAP are excluded from “Core Earnings”
and are replaced by the interest income, provisions for loan losses, and interest expense as they are
earned or incurred on the securitization loans. We also exclude transactions with our off-balance sheet
trusts from “Core Earnings” as they are considered intercompany transactions on a Managed Basis.
2) Derivative Accounting: “Core Earnings” exclude periodic unrealized gains and losses arising
primarily in our Lending business segment, and to a lesser degree in our Corporate and Other business
segment, that are caused primarily by the one-sided mark-to-market derivative valuations prescribed
by SFAS No. 133 on derivatives that do not qualify for “hedge treatment” under GAAP. Under “Core
Earnings,” we recognize the economic effect of these hedges, which generally results in any cash paid
or received being recognized ratably as an expense or revenue over the hedged item’s life. “Core
Earnings” also exclude the gain or loss on equity forward contracts that under SFAS No. 133 are
required to be accounted for as derivatives and marked-to-market through earnings.
3) Floor Income: The timing and amount (if any) of Floor Income earned in our Lending operating
segment is uncertain and in excess of expected spreads. Therefore, we exclude such income from
“Core Earnings” when it is not economically hedged. We employ derivatives, primarily Floor Income
Contracts and futures, to economically hedge Floor Income. As discussed above in “Derivative
Accounting,” these derivatives do not qualify as effective accounting hedges, and therefore, under
GAAP, they are marked-to-market through the “gains (losses) on derivative and hedging activities,
net” line on the income statement with no offsetting gain or loss recorded for the economically hedged
items. For “Core Earnings,” we reverse the fair value adjustments on the Floor Income Contracts and
futures economically hedging Floor Income and include the amortization of net premiums received in
income.
4) Acquired Intangibles: We exclude goodwill and intangible impairment and the amortization of
acquired intangibles.
12