SlideShare a Scribd company logo
1 of 1
Download to read offline
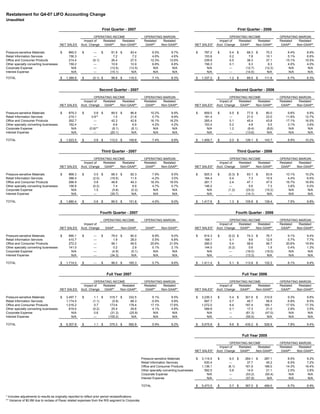
Restatement for Q4-07 LIFO Accounting Change
Unaudited

                                                                        First Quarter - 2007                                                                            First Quarter - 2006
                                                                OPERATING INCOME                        OPERATING MARGIN                                           OPERATING INCOME               OPERATING MARGIN
                                                         Impact of  Restated   Restated                 Restated  Restated                                  Impact of  Restated   Restated        Restated  Restated
                                       NET SALES       Acct. Change  GAAP*    Non-GAAP*                  GAAP*   Non-GAAP*                 NET SALES*     Acct. Change  GAAP*    Non-GAAP*         GAAP*   Non-GAAP*

Pressure-sensitive Materials          $       860.0     $        ---  $         81.9 $      83.4             9.5%         9.7%             $     787.2    $      0.4    $      66.3 $     70.3        8.4%      8.9%
Retail Information Services                   156.3              ---             7.2         7.2             4.6%         4.6%                   153.8           0.2            7.8       10.1        5.1%      6.6%
Office and Consumer Products                  214.4             (0.1)           26.4        27.0            12.3%        12.6%                   239.9           0.5           36.3       37.1       15.1%     15.5%
Other specialty converting businesses         159.2              ---            10.9        10.9             6.8%         6.8%                   156.3           0.1            6.3        6.3        4.0%      4.0%
Corporate Expense                              N/A               ---           (12.5)      (12.5)             N/A          N/A                    N/A            ---          (12.7)     (12.2)        N/A       N/A
Interest Expense                               N/A               ---           (15.1)       N/A               N/A          N/A                    N/A            ---          (14.5)      N/A          N/A       N/A
TOTAL                                   $   1,389.9     $       (0.1) $         98.8   $   116.0              7.1%        8.3%             $    1,337.2   $      1.2    $     89.5   $   111.6        6.7%      8.3%


                                                                       Second Quarter - 2007                                                                           Second Quarter - 2006
                                                                OPERATING INCOME                        OPERATING MARGIN                                           OPERATING INCOME               OPERATING MARGIN
                                                         Impact of  Restated   Restated                 Restated  Restated                                  Impact of  Restated   Restated        Restated  Restated
                                       NET SALES       Acct. Change  GAAP*    Non-GAAP*                  GAAP*   Non-GAAP*                 NET SALES*     Acct. Change  GAAP*    Non-GAAP*         GAAP*   Non-GAAP*

Pressure-sensitive Materials          $       879.3     $        0.6    $       89.5 $      86.8            10.2%         9.9%             $     809.5    $      0.5    $      77.9 $     80.0        9.6%      9.9%
Retail Information Services                   219.1            0.9**             1.5        21.6             0.7%         9.9%                   181.4           ---           21.0       23.0       11.6%     12.7%
Office and Consumer Products                  262.7             ---             42.3        42.6            16.1%        16.2%                   265.4           0.1           45.4       43.8       17.1%     16.5%
Other specialty converting businesses         162.4             ---              6.9         6.9             4.2%         4.2%                   153.4           0.2            4.8        5.5        3.1%      3.6%
Corporate Expense                              N/A           (0.9)**            (8.1)       (8.1)             N/A          N/A                    N/A            1.2           (9.4)      (8.6)        N/A       N/A
Interest Expense                               N/A              ---            (20.1)       N/A               N/A          N/A                    N/A            ---          (13.6)      N/A          N/A       N/A

TOTAL                                   $   1,523.5     $       0.6     $      112.0   $   149.8              7.4%        9.8%             $    1,409.7   $      2.0    $    126.1   $   143.7        8.9%     10.2%


                                                                        Third Quarter - 2007                                                                            Third Quarter - 2006
                                                                OPERATING INCOME                        OPERATING MARGIN                                           OPERATING INCOME               OPERATING MARGIN
                                                         Impact of  Restated   Restated                 Restated  Restated                                  Impact of  Restated   Restated        Restated  Restated
                                       NET SALES       Acct. Change  GAAP*    Non-GAAP*                  GAAP*   Non-GAAP*                 NET SALES*     Acct. Change  GAAP*    Non-GAAP*         GAAP*   Non-GAAP*

Pressure-sensitive Materials          $       868.3     $        0.5 $          68.3 $      82.3             7.9%         9.5%             $     825.3    $     (0.3) $        83.1 $     83.9       10.1%     10.2%
Retail Information Services                   388.4             (2.0)          (16.5)       11.5            -4.2%         3.0%                   164.4           0.4            7.3       10.9        4.4%      6.6%
Office and Consumer Products                  266.9              0.8            48.8        49.3            18.3%        18.5%                   281.7           2.4           47.1       47.5       16.7%     16.9%
Other specialty converting businesses         156.8             (0.2)            7.4         8.9             4.7%         5.7%                   146.2           ---            5.6        7.3        3.8%      5.0%
Corporate Expense                              N/A               1.5            (5.8)       (0.2)             N/A          N/A                    N/A           (1.2)         (23.2)     (10.2)        N/A       N/A
Interest Expense                               N/A               ---           (35.7)       N/A               N/A          N/A                    N/A            ---          (14.1)      N/A          N/A       N/A

TOTAL                                   $   1,680.4     $       0.6     $       66.5   $   151.8              4.0%        9.0%             $    1,417.6   $      1.3    $    105.8   $   139.4        7.5%      9.8%


                                                                       Fourth Quarter - 2007                                                                           Fourth Quarter - 2006
                                                                            OPERATING INCOME            OPERATING MARGIN                                           OPERATING INCOME               OPERATING MARGIN
                                                         Impact of                                                                                          Impact of  Restated   Restated        Restated  Restated
                                       NET SALES       Acct. Change         GAAP       Non-GAAP         GAAP*        Non-GAAP*             NET SALES*     Acct. Change  GAAP*    Non-GAAP*         GAAP*   Non-GAAP*

Pressure-sensitive Materials          $       890.1     $       ---     $       79.0 $      80.0             8.9%         9.0%             $     814.3    $     (0.2) $        74.3 $     76.7        9.1%      9.4%
Retail Information Services                   410.7             ---              1.9        28.0             0.5%         6.8%                   168.1           0.1            9.6       12.9        5.7%      7.7%
Office and Consumer Products                  272.2             ---             56.1        59.5            20.6%        21.9%                   285.0           5.4           58.6       56.7       20.6%     19.9%
Other specialty converting businesses         141.0             ---              0.2         2.9             0.1%         2.1%                   144.0          (0.2)           0.6        1.9        0.4%      1.3%
Corporate Expense                              N/A              ---             (4.9)       (5.1)             N/A          N/A                    N/A            ---          (16.0)     (16.0)        N/A       N/A
Interest Expense                               N/A              ---            (34.3)       N/A               N/A          N/A                    N/A            ---          (13.3)      N/A          N/A       N/A

TOTAL                                   $   1,714.0     $       ---     $       98.0   $   165.3              5.7%        9.6%             $    1,411.4   $      5.1    $    113.8   $   132.2        8.1%      9.4%


                                                                             Full Year 2007                                                                                 Full Year 2006
                                                                OPERATING INCOME                        OPERATING MARGIN                                           OPERATING INCOME               OPERATING MARGIN
                                                         Impact of  Restated   Restated                 Restated  Restated                                  Impact of  Restated   Restated        Restated  Restated
                                       NET SALES       Acct. Change  GAAP*    Non-GAAP*                  GAAP*   Non-GAAP*                 NET SALES*     Acct. Change  GAAP*    Non-GAAP*         GAAP*   Non-GAAP*

Pressure-sensitive Materials          $     3,497.7     $        1.1 $         318.7 $     332.5             9.1%         9.5%             $    3,236.3   $      0.4    $    301.6 $     310.9        9.3%      9.6%
Retail Information Services                 1,174.5             (1.1)           (5.9)       68.3            -0.5%         5.8%                    667.7          0.7          45.7        56.9        6.8%      8.5%
Office and Consumer Products                1,016.2              0.7           173.6       178.4            17.1%        17.6%                  1,072.0          8.4         187.4       185.1       17.5%     17.3%
Other specialty converting businesses         619.4             (0.2)           25.4        29.6             4.1%         4.8%                    599.9          0.1          17.3        21.0        2.9%      3.5%
Corporate Expense                              N/A               0.6           (31.3)      (25.9)             N/A          N/A                     N/A           ---         (61.3)      (47.0)        N/A       N/A
Interest Expense                               N/A               ---          (105.2)       N/A               N/A          N/A                     N/A           ---         (55.5)       N/A          N/A       N/A

TOTAL                                   $   6,307.8     $       1.1     $      375.3   $   582.9              5.9%        9.2%             $    5,575.9   $      9.6    $    435.2   $   526.9        7.8%      9.4%


                                                                                                                                                                            Full Year 2005
                                                                                                                                                                   OPERATING INCOME               OPERATING MARGIN
                                                                                                                                                            Impact of  Restated   Restated        Restated  Restated
                                                                                                                                           NET SALES*     Acct. Change  GAAP*    Non-GAAP*         GAAP*   Non-GAAP*

                                                                                                      Pressure-sensitive Materials          $   3,114.5   $      6.0 $       264.1 $     287.1        8.5%      9.2%
                                                                                                      Retail Information Services                 630.4          ---          37.7        45.2        6.0%      7.2%
                                                                                                      Office and Consumer Products              1,136.1         (6.1)        161.9       186.0       14.3%     16.4%
                                                                                                      Other specialty converting businesses       592.5          0.8          14.9        21.1        2.5%      3.6%
                                                                                                      Corporate Expense                            N/A           ---         (53.2)      (50.4)        N/A       N/A
                                                                                                      Interest Expense                             N/A           ---         (57.9)       N/A          N/A       N/A

                                                                                                      TOTAL                                $    5,473.5   $      0.7    $    367.5   $   489.0        6.7%      8.9%


* Includes adjustments to results as originally reported to reflect prior period reclassifications.
** Variance of $0.9M due to reclass of Paxar related expenses from the RIS segment to Corporate.
More Related Content

What's hot

Apre call 1 q11 engfinal_valida
Apre call 1 q11 engfinal_validaApre call 1 q11 engfinal_valida
Apre call 1 q11 engfinal_valida
BRMALLS
 
Apre call 1 q11 engfinal
Apre call 1 q11 engfinalApre call 1 q11 engfinal
Apre call 1 q11 engfinal
BRMALLS
 
danaher 07_4Q_Preso
danaher 07_4Q_Presodanaher 07_4Q_Preso
danaher 07_4Q_Preso
finance24
 
Raytheon Reports 2007 Third Quarter Results
Raytheon Reports 2007 Third Quarter ResultsRaytheon Reports 2007 Third Quarter Results
Raytheon Reports 2007 Third Quarter Results
finance12
 
oshkosh Q308_Slides
oshkosh   Q308_Slidesoshkosh   Q308_Slides
oshkosh Q308_Slides
finance44
 
shaw group 656631FE-D4E6-4F14-A3DB-B8C5E6B7BB07_1Q2009
shaw group 656631FE-D4E6-4F14-A3DB-B8C5E6B7BB07_1Q2009shaw group 656631FE-D4E6-4F14-A3DB-B8C5E6B7BB07_1Q2009
shaw group 656631FE-D4E6-4F14-A3DB-B8C5E6B7BB07_1Q2009
finance36
 
2Q_Adjusted_EPS
2Q_Adjusted_EPS2Q_Adjusted_EPS
2Q_Adjusted_EPS
finance50
 
GM_Earning Release_Q1_08_Chart Set
GM_Earning Release_Q1_08_Chart SetGM_Earning Release_Q1_08_Chart Set
GM_Earning Release_Q1_08_Chart Set
Manya Mohan
 
danaher 07_2Q_Preso
danaher 07_2Q_Presodanaher 07_2Q_Preso
danaher 07_2Q_Preso
finance24
 
symantec Q309EarningsSupplementalFINALII
symantec Q309EarningsSupplementalFINALIIsymantec Q309EarningsSupplementalFINALII
symantec Q309EarningsSupplementalFINALII
finance40
 
Raytheon Reports 2008 First Quarter Results
	Raytheon Reports 2008 First Quarter Results	Raytheon Reports 2008 First Quarter Results
Raytheon Reports 2008 First Quarter Results
finance12
 
LEAR Q407earningsfinal
LEAR Q407earningsfinalLEAR Q407earningsfinal
LEAR Q407earningsfinal
finance16
 
4Q 2008 EARNINGS SLIDESFINAL
4Q 2008 EARNINGS SLIDESFINAL4Q 2008 EARNINGS SLIDESFINAL
4Q 2008 EARNINGS SLIDESFINAL
finance22
 

What's hot (13)

Apre call 1 q11 engfinal_valida
Apre call 1 q11 engfinal_validaApre call 1 q11 engfinal_valida
Apre call 1 q11 engfinal_valida
 
Apre call 1 q11 engfinal
Apre call 1 q11 engfinalApre call 1 q11 engfinal
Apre call 1 q11 engfinal
 
danaher 07_4Q_Preso
danaher 07_4Q_Presodanaher 07_4Q_Preso
danaher 07_4Q_Preso
 
Raytheon Reports 2007 Third Quarter Results
Raytheon Reports 2007 Third Quarter ResultsRaytheon Reports 2007 Third Quarter Results
Raytheon Reports 2007 Third Quarter Results
 
oshkosh Q308_Slides
oshkosh   Q308_Slidesoshkosh   Q308_Slides
oshkosh Q308_Slides
 
shaw group 656631FE-D4E6-4F14-A3DB-B8C5E6B7BB07_1Q2009
shaw group 656631FE-D4E6-4F14-A3DB-B8C5E6B7BB07_1Q2009shaw group 656631FE-D4E6-4F14-A3DB-B8C5E6B7BB07_1Q2009
shaw group 656631FE-D4E6-4F14-A3DB-B8C5E6B7BB07_1Q2009
 
2Q_Adjusted_EPS
2Q_Adjusted_EPS2Q_Adjusted_EPS
2Q_Adjusted_EPS
 
GM_Earning Release_Q1_08_Chart Set
GM_Earning Release_Q1_08_Chart SetGM_Earning Release_Q1_08_Chart Set
GM_Earning Release_Q1_08_Chart Set
 
danaher 07_2Q_Preso
danaher 07_2Q_Presodanaher 07_2Q_Preso
danaher 07_2Q_Preso
 
symantec Q309EarningsSupplementalFINALII
symantec Q309EarningsSupplementalFINALIIsymantec Q309EarningsSupplementalFINALII
symantec Q309EarningsSupplementalFINALII
 
Raytheon Reports 2008 First Quarter Results
	Raytheon Reports 2008 First Quarter Results	Raytheon Reports 2008 First Quarter Results
Raytheon Reports 2008 First Quarter Results
 
LEAR Q407earningsfinal
LEAR Q407earningsfinalLEAR Q407earningsfinal
LEAR Q407earningsfinal
 
4Q 2008 EARNINGS SLIDESFINAL
4Q 2008 EARNINGS SLIDESFINAL4Q 2008 EARNINGS SLIDESFINAL
4Q 2008 EARNINGS SLIDESFINAL
 

Similar to RestatementLIFO

shaw group 656631FE-D4E6-4F14-A3DB-B8C5E6B7BB07_1Q2009
shaw group 656631FE-D4E6-4F14-A3DB-B8C5E6B7BB07_1Q2009shaw group 656631FE-D4E6-4F14-A3DB-B8C5E6B7BB07_1Q2009
shaw group 656631FE-D4E6-4F14-A3DB-B8C5E6B7BB07_1Q2009
finance36
 
goodrich 3Q07Slides
goodrich  3Q07Slidesgoodrich  3Q07Slides
goodrich 3Q07Slides
finance44
 
goodrich 3Q07Slides
goodrich  3Q07Slidesgoodrich  3Q07Slides
goodrich 3Q07Slides
finance44
 
PMorgan Basics & Industrials Conference
PMorgan Basics & Industrials ConferencePMorgan Basics & Industrials Conference
PMorgan Basics & Industrials Conference
finance10
 
goodrich 4Q07Slides
goodrich  4Q07Slidesgoodrich  4Q07Slides
goodrich 4Q07Slides
finance44
 
goodrich 4Q07Slides
goodrich  4Q07Slidesgoodrich  4Q07Slides
goodrich 4Q07Slides
finance44
 
omnicom group Q3 2006 Investor Presentation
omnicom group  Q3 2006 Investor Presentationomnicom group  Q3 2006 Investor Presentation
omnicom group Q3 2006 Investor Presentation
finance22
 
1Q07 EARNINGS Slides
1Q07 EARNINGS Slides1Q07 EARNINGS Slides
1Q07 EARNINGS Slides
finance22
 
northrop grumman Q4 and Year-End 2006 Slide Presentation
northrop grumman Q4 and Year-End 2006 Slide Presentationnorthrop grumman Q4 and Year-End 2006 Slide Presentation
northrop grumman Q4 and Year-End 2006 Slide Presentation
finance8
 
sonic automotive SAHPressReleaseQ208July29
sonic automotive SAHPressReleaseQ208July29sonic automotive SAHPressReleaseQ208July29
sonic automotive SAHPressReleaseQ208July29
finance43
 
omnicom group annual reports 2004
omnicom group annual reports 2004omnicom group annual reports 2004
omnicom group annual reports 2004
finance22
 
omnicare annual reports 2004
omnicare annual reports 2004omnicare annual reports 2004
omnicare annual reports 2004
finance46
 
northrop grumman Slide Presentation 2007 2007 2nd
northrop grumman  Slide Presentation 2007 2007 2ndnorthrop grumman  Slide Presentation 2007 2007 2nd
northrop grumman Slide Presentation 2007 2007 2nd
finance8
 
omnicom group Q4 2006 Investor Presentation
omnicom group  Q4 2006 Investor Presentationomnicom group  Q4 2006 Investor Presentation
omnicom group Q4 2006 Investor Presentation
finance22
 
dover 4Q07_Slides_9532
dover 4Q07_Slides_9532dover 4Q07_Slides_9532
dover 4Q07_Slides_9532
finance30
 
goodrich 3Q06
goodrich  3Q06goodrich  3Q06
goodrich 3Q06
finance44
 

Similar to RestatementLIFO (20)

shaw group 656631FE-D4E6-4F14-A3DB-B8C5E6B7BB07_1Q2009
shaw group 656631FE-D4E6-4F14-A3DB-B8C5E6B7BB07_1Q2009shaw group 656631FE-D4E6-4F14-A3DB-B8C5E6B7BB07_1Q2009
shaw group 656631FE-D4E6-4F14-A3DB-B8C5E6B7BB07_1Q2009
 
goodrich 3Q07Slides
goodrich  3Q07Slidesgoodrich  3Q07Slides
goodrich 3Q07Slides
 
goodrich 3Q07Slides
goodrich  3Q07Slidesgoodrich  3Q07Slides
goodrich 3Q07Slides
 
PMorgan Basics & Industrials Conference
PMorgan Basics & Industrials ConferencePMorgan Basics & Industrials Conference
PMorgan Basics & Industrials Conference
 
LAN 4Q 2008 Earnings report
LAN 4Q 2008 Earnings reportLAN 4Q 2008 Earnings report
LAN 4Q 2008 Earnings report
 
goodrich 4Q07Slides
goodrich  4Q07Slidesgoodrich  4Q07Slides
goodrich 4Q07Slides
 
goodrich 4Q07Slides
goodrich  4Q07Slidesgoodrich  4Q07Slides
goodrich 4Q07Slides
 
omnicom group Q3 2006 Investor Presentation
omnicom group  Q3 2006 Investor Presentationomnicom group  Q3 2006 Investor Presentation
omnicom group Q3 2006 Investor Presentation
 
1Q07 EARNINGS Slides
1Q07 EARNINGS Slides1Q07 EARNINGS Slides
1Q07 EARNINGS Slides
 
northrop grumman Q4 and Year-End 2006 Slide Presentation
northrop grumman Q4 and Year-End 2006 Slide Presentationnorthrop grumman Q4 and Year-End 2006 Slide Presentation
northrop grumman Q4 and Year-End 2006 Slide Presentation
 
4 q08
4 q084 q08
4 q08
 
sonic automotive SAHPressReleaseQ208July29
sonic automotive SAHPressReleaseQ208July29sonic automotive SAHPressReleaseQ208July29
sonic automotive SAHPressReleaseQ208July29
 
omnicom group annual reports 2004
omnicom group annual reports 2004omnicom group annual reports 2004
omnicom group annual reports 2004
 
omnicare annual reports 2004
omnicare annual reports 2004omnicare annual reports 2004
omnicare annual reports 2004
 
northrop grumman Slide Presentation 2007 2007 2nd
northrop grumman  Slide Presentation 2007 2007 2ndnorthrop grumman  Slide Presentation 2007 2007 2nd
northrop grumman Slide Presentation 2007 2007 2nd
 
omnicom group Q4 2006 Investor Presentation
omnicom group  Q4 2006 Investor Presentationomnicom group  Q4 2006 Investor Presentation
omnicom group Q4 2006 Investor Presentation
 
dover 4Q07_Slides_9532
dover 4Q07_Slides_9532dover 4Q07_Slides_9532
dover 4Q07_Slides_9532
 
Q1 2009 Earning Report of Raytheon Co.
Q1 2009 Earning Report of Raytheon Co.Q1 2009 Earning Report of Raytheon Co.
Q1 2009 Earning Report of Raytheon Co.
 
fuji fy_2007q4 results
fuji fy_2007q4 resultsfuji fy_2007q4 results
fuji fy_2007q4 results
 
goodrich 3Q06
goodrich  3Q06goodrich  3Q06
goodrich 3Q06
 

More from finance45

AVY4Q-05-NR-with-Exhibits-1-24-06
AVY4Q-05-NR-with-Exhibits-1-24-06AVY4Q-05-NR-with-Exhibits-1-24-06
AVY4Q-05-NR-with-Exhibits-1-24-06
finance45
 
LehmanBrothers2006Speech
LehmanBrothers2006SpeechLehmanBrothers2006Speech
LehmanBrothers2006Speech
finance45
 
2006InvestorConferenceBookFinal
2006InvestorConferenceBookFinal2006InvestorConferenceBookFinal
2006InvestorConferenceBookFinal
finance45
 
FirstQuarter2006FinancialReviewandAnalysis
FirstQuarter2006FinancialReviewandAnalysisFirstQuarter2006FinancialReviewandAnalysis
FirstQuarter2006FinancialReviewandAnalysis
finance45
 
AVY1Q2006NR42506
AVY1Q2006NR42506AVY1Q2006NR42506
AVY1Q2006NR42506
finance45
 
BofABasicIndustriesConfMay42006
BofABasicIndustriesConfMay42006BofABasicIndustriesConfMay42006
BofABasicIndustriesConfMay42006
finance45
 
SecondQuarter2006FinancialReviewandAnalysis1
SecondQuarter2006FinancialReviewandAnalysis1SecondQuarter2006FinancialReviewandAnalysis1
SecondQuarter2006FinancialReviewandAnalysis1
finance45
 
AVY2Q2006NR7-25-06
AVY2Q2006NR7-25-06AVY2Q2006NR7-25-06
AVY2Q2006NR7-25-06
finance45
 
CSChemicalConference_2006_Handout
CSChemicalConference_2006_HandoutCSChemicalConference_2006_Handout
CSChemicalConference_2006_Handout
finance45
 
Third_Quarter_2006_Financial_Review_and_Analysis
Third_Quarter_2006_Financial_Review_and_AnalysisThird_Quarter_2006_Financial_Review_and_Analysis
Third_Quarter_2006_Financial_Review_and_Analysis
finance45
 
Baird2006RFIDConferencefinal
Baird2006RFIDConferencefinalBaird2006RFIDConferencefinal
Baird2006RFIDConferencefinal
finance45
 
AVY_3Q_2006_NR_102406
AVY_3Q_2006_NR_102406AVY_3Q_2006_NR_102406
AVY_3Q_2006_NR_102406
finance45
 
AVYFourthQuarter2006FinancialReviewandAnalysis
AVYFourthQuarter2006FinancialReviewandAnalysisAVYFourthQuarter2006FinancialReviewandAnalysis
AVYFourthQuarter2006FinancialReviewandAnalysis
finance45
 
ThomasWeiselTech2007_Handout020707
ThomasWeiselTech2007_Handout020707ThomasWeiselTech2007_Handout020707
ThomasWeiselTech2007_Handout020707
finance45
 
LehmanBrothers_2607Handout
LehmanBrothers_2607HandoutLehmanBrothers_2607Handout
LehmanBrothers_2607Handout
finance45
 
2007InvestorMeetingHandout
2007InvestorMeetingHandout2007InvestorMeetingHandout
2007InvestorMeetingHandout
finance45
 
PaxarInvestorTeleconferenceHandout
PaxarInvestorTeleconferenceHandoutPaxarInvestorTeleconferenceHandout
PaxarInvestorTeleconferenceHandout
finance45
 
AVYNRPaxarAcquisition_032207
AVYNRPaxarAcquisition_032207AVYNRPaxarAcquisition_032207
AVYNRPaxarAcquisition_032207
finance45
 
1Q_2007_Financial_Review_Analysis
1Q_2007_Financial_Review_Analysis1Q_2007_Financial_Review_Analysis
1Q_2007_Financial_Review_Analysis
finance45
 

More from finance45 (20)

AVY4Q-05-NR-with-Exhibits-1-24-06
AVY4Q-05-NR-with-Exhibits-1-24-06AVY4Q-05-NR-with-Exhibits-1-24-06
AVY4Q-05-NR-with-Exhibits-1-24-06
 
LehmanBrothers2006Speech
LehmanBrothers2006SpeechLehmanBrothers2006Speech
LehmanBrothers2006Speech
 
2006InvestorConferenceBookFinal
2006InvestorConferenceBookFinal2006InvestorConferenceBookFinal
2006InvestorConferenceBookFinal
 
FirstQuarter2006FinancialReviewandAnalysis
FirstQuarter2006FinancialReviewandAnalysisFirstQuarter2006FinancialReviewandAnalysis
FirstQuarter2006FinancialReviewandAnalysis
 
AVY1Q2006NR42506
AVY1Q2006NR42506AVY1Q2006NR42506
AVY1Q2006NR42506
 
BofABasicIndustriesConfMay42006
BofABasicIndustriesConfMay42006BofABasicIndustriesConfMay42006
BofABasicIndustriesConfMay42006
 
SecondQuarter2006FinancialReviewandAnalysis1
SecondQuarter2006FinancialReviewandAnalysis1SecondQuarter2006FinancialReviewandAnalysis1
SecondQuarter2006FinancialReviewandAnalysis1
 
AVY2Q2006NR7-25-06
AVY2Q2006NR7-25-06AVY2Q2006NR7-25-06
AVY2Q2006NR7-25-06
 
CSChemicalConference_2006_Handout
CSChemicalConference_2006_HandoutCSChemicalConference_2006_Handout
CSChemicalConference_2006_Handout
 
Third_Quarter_2006_Financial_Review_and_Analysis
Third_Quarter_2006_Financial_Review_and_AnalysisThird_Quarter_2006_Financial_Review_and_Analysis
Third_Quarter_2006_Financial_Review_and_Analysis
 
Baird2006RFIDConferencefinal
Baird2006RFIDConferencefinalBaird2006RFIDConferencefinal
Baird2006RFIDConferencefinal
 
AVY_3Q_2006_NR_102406
AVY_3Q_2006_NR_102406AVY_3Q_2006_NR_102406
AVY_3Q_2006_NR_102406
 
AVYFourthQuarter2006FinancialReviewandAnalysis
AVYFourthQuarter2006FinancialReviewandAnalysisAVYFourthQuarter2006FinancialReviewandAnalysis
AVYFourthQuarter2006FinancialReviewandAnalysis
 
ThomasWeiselTech2007_Handout020707
ThomasWeiselTech2007_Handout020707ThomasWeiselTech2007_Handout020707
ThomasWeiselTech2007_Handout020707
 
LehmanBrothers_2607Handout
LehmanBrothers_2607HandoutLehmanBrothers_2607Handout
LehmanBrothers_2607Handout
 
2007InvestorMeetingHandout
2007InvestorMeetingHandout2007InvestorMeetingHandout
2007InvestorMeetingHandout
 
PaxarInvestorTeleconferenceHandout
PaxarInvestorTeleconferenceHandoutPaxarInvestorTeleconferenceHandout
PaxarInvestorTeleconferenceHandout
 
AVYNRPaxarAcquisition_032207
AVYNRPaxarAcquisition_032207AVYNRPaxarAcquisition_032207
AVYNRPaxarAcquisition_032207
 
1Q_2007_Financial_Review_Analysis
1Q_2007_Financial_Review_Analysis1Q_2007_Financial_Review_Analysis
1Q_2007_Financial_Review_Analysis
 
1Q_2007_NR
1Q_2007_NR1Q_2007_NR
1Q_2007_NR
 

Recently uploaded

GROUP 6 DUBAI.pptx basta amoa na dira dapita
GROUP 6 DUBAI.pptx basta amoa na dira dapitaGROUP 6 DUBAI.pptx basta amoa na dira dapita
GROUP 6 DUBAI.pptx basta amoa na dira dapita
JohnThomas845833
 
一比一原版Adelaide毕业证阿德莱德大学毕业证成绩单如何办理
一比一原版Adelaide毕业证阿德莱德大学毕业证成绩单如何办理一比一原版Adelaide毕业证阿德莱德大学毕业证成绩单如何办理
一比一原版Adelaide毕业证阿德莱德大学毕业证成绩单如何办理
zsewypy
 
一比一原版UO毕业证渥太华大学毕业证成绩单如何办理
一比一原版UO毕业证渥太华大学毕业证成绩单如何办理一比一原版UO毕业证渥太华大学毕业证成绩单如何办理
一比一原版UO毕业证渥太华大学毕业证成绩单如何办理
yonemuk
 
Introduction to Economics II Chapter 28 Unemployment (1).pdf
Introduction to Economics II Chapter 28 Unemployment (1).pdfIntroduction to Economics II Chapter 28 Unemployment (1).pdf
Introduction to Economics II Chapter 28 Unemployment (1).pdf
Safa444074
 
State Space Tutorial.pptxjjjjjjjjjjjjjjj
State Space Tutorial.pptxjjjjjjjjjjjjjjjState Space Tutorial.pptxjjjjjjjjjjjjjjj
State Space Tutorial.pptxjjjjjjjjjjjjjjj
joshuaclack73
 

Recently uploaded (20)

NO1 Popular Best Rohani Amil In Lahore Kala Ilam In Lahore Kala Jadu Amil In ...
NO1 Popular Best Rohani Amil In Lahore Kala Ilam In Lahore Kala Jadu Amil In ...NO1 Popular Best Rohani Amil In Lahore Kala Ilam In Lahore Kala Jadu Amil In ...
NO1 Popular Best Rohani Amil In Lahore Kala Ilam In Lahore Kala Jadu Amil In ...
 
Human Capital: Education and Health in Economic Development
Human Capital:  Education and Health      in Economic DevelopmentHuman Capital:  Education and Health      in Economic Development
Human Capital: Education and Health in Economic Development
 
GROUP 6 DUBAI.pptx basta amoa na dira dapita
GROUP 6 DUBAI.pptx basta amoa na dira dapitaGROUP 6 DUBAI.pptx basta amoa na dira dapita
GROUP 6 DUBAI.pptx basta amoa na dira dapita
 
Economics - Development 01 _ Handwritten Notes.pdf
Economics - Development 01 _ Handwritten Notes.pdfEconomics - Development 01 _ Handwritten Notes.pdf
Economics - Development 01 _ Handwritten Notes.pdf
 
What exchange can I sell my pi coins in 2024
What exchange can I sell my pi coins in 2024What exchange can I sell my pi coins in 2024
What exchange can I sell my pi coins in 2024
 
Population Growth and Economic Development
Population Growth and  Economic DevelopmentPopulation Growth and  Economic Development
Population Growth and Economic Development
 
how can I sell my pi coins in the United States at the best price
how can I sell my pi coins in the United States at the best pricehow can I sell my pi coins in the United States at the best price
how can I sell my pi coins in the United States at the best price
 
how to exchange pi coins for USD in 2024.
how to exchange pi coins for USD in 2024.how to exchange pi coins for USD in 2024.
how to exchange pi coins for USD in 2024.
 
is pi Network coin available for sale in 2024
is pi Network coin available for sale in 2024is pi Network coin available for sale in 2024
is pi Network coin available for sale in 2024
 
Fintech Belgium General Assembly and Anniversary Event 2024
Fintech Belgium General Assembly and Anniversary Event 2024Fintech Belgium General Assembly and Anniversary Event 2024
Fintech Belgium General Assembly and Anniversary Event 2024
 
一比一原版Adelaide毕业证阿德莱德大学毕业证成绩单如何办理
一比一原版Adelaide毕业证阿德莱德大学毕业证成绩单如何办理一比一原版Adelaide毕业证阿德莱德大学毕业证成绩单如何办理
一比一原版Adelaide毕业证阿德莱德大学毕业证成绩单如何办理
 
一比一原版UO毕业证渥太华大学毕业证成绩单如何办理
一比一原版UO毕业证渥太华大学毕业证成绩单如何办理一比一原版UO毕业证渥太华大学毕业证成绩单如何办理
一比一原版UO毕业证渥太华大学毕业证成绩单如何办理
 
how can i make money selling pi coins in 2024
how can i make money selling pi coins in 2024how can i make money selling pi coins in 2024
how can i make money selling pi coins in 2024
 
What is an ecosystem in crypto .pdf
What  is  an  ecosystem  in  crypto .pdfWhat  is  an  ecosystem  in  crypto .pdf
What is an ecosystem in crypto .pdf
 
Bond Bazaar Powerpoint Presentation in Details
Bond Bazaar Powerpoint Presentation in DetailsBond Bazaar Powerpoint Presentation in Details
Bond Bazaar Powerpoint Presentation in Details
 
Bitcoin Masterclass TechweekNZ v3.1.pptx
Bitcoin Masterclass TechweekNZ v3.1.pptxBitcoin Masterclass TechweekNZ v3.1.pptx
Bitcoin Masterclass TechweekNZ v3.1.pptx
 
NO1 Popular Black magic specialist,Expert in Pakistan Amil Baba kala ilam Exp...
NO1 Popular Black magic specialist,Expert in Pakistan Amil Baba kala ilam Exp...NO1 Popular Black magic specialist,Expert in Pakistan Amil Baba kala ilam Exp...
NO1 Popular Black magic specialist,Expert in Pakistan Amil Baba kala ilam Exp...
 
Jio Financial service Multibagger 2024 from India stock Market
Jio Financial service  Multibagger 2024 from India stock MarketJio Financial service  Multibagger 2024 from India stock Market
Jio Financial service Multibagger 2024 from India stock Market
 
Introduction to Economics II Chapter 28 Unemployment (1).pdf
Introduction to Economics II Chapter 28 Unemployment (1).pdfIntroduction to Economics II Chapter 28 Unemployment (1).pdf
Introduction to Economics II Chapter 28 Unemployment (1).pdf
 
State Space Tutorial.pptxjjjjjjjjjjjjjjj
State Space Tutorial.pptxjjjjjjjjjjjjjjjState Space Tutorial.pptxjjjjjjjjjjjjjjj
State Space Tutorial.pptxjjjjjjjjjjjjjjj
 

RestatementLIFO

  • 1. Restatement for Q4-07 LIFO Accounting Change Unaudited First Quarter - 2007 First Quarter - 2006 OPERATING INCOME OPERATING MARGIN OPERATING INCOME OPERATING MARGIN Impact of Restated Restated Restated Restated Impact of Restated Restated Restated Restated NET SALES Acct. Change GAAP* Non-GAAP* GAAP* Non-GAAP* NET SALES* Acct. Change GAAP* Non-GAAP* GAAP* Non-GAAP* Pressure-sensitive Materials $ 860.0 $ --- $ 81.9 $ 83.4 9.5% 9.7% $ 787.2 $ 0.4 $ 66.3 $ 70.3 8.4% 8.9% Retail Information Services 156.3 --- 7.2 7.2 4.6% 4.6% 153.8 0.2 7.8 10.1 5.1% 6.6% Office and Consumer Products 214.4 (0.1) 26.4 27.0 12.3% 12.6% 239.9 0.5 36.3 37.1 15.1% 15.5% Other specialty converting businesses 159.2 --- 10.9 10.9 6.8% 6.8% 156.3 0.1 6.3 6.3 4.0% 4.0% Corporate Expense N/A --- (12.5) (12.5) N/A N/A N/A --- (12.7) (12.2) N/A N/A Interest Expense N/A --- (15.1) N/A N/A N/A N/A --- (14.5) N/A N/A N/A TOTAL $ 1,389.9 $ (0.1) $ 98.8 $ 116.0 7.1% 8.3% $ 1,337.2 $ 1.2 $ 89.5 $ 111.6 6.7% 8.3% Second Quarter - 2007 Second Quarter - 2006 OPERATING INCOME OPERATING MARGIN OPERATING INCOME OPERATING MARGIN Impact of Restated Restated Restated Restated Impact of Restated Restated Restated Restated NET SALES Acct. Change GAAP* Non-GAAP* GAAP* Non-GAAP* NET SALES* Acct. Change GAAP* Non-GAAP* GAAP* Non-GAAP* Pressure-sensitive Materials $ 879.3 $ 0.6 $ 89.5 $ 86.8 10.2% 9.9% $ 809.5 $ 0.5 $ 77.9 $ 80.0 9.6% 9.9% Retail Information Services 219.1 0.9** 1.5 21.6 0.7% 9.9% 181.4 --- 21.0 23.0 11.6% 12.7% Office and Consumer Products 262.7 --- 42.3 42.6 16.1% 16.2% 265.4 0.1 45.4 43.8 17.1% 16.5% Other specialty converting businesses 162.4 --- 6.9 6.9 4.2% 4.2% 153.4 0.2 4.8 5.5 3.1% 3.6% Corporate Expense N/A (0.9)** (8.1) (8.1) N/A N/A N/A 1.2 (9.4) (8.6) N/A N/A Interest Expense N/A --- (20.1) N/A N/A N/A N/A --- (13.6) N/A N/A N/A TOTAL $ 1,523.5 $ 0.6 $ 112.0 $ 149.8 7.4% 9.8% $ 1,409.7 $ 2.0 $ 126.1 $ 143.7 8.9% 10.2% Third Quarter - 2007 Third Quarter - 2006 OPERATING INCOME OPERATING MARGIN OPERATING INCOME OPERATING MARGIN Impact of Restated Restated Restated Restated Impact of Restated Restated Restated Restated NET SALES Acct. Change GAAP* Non-GAAP* GAAP* Non-GAAP* NET SALES* Acct. Change GAAP* Non-GAAP* GAAP* Non-GAAP* Pressure-sensitive Materials $ 868.3 $ 0.5 $ 68.3 $ 82.3 7.9% 9.5% $ 825.3 $ (0.3) $ 83.1 $ 83.9 10.1% 10.2% Retail Information Services 388.4 (2.0) (16.5) 11.5 -4.2% 3.0% 164.4 0.4 7.3 10.9 4.4% 6.6% Office and Consumer Products 266.9 0.8 48.8 49.3 18.3% 18.5% 281.7 2.4 47.1 47.5 16.7% 16.9% Other specialty converting businesses 156.8 (0.2) 7.4 8.9 4.7% 5.7% 146.2 --- 5.6 7.3 3.8% 5.0% Corporate Expense N/A 1.5 (5.8) (0.2) N/A N/A N/A (1.2) (23.2) (10.2) N/A N/A Interest Expense N/A --- (35.7) N/A N/A N/A N/A --- (14.1) N/A N/A N/A TOTAL $ 1,680.4 $ 0.6 $ 66.5 $ 151.8 4.0% 9.0% $ 1,417.6 $ 1.3 $ 105.8 $ 139.4 7.5% 9.8% Fourth Quarter - 2007 Fourth Quarter - 2006 OPERATING INCOME OPERATING MARGIN OPERATING INCOME OPERATING MARGIN Impact of Impact of Restated Restated Restated Restated NET SALES Acct. Change GAAP Non-GAAP GAAP* Non-GAAP* NET SALES* Acct. Change GAAP* Non-GAAP* GAAP* Non-GAAP* Pressure-sensitive Materials $ 890.1 $ --- $ 79.0 $ 80.0 8.9% 9.0% $ 814.3 $ (0.2) $ 74.3 $ 76.7 9.1% 9.4% Retail Information Services 410.7 --- 1.9 28.0 0.5% 6.8% 168.1 0.1 9.6 12.9 5.7% 7.7% Office and Consumer Products 272.2 --- 56.1 59.5 20.6% 21.9% 285.0 5.4 58.6 56.7 20.6% 19.9% Other specialty converting businesses 141.0 --- 0.2 2.9 0.1% 2.1% 144.0 (0.2) 0.6 1.9 0.4% 1.3% Corporate Expense N/A --- (4.9) (5.1) N/A N/A N/A --- (16.0) (16.0) N/A N/A Interest Expense N/A --- (34.3) N/A N/A N/A N/A --- (13.3) N/A N/A N/A TOTAL $ 1,714.0 $ --- $ 98.0 $ 165.3 5.7% 9.6% $ 1,411.4 $ 5.1 $ 113.8 $ 132.2 8.1% 9.4% Full Year 2007 Full Year 2006 OPERATING INCOME OPERATING MARGIN OPERATING INCOME OPERATING MARGIN Impact of Restated Restated Restated Restated Impact of Restated Restated Restated Restated NET SALES Acct. Change GAAP* Non-GAAP* GAAP* Non-GAAP* NET SALES* Acct. Change GAAP* Non-GAAP* GAAP* Non-GAAP* Pressure-sensitive Materials $ 3,497.7 $ 1.1 $ 318.7 $ 332.5 9.1% 9.5% $ 3,236.3 $ 0.4 $ 301.6 $ 310.9 9.3% 9.6% Retail Information Services 1,174.5 (1.1) (5.9) 68.3 -0.5% 5.8% 667.7 0.7 45.7 56.9 6.8% 8.5% Office and Consumer Products 1,016.2 0.7 173.6 178.4 17.1% 17.6% 1,072.0 8.4 187.4 185.1 17.5% 17.3% Other specialty converting businesses 619.4 (0.2) 25.4 29.6 4.1% 4.8% 599.9 0.1 17.3 21.0 2.9% 3.5% Corporate Expense N/A 0.6 (31.3) (25.9) N/A N/A N/A --- (61.3) (47.0) N/A N/A Interest Expense N/A --- (105.2) N/A N/A N/A N/A --- (55.5) N/A N/A N/A TOTAL $ 6,307.8 $ 1.1 $ 375.3 $ 582.9 5.9% 9.2% $ 5,575.9 $ 9.6 $ 435.2 $ 526.9 7.8% 9.4% Full Year 2005 OPERATING INCOME OPERATING MARGIN Impact of Restated Restated Restated Restated NET SALES* Acct. Change GAAP* Non-GAAP* GAAP* Non-GAAP* Pressure-sensitive Materials $ 3,114.5 $ 6.0 $ 264.1 $ 287.1 8.5% 9.2% Retail Information Services 630.4 --- 37.7 45.2 6.0% 7.2% Office and Consumer Products 1,136.1 (6.1) 161.9 186.0 14.3% 16.4% Other specialty converting businesses 592.5 0.8 14.9 21.1 2.5% 3.6% Corporate Expense N/A --- (53.2) (50.4) N/A N/A Interest Expense N/A --- (57.9) N/A N/A N/A TOTAL $ 5,473.5 $ 0.7 $ 367.5 $ 489.0 6.7% 8.9% * Includes adjustments to results as originally reported to reflect prior period reclassifications. ** Variance of $0.9M due to reclass of Paxar related expenses from the RIS segment to Corporate.