2. CORPORATE PROFILE
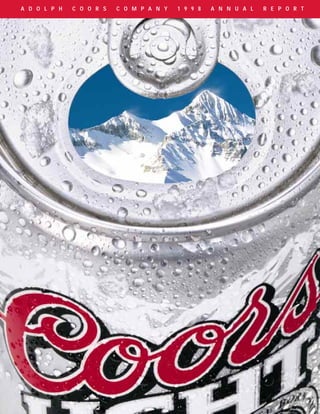
ABOUT THE COVER Adolph Coors Company, founded in 1873, is ranked among
the 675 largest publicly traded corporations in the United States.
The connection between Coors
Its principal subsidiary is Coors Brewing Company, the nation’s
and the Rocky Mountains is genuine,
third-largest brewer.
setting Coors apart from all other major
Throughout its history, Coors has provided consumers with
brewers. It's a powerful association
high-quality malt beverages produced using an all-natural brewing
that is valued by consumers because process and the finest ingredients available. The company’s
portfolio of products, primarily premium and above-premium
it conveys Coors' commitment to produce
beers, includes Coors Light – the fourth-largest-selling beer in
the highest quality malt beverages that
the nation, Original Coors, George Killian’s Irish Red, Zima, Blue
are as crisp, cold and refreshing as
Moon specialty beers and Keystone popular-priced beers. Coors
the Rockies.
products are available throughout the United States and in about
30 international markets.
The corporate headquarters and primary brewery are in Golden,
Colorado, with other major brewing and packaging facilities in
Elkton, Virginia; Memphis, Tennessee; and Zaragoza, Spain. In
addition, Coors owns major aluminum can and end manufacturing
facilities in Golden and is a partner in the joint venture that operates
these plants. Coors is also a partner in a joint venture that owns
and operates a glass bottle manufacturing plant in Colorado.
TA B L E O F C O N T E N T S
Financial Trends and Highlights 1
Letter to Shareholders 2
Operations Review 6
Financial Performance Summary 16
1998 Financial Review 17
Management’s Discussion and Analysis 18
Reports from Management and Independent Accountants 24
Consolidated Financial Statements 25
Notes to Consolidated Financial Statements 30
Selected Financial Data 42
Directors and Officers, Corporate Information 44
3. FINANCIAL TRENDS*
Adolph Coors Company and Subsidiaries
Malt Beverage Return on
Sales** Income
Sales Volume Invested Capital***
(In billions) (In millions)
(In millions of barrels)
$2.5
22 10%
$80
$70
$2.0
21 8%
$60
$50
$1.5
20 6%
$40
$1.0
19 4%
$30
$20
$0.5 2%
18
$10
$0
0 0%
$0
94 95 96 97 98
94 95 96 97 98 94 95 96 97 98
94 95 96 97 98
Gross Sales
Net Sales
* Excluding net special charges (in 1998 and 1996) and special credits (in 1997, 1995 and 1994), except as noted in footnote *** below.
** The difference between gross sales and net sales represents beer excise taxes.
*** Defined as after-tax income before interest expense and any unusual income or expense items (including special charges and credits), divided by the
sum of average total debt and shareholders’ equity. The 1996 and 1995 return on invested capital rates include gains related to changes in non-pension
postretirement benefits.
FINANCIAL HIGHLIGHTS
For the years ended December 27, December 28, Percentage
1998 1997 Change
(Dollars in thousands, except per share data)
Barrels of beer and other malt beverages sold 21,187,000 20,581,000 2.9%
Net sales $1,899,533 $1,821,304 4.3%
Net income $ 67,784 $ 82,260 (17.6%)
Properties – net $ 714,441 $ 733,117 (2.5%)
Total assets $1,460,598 $1,412,083 3.4%
Shareholders’ equity $ 774,798 $ 736,568 5.2%
Dividends $ 21,893 $ 20,523 6.7%
Number of full-time employees 5,800 5,800 —
Number of shareholders of record 3,197 3,227 (0.9%)
Number of Class A common shares outstanding 1,260,000 1,260,000 —
Number of Class B common shares outstanding 35,395,306 35,599,356 (0.6%)
Per share of common stock:
Net income – basic $1.87 $2.21 (15.4%)
– diluted $1.81 $2.16 (16.2%)
Net book value $21.34 $19.79 7.8%
Dividends $0.60 $0.55 9.1%
1
4. LETTER TO SHAREHOLDERS
Dear Fellow Shareholders:
Historic. Challenging. Growing.
These three words summarize the year for Adolph Coors Company in 1998 – a year that, we are
pleased to report, was a very good one for our company and our shareholders.
Historic because we celebrated our 125th anniversary – a major milestone in our company’s history.
Since our founding in 1873, we’ve satisfied the tastes and changing demands of many generations of
consumers, thanks to the many generations of Coors employees, wholesalers and suppliers who together
for more than a century have contributed to our heritage and our success.
Challenging because brewing and selling malt beverages continued to be a tough business in 1998,
with slow growth, aggressive competition and margin pressures representing familiar and formidable
obstacles to increases in market share and profitability.
Growing because in 1998, despite the many challenges in our industry, Coors Brewing Company
continued to strengthen its industry position by becoming a bigger, stronger and even more competitive
player in the beer business.
Celebrating our past while continuing to build a strong company for the future, we met the challenges
of 1998. We focused on the fundamentals and achieved significant increases in earnings and shareholder
returns, bringing us closer to accomplishing our long-term goal of delivering consistent, profitable growth
for Coors and our shareholders.
REVIEW OF 1998
As expected, 1998 was another year of fierce competition in the beer industry. Despite the many
hurdles, we continued to increase our market share and outpace the industry volume growth rate by
one to two percentage points – one of our primary top-line goals. In addition, the company:
• achieved significant volume growth in our most important international markets, the Caribbean and Canada;
• raised the level of service, product quality and freshness to our distributors to new and higher levels;
• made productivity improvements in our Operations areas; and
• increased our investments behind our core brand equities and in our domestic and international
sales capabilities.
Perhaps most important, we increased earnings at a strong double-digit rate and achieved a total
return to our shareholders – that is, share price appreciation plus dividends – of more than 70%.
(This was on top of an 82% total shareholder return in 1997.) For perspective, the 70% return on your
investment in Coors during 1998 was 2 1/2 times the 28% total return posted by the S&P 500 index of
large companies.
Net sales reached a record $1.9 billion in 1998, a 4.3% increase over the previous year. Sales
volume also hit a record high during the year with a total of 21,187,000 barrels of beer and other malt
beverages sold, a 2.9% increase from 1997, compared to an industry growth rate of under 1%. Other
specific measures of our financial performance showed significant improvements. Gross revenue per
barrel increased 0.8% while other major brewers were flat or down. A net revenue per barrel increase
of 1.3% combined with a 0.5% decrease in cost of goods per barrel helped raise gross margins by
2
5. more than a percentage point to
39% in 1998.
Consequently, the company’s
bottom line grew 16.6%, excluding
special items in 1997 and the third
quarter of 1998, as we achieved
after-tax income of $79.6 million,
up from $68.3 million in 1997. Basic
earnings per share increased 19.0%
to $2.19 in 1998 from $1.84 a year
earlier, while diluted earnings per
share were $2.12, up 17.8% from
$1.80 per share in 1997, excluding
Somewhere near Golden, Colorado: Pete Coors, Bill Coors and Leo Kiely
special items.
W O R K I N G T H E F U N D A M E N TA L S
To achieve a solid performance in 1998, we continued to focus on the fundamentals of brewing
great beer, amazing our customers and making money, and doing so by investing in the experience
and talents of our people. As a result:
We achieved strong momentum in three of our most important brands. Coors Light grew at a mid-
single-digit pace for the fourth consecutive year. Killian’s Irish Red, which received national television
advertising support for the first time in 1998, and Zima attained solid results for the year. Keys to these
achievements were improved product quality and service to our customers, resulting from more direct
shipments to distributors, better order fill and fresher beer in the marketplace.
Our international business contributed to the company’s growth. In the Caribbean and Canada, Coors
Light continued to achieve strong sales trends. Coors Light is, by far, the market leader in Puerto Rico. And
although income from our Canadian business was 19% lower under our new arrangement with Molson
compared to the lucrative temporary arrangement in 1997, volume increased and we grew market share.
We are confident that even greater market potential for our brands exists in Canada in the years ahead.
We increased domestic revenue per barrel about 0.5% through selective and careful pricing and by
focusing on brand-building and higher-margin opportunities.
We also ended 1998 in a stronger cash position. Cash and cash investments, less debt, were
$57 million higher at year-end 1998 than in 1997 due to better leveraging of inventories and other
working capital improvements.
OUTLOOK FOR 1999 AND BEYOND
Moving forward, not only will we continue to drive the business priorities that have achieved
solid momentum and results, we will work the fundamentals even better. Near term, we will focus
on five primary factors:
3
6. ENGAGED IN
THE BUSINESS
Employee teams throughout Coors’
operations are driving productivity
improvements that reduce costs
while boosting quality and service.
An employee suggestion program
launched in 1998 – Coors WINS
(Winning Ideas • New Solutions) –
produced first-year savings of
$4.6 million and equipped one
idea suggester, Can Plant Process
Control specialist Jim Aldridge,
with a shiny new set of wheels.
At the Coors aluminum can manufacturing plant, Process Control specialists Jim Aldridge, Dave Lawson and Dennis Smith
First, continued investment in our core brands will be vital to capitalizing on the solid momentum
that we’ve established at retail in the premium and above-premium categories of the malt beverage
business. Our marketing and packaging innovations are more exciting than ever, winning consumers
by communicating our unique equities and product quality.
Second, we will be thoughtful and prudent in meeting the challenges created by the beer pricing
environment – still one of the hardest factors in our business to predict. Maintaining the integrity of
our brand franchises should help us manage any pricing pressures that arise. Our pricing decisions
will continue to be based on strategies that make sense for the long-term strength of our brands.
Third, we will continue to increase our presence in certain international markets, selectively
seeking opportunities that will increase our earnings from international operations, just as we have
in Canada and in the Caribbean.
Fourth, we will focus on achieving further reductions in the company’s cost structure. Throughout
our organization, Coors people have focused their experience and talent on streamlining our opera-
tions while raising our standards of quality to new highs. Their ideas and innovations continue to
drive important productivity gains that are improving the way we run our business. Also, in 1999
we will implement substantial upgrades to our technology infrastructure that will increase operational
efficiencies and prepare the company for the Year 2000.
Finally, we will be assessing the impact that continued consolidation in the brewing industry will
have on the future of our company, our wholesalers and our suppliers. We believe that consolidation
will improve the fundamental economics of the beer industry.
4
7. Golden brewery Conditioning specialists Willie Maloy, Pam Faris and Roland Weller
BUILDING ON OUR STRENGTHS
Coors Brewing Company made solid progress in 1998 because our people worked the fundamentals of the
business and, as a result, improved product quality and freshness to our distributors, managed costs, increased
the company’s profitability and financial strength and substantially improved returns to shareholders.
To continue our progress and remain a strong and growing company for future generations, we
will build upon our strengths: our history, our heritage of quality and innovation, our brands and our
great team of experienced, talented and dedicated people.
We also will be relentless in our pursuit of excellence as we build our leadership organization. To this
end, we were pleased in 1998 to announce the election of our company’s president and chief operating officer,
W. Leo Kiely III, and Dr. Albert C. Yates, president of Colorado State University in Fort Collins, Colorado, to
the company’s board of directors. The experience and perspective that these two outstanding leaders bring
to our board will be invaluable for governance in the complex and ever-changing brewing industry.
We thank you, our fellow shareholders, for helping us to celebrate a century and a quarter of
success in the beer business. And we look forward to your continued support in the years to come.
BILL COORS PETER COORS L E O K I E LY
Chairman, President and Vice Chairman and President and
Chief Executive Officer Chief Executive Officer Chief Operating Officer
Adolph Coors Company Coors Brewing Company Coors Brewing Company
5
8. OPERATIONS REVIEW
In a year of progress and celebrations for Coors Brewing Company, Vice Chairman
and Chief Executive Officer Pete Coors and President and Chief Operating Officer
Leo Kiely led an organization that is focused on continuing its growth and
strengthening its position in the highly competitive brewing industry. Maintaining
the momentum established over the past several years and building a strong company for future
generations require continued emphasis on the “fundamentals” of the beer
business, combined with a long-term perspective and vision. Following another
good year for Coors Brewing Company, Pete and Leo discuss the company’s
1998 achievements and current plans, along with prospects for the future.
BUILDING
KEY BRANDS
Coors grew volume and improved
profitability in 1998 by focusing on
four premium and above-premium
brands – Coors Light, Original Coors,
Killian's Irish Red and Zima. Coors
Light achieved a fourth consecutive
year of mid-single-digit volume
growth. Killian's and Zima also
recorded solid increases in sales
volume. Coors is building brands
by delivering on its reputation for
quality, innovation and service.
9. successes, we can continue to healthy and viable business.
COORS CELEBRATED 125 YEARS IN THE
thrive and grow in the world- We will bring these pieces
BREWING BUSINESS IN 1998. WHAT WILL
wide beer business. together by focusing on our
YOU DO TO SUCCEED IN THIS BUSINESS
In addition, we need to people. From the day my
FOR AT LEAST ANOTHER 125 YEARS?
emphasize our long-term vision great-grandfather opened the
Pete Coors: Our company
to serve both current and future brewery in 1873, our employ-
needs to sustain and build on
generations of consumers. That ees have been the soul, spirit
more than a century of growth
requires not only developing and heart that have driven our
and our reputation for quality,
operational strategies for the company’s success. By contin-
innovation and service. Coors
next five, 10 or 20 years, but uing to support our people and
Brewing Company has a fasci-
also recognizing that Coors provide them with the training
nating and unique history in
must continue to promote the and resources they need, we’ll
the beer business. Our progress
responsible marketing, selling continue to strengthen and
in our first 125 years will be a
and consumption of our prod- grow our business generation
tough act to follow, but as long
ucts if we want to remain a after generation.
as we keep building on our past
10. Coors consistently leads the industry in packaging innovations, capturing consumer
attention and driving sales at retail. It began in 1959 when the company shocked
its much larger competitors by introducing the nation’s first all-aluminum beverage
can. The tradition continued in 1998 when Coors unveiled the “pigskin” bottle, an
eye-catching package – with leather grain texture and laces – that adds value and
excitement in support of football season promotions.
based on reasonable expectations equities and in Coors’ heritage
WHAT ARE YOU DOING TO ENSURE
of annual volume growth, to of quality and innovation. Our
SUCCESS IN THE MORE IMMEDIATE TERM?
make sure that we have the strong association with the Rocky
Leo Kiely: We’re capitalizing on
capacity to supply our whole- Mountains continues to be a
the strong momentum that we’ve
salers with enough of our quality very positive point of difference
established in the marketplace
products to satisfy demand well among beer drinkers. We’ve rein-
and, at the same time, we’re con-
into the next century. Later this forced that tie by adding strong
tinuing to aggressively pursue
year, we intend to share specifics mountain imagery to our Coors
ways that we can improve the
of these plans. Light packaging graphics for the
way we do business. Several
Our strategy is working, so first time. We believe that our
years ago, we decided to focus
our energies in the immediate quality standards, which govern
on four things – improving qual-
future won’t be focused on the way we brew, package and
ity and service, boosting our
changing the current game ship Coors products, are the
profitability and developing the
plan. We’ll continue to work highest in the industry. And our
skills of our people – what we
the fundamentals, but we’ll innovations, both technical and
call the basics of our business.
keep working them better, creative, have literally changed
As a result, we’ve made tremen-
day to day and year over year. the way malt beverages are pack-
dous progress in strengthening
aged and marketed. We’ll con-
our brand equities, improving
tinue to capitalize on these and
our organization, elevating HOW WILL YOU CONTINUE TO BUILD
other competitive advantages to
our service and quality levels THE STRENGTH OF YOUR BRANDS?
Pete: We have some tough com- make our brands even stronger.
and establishing a track record
petitors in our business, but we
of consistent profit growth.
also have considerable competi- Leo: Many people in the beer
Currently, we’re also refining
tive strength in our unique brand business thought that it would
our long-term sourcing strategy,
8
11. be tough for us to beat the suc- bly the hottest spectator sport broadening the appeal of our
cess of our baseball bat bottle going and, for Coors, brings advertising among 21- to 29-year-
and other recent package important visibility among beer old men – the most important
innovations. But last year, we consumers for our most impor- malt beverage consumers.
introduced a “pigskin” bottle in tant brands. With racing hero In addition, to maintain our
support of our sponsorship of and two-time Daytona 500 brand strength, we’re committed
the first-ever National College winner Sterling Marlin driving to further investments in our
Football Championship series the No. 40 Coors Light car on sales organizations, both domes-
to overwhelming response from the premier NASCAR circuit, tically and internationally, and
distributors and consumers. We our race promotions capture to continued efforts to strengthen
raised the bar for innovative con- the kind of attention that sells our wholesaler network.
sumer promotions in 1997 with beer. And, beginning in 1999,
our Blast of Cash ATM program, we’ve really ratcheted up our CAN COORS REASONABLY EXPECT
and then we topped it in 1998 position in the granddaddy TO KEEP BEATING THE INDUSTRY
with an even more successful of all races as the Official Beer VOLUME GROWTH RATE BY ONE TO
Blast of Cash II promotion. We’re of the Indianapolis 500. TWO PERCENTAGE POINTS?
seeing other brewers chase our The quality and effective- Pete: Our volume trends, espe-
innovations, and that’s exciting. ness of our advertising continue cially among our core brands, are
We’re also very excited to increase with each new cre- very favorable and our invest-
about our increasing involve- ative execution. We’re making ments – both in the brands them-
ment in auto racing. It’s proba- substantial progress toward selves and in our sales
Coors excels at leveraging sales and marketing investments to achieve the
greatest impact in the marketplace. That’s the approach behind Coors’ growing
involvement in auto racing. The sport’s rapidly expanding popularity and strong
demographics provide tremendous promotional opportunities in race cities
from California to Texas to New York. Popular back-to-back Daytona 500 winner
Sterling Marlin drives the No. 40 Coors Light car on NASCAR’s premier circuit.
9
12. GROWING
KEY MARKETS
Market focus and an exceptional
distributor made Coors the number-
one brewer and Coors Light the
number-one brand in Pittsburgh, with
continued strong volume growth in
1998. Coors’ strategic approach of
building key brands in key markets
and strengthening its distributor
network is succeeding. Coors is
meeting its goal of outpacing the
annual industry volume growth rate
by one to two percentage points.
organization – remain focused promotional plans and prospects
SPECIFICALLY, WHAT ARE YOU DOING
on growing volume in the for the brand are exciting. Zima
TO MAINTAIN BASELINE AND
premium-and-above category. continues to contribute signifi-
INCREMENTAL GROWTH?
This is where we see the greatest cantly to our growth, posting
Leo: We’re driving baseline
potential for growth. Coors Light, its sixth consecutive quarter of
growth by continuing to focus
by far our biggest-selling brand, growth in 1998. Original Coors
on our key brands – Coors Light,
continues to grow at a mid-single- volume in 1998 was consistent
Original Coors, Killian’s Irish Red
digit pace. This is consistent with with the industry-wide perform-
and Zima – in markets where
the pace of the premium light ance of the regular premium
we are strongest. This strategy
segment, and we’re confident category – down modestly across
was extremely successful in
that we can meet or beat this all major brands. However, we’re
1998. Last year, Coors Light
growth rate. In addition, we’ve confident that the brand’s history
achieved double-digit growth
been very successful at achieving and equities represent opportuni-
volume in nearly a third of our
both baseline and incremental ties for recapturing and growing
top markets. Killian’s Irish Red
growth, which continue to be the traditional Original Coors
volume also was up mid-single
among our top priorities. consumer base.
digits for the year, and our
10
13. Incremental growth, interna- this area and with unique and rel- were not increased. In 1999, the
tionally as well as domestically, evant promotions and packaging. key will be how much our front-
also is being achieved through line price increases “fill in” to
our selective investments to grow include more markets and pack-
DO YOU SEE ANY IMPROVEMENT COMING IN
high-potential geographies, retail ages. Equally important will be
THE BEER PRICING ENVIRONMENT IN 1999?
channels, ethnic markets and Leo: Pricing moves that we made the level of value-packing and
brands. In several metro areas late in 1998 and early 1999 set the price discounting as we move
that Coors identified as high- tone for what we expect to hap- into the summer selling season –
opportunity or “development” pen in the coming year. During activities that we’ve seen increase
markets in 1998, the average this time, we instituted front-line every recent summer.
volume growth rate last year price increases and reductions in In any case, it’s too early
was 6.5%, more than double our discounting that, combined, aver- to predict how much, if any,
overall growth rate in 1998. We aged an increase of about 3% on additional pricing will drop
also achieved significant volume half of our domestic volume. For to the bottom line, since we
increases in ethnic markets the other half of our markets and anticipate reinvesting heavily
through effective leadership in package configurations, prices in marketing and sales efforts.
11
14. Nevertheless, we will continue years. But, we’ve also proven team of experienced players who
to make pricing decisions that that Coors can compete success- understand the intricacies of
maximize the equities of our fully in international markets. today’s international beverage
brand portfolio and strengthen Coors entered Puerto Rico in business. I believe we are well-
our wholesaler organization. 1991 with Coors Light and now positioned in Europe, Asia and
is the dominant player with con- the Americas to build volume
tinuing strong growth. Our Coors in our existing markets and,
IS COORS POSITIONED TO BECOME A
Canada joint venture is meeting through our own efforts and
STRONGER INTERNATIONAL PLAYER?
Pete: We are very pleased with expectations by building distri- strategic partnerships, to be
the direction of our international bution and growing volume of profitable in new markets.
business and see opportunities Coors Light, which is the top-
to grow that volume profitably. selling light beer in Canada. [NOTE: On February 8, 1999,
Competing internationally is Our brands enjoy a premium Stroh Brewing Company
difficult. Certainly, we’ve made equity image around the globe. announced that it had signed
some costly missteps in past We’ve also assembled a strong agreements to sell two of
DEVELOPING
INTERNATIONAL
MARKETS
The great success of Coors Light in
the Caribbean and Canada, combined
with new opportunities for Coors
products in Latin America, Europe
and the Pacific, provides Coors with
a foundation to build international
volume. Coors has adopted a prudent
approach focused on growing vol-
ume profitably by bringing together
the best people, the strongest
distributors and the right products
in the most promising markets.
15. its brands to Miller Brewing should have a positive impact HOW ARE YOU GOING TO CONTINUE TO
Company and the balance of its on the fundamental economics CONTROL YOUR COST STRUCTURE AND
beer brands and one of its brew- of the beer industry at both the INCREASE EFFICIENCIES?
ing facilities to Pabst Brewing brewer and wholesaler levels. Leo: In recent years, we’ve
Company. Miller also will buy two In the short term, and from made productivity gains, thanks
brands from Pabst and expand a strictly Coors point of view, to considerable experience and
its contract brewing agreement we will watch for any impact talent in our Operations areas.
with Pabst. By early next year, the changes may have on our Our people on the front lines
Stroh will exit the beer business.] wholesalers. We want to be of production are the best in the
certain that support of Coors beer business, and they’re in
products among multibrand the best position to identify and
WHAT IMPACT WILL THE STROH/PABST/
wholesalers isn’t compromised implement new and better ways
MILLER DEAL HAVE ON THE BREWING
and that critical volume isn’t of doing business. Individuals
INDUSTRY AND ON COORS?
Pete: Over time, this antici- lost due to the movement of and teams at Coors continue to
pated industry restructuring brands among distributors. aggressively pursue ways that
16. Bill and Pete Coors were nowhere near Golden, Colorado, on March 11, 1999,
when they rang the opening bell signaling the first day of trading for Coors
Class B common stock on the New York Stock Exchange. The move to the
NYSE is expected to support Coors’ future growth and increase shareholder
value by improving the company’s access to capital markets. The new ticker
symbol is “RKY” in recognition of Coors’ Rocky Mountain heritage.
we can work smarter and potential investors, which
HOW ARE YOU GOING TO MAINTAIN
reduce costs. In fact, employee should offer better access to
YOUR RETURNS WHILE INVESTING SIG-
contributions to a new sugges- capital markets and support
NIFICANT CAPITAL IN EXPANDING YOUR
tion program that we launched the company’s future growth.
CAPACITY TO MEET FUTURE DEMAND?
early in 1998 have netted Being listed on the world’s
Leo: Our approach to sourcing
millions of dollars in cost largest stock market also is
will be return-focused. We’ll
reductions in Operations and expected to help us to achieve
improve quality and service
far surpassed even our most the level of global visibility
while lowering costs at the same
optimistic expectations for that can contribute to further
time. We’re looking at optimal
participation, cost savings and growth in shareholder value.
use of current facilities, product
workplace improvements. source options and the appropri-
In 1999, we will implement ate pace of capacity growth. DOES COORS BELIEVE THAT ALCOHOL
a number of major technology BEVERAGES WILL ATTRACT SOCIAL AND
enhancements to increase efficien- POLITICAL SCRUTINY SIMILAR TO THAT
WILL THE RECENT MOVE TO TRADING ON THE
cies throughout our supply chain, RECEIVED BY THE TOBACCO INDUSTRY?
NEW YORK STOCK EXCHANGE CONTRIBUTE
from our barley fields to our dis- Pete: During all the years we’ve
TO THE SUCCESS OF THE COMPANY?
tributors’ warehouses. We know been in business, the alcohol
Pete: We see the move to the
that there is much more that we beverage industry has faced
New York Stock Exchange as
can do to increase efficiencies and some form of scrutiny. Frankly,
one that will give our company
reduce our costs while improving there will always be those who
and our stock greater domestic
quality. Continuous improvement want to restrict or destroy our
and international visibility.
is becoming one of the fundamen- industry. But I’m convinced
The move should allow us to
tals of our business. that if we do our jobs right by
reach a broader audience of
14
17. being good corporate citizens, responsible marketing of beer. tive education and prevention
and if we remain sensitive and They know that moderate drink- programs, lobbying for strong
responsive to public concerns, ing by adults in appropriate set- legislation targeted at groups
alcohol beverages will maintain tings and situations is, for most, such as repeat drunk drivers,
social acceptability. an entirely positive experience. and basing our programs and
Yet, in today’s climate, At the same time, all of us policies on the fullest under-
the question is often asked, are aware of the serious prob- standing of sound scientific
“Is alcohol next?” The fact is lems associated with reckless research. Our distributors are
that alcohol was first. That’s drinking and agree that under- engaged in these efforts and
important because the lessons age drinking and drunk driving are making them an important
learned by alcohol producers, cannot be tolerated. While part of the way they do busi-
the government and the public individual responsibility is key ness. We also are reaching out
from the failed experiment to resolving these issues, it is to retailers to help them avoid
of Prohibition will help guide important that consumers, their selling alcohol to people who
the debate of today’s concerns. families and friends, govern- are underage and those who
Reason should prevail because ment entities, our industry and have had enough.
few people want to repeat others all share in fulfilling The bottom line is that our
that mistake. their distinct roles in this effort. industry will thrive as long as
We are at a point today At Coors, we are doing our we do the right thing, and that
where the public supports the part by marketing our products means doing our part to address
responsible consumption and responsibly, supporting effec- legitimate public concerns.
Coors has a long-standing commitment to market its products responsibly and do
its part to combat the serious problems of underage drinking, reckless drinking
and drunk driving. In 1998, Coors launched its “21 means 21” campaign with
television commercials, print advertising and point-of-sale materials featuring
basketball great Ervin “Magic” Johnson. Magic delivered upbeat messages
about not using phony I.D. cards and not buying alcohol for underage friends.
15
18. FINANCIAL PERFORMANCE SUMMARY
For Coors Brewing Company, • invested $25 million in incremental revenue-
1998 reflected continued building initiatives;
progress in improving the finan- • invested additional capital in our businesses in
cial performance and strength of Japan and Europe;
the company. Excluding special • covered $11 million of expenses for Year 2000-
items, diluted earnings per related analysis and remediation; and
share grew 17.8% to $2.12 • overcame $5 million in start-up expenses and lower
and pretax profit grew 13% to $130.5 million. Return on profit from the new structure of our Canadian joint
invested capital (ROIC) grew to 9.5%. While this improved venture with Molson.
performance serves to highlight how much further we must Our financial position continued to improve as
go until our absolute returns can be considered “superior,” we increased our net invested position (cash plus mar-
1998 did reflect a number of exciting and encouraging hall- ketable securities minus debt) by $57 million. This was
marks. Our year-end results represented: achieved through better leveraging of inventories and
• a 70% increase in market capitalization, with total other working capital improvements. Our balance sheet
company value increasing from $1.1 billion at year- was stronger and more productive.
end 1997 to $1.9 billion by year-end 1998; As another sign of our strengthening financial posi-
• a 1.2-percentage-point increase in ROIC, bringing to tion, we ended 1998 with a debt to total capitalization
nearly five percentage points the increase during the ratio (total debt divided by the sum of total debt plus
past five years; and shareholders’ equity) of just 16%, down from 25% three
• the first time as a public company that we achieved years earlier. A key priority going forward is investing
three consecutive years of growth in earnings per share. our cash and unused debt capacity at attractive rates of
To achieve these results, we overcame a number of return that will drive our business and shareholder value.
significant challenges while funding important invest- As we have sharpened our focus throughout Coors –
ments. Most notable, we: operating our company increasingly as a single, more solid
Net Sales per Barrel Gross Margin Operating Margin Capital Expenditures/
Depreciation, Depletion
(% of net sales) (% of net sales)
and Amortization
(In millions)
7%
40% $200
$90
35% 6%
$85
30% $150
5%
25%
$80
4%
20% $100
3%
$75 15%
2%
10% $50
$70
1%
5%
0% $0
$0 0%
94 95 96 97 98 94 95 96 97 98
94 95 96 97 98 94 95 96 97 98
Capital Expenditures
Depreciation, Depletion
and Amortization
All graphs – excluding net special charges (in 1998 and 1996) and special credits (in 1997, 1995 and 1994).
* Excluding purchases, sales and maturities of marketable investments in 1998, 1997 and 1996.
16
19. team – not only have our operating and financial perform-
ance improved, so has the consistency of our performance.
As the number-three player in a very competitive industry,
we realize that significant obstacles will always be present,
challenging our ability to achieve consistent results.
Still, we have, with improving balance, focused on
better serving our distributor partners; growing our busi-
ness domestically and internationally; prudently lowering
costs; and building an even stronger team for the future.
This focus, and the greater earnings consistency that
it has helped achieve, has been rewarded with investor
valuations that increased our earnings multiple and
market values significantly in 1998.
In summary, 1998 was a year in which Coors Brewing
Company continued to grow and strengthen its competitive
position in a tough industry. This progress is encouraging. 1998 FINANCIAL REVIEW
TA B L E O F C O N T E N T S
We expect even better financial results in the years ahead
and believe they will be achieved by our continued support Management’s Discussion and Analysis 18
of the talented people who are focused on product quality
Reports from Management
and service excellence.
and Independent Accountants 24
T I M O T H Y V. W O L F Consolidated Financial Statements 25
Senior Vice President and Chief Financial Officer
Coors Brewing Company Notes to Consolidated
March 17, 1999 Financial Statements 30
Selected Financial Data 42
Cash from Operating and
Investing Activities*
(In millions)
$250
$200
$150
$100
$50
$0
-$50
94 95 96 97 98
17
20. M A N A G E M E N T ’ S D I S C U S S I O N A N D A N A LY S I S O F
F I N A N C I A L C O N D I T I O N A N D R E S U LT S O F O P E R AT I O N S
Adolph Coors Company and Subsidiaries
INTRODUCTION Company (JCBC) of Korea, as well as a $14.4 million charge related
Adolph Coors Company (ACC or the Company) is the holding to CBC’s brewery in Zaragoza, Spain, for the impairment of certain
company for Coors Brewing Company (CBC), which produces and mar- long-lived assets and goodwill and for severance costs for a limited
kets high-quality malt-based beverages. work force reduction. These special items amounted to a credit of
This discussion summarizes the significant factors affecting $31.5 million to pretax income, or $0.37 per basic share ($0.36 per
ACC’s consolidated results of operations, liquidity and capital diluted share), after tax. Without this special credit, ACC would
resources for the three-year period ended December 27, 1998, and have reported net earnings of $68.3 million, or $1.84 per basic share
should be read in conjunction with the financial statements and the ($1.80 per diluted share).
notes thereto included elsewhere in this report.
1996: For the 52-week fiscal year ended December 29, 1996, ACC
ACC’s fiscal year is a 52- or 53-week year that ends on the last
reported net income of $43.4 million, or $1.14 per basic and diluted
Sunday in December. The 1998, 1997 and 1996 fiscal years were all
share. During 1996, the Company received royalties and interest
52 weeks long.
from Molson in response to the October 1996 arbitration ruling that
Certain unusual or non-recurring items impacted ACC’s financial
Molson had underpaid royalties from January 1, 1991, to April 1,
results for 1998, 1997 and 1996; restatement of results excluding spe-
1993. Further, ACC recorded a gain from the 1995 curtailment of
cial items permits clearer evaluation of its ongoing operations. These
certain postretirement benefits, charges for Molson-related legal
special items are summarized below.
expenses and severance expenses for a limited work force reduction.
Summary of operating results:
These special items amounted to a pretax charge of $6.3 million,
For the years ended
or $0.11 per basic share ($0.10 per diluted share), after tax. Without
Dec. 27, Dec. 28, Dec. 29,
this net special charge, ACC would have reported net earnings of
1998 1997 1996
(In thousands, except earnings per share)
$47.3 million, or $1.25 per basic share ($1.24 per diluted share).
Operating income:
Trend summary – percentage increase (decrease) for 1998, 1997
As reported $103,819 $147,393 $80,774
and 1996: The following table summarizes trends in operating
Excluding special items $123,214 $115,876 $87,115
results, excluding special items.
Net income:
As reported $ 67,784 $ 82,260 $43,425
1998 1997 1996
Excluding special items $ 79,615 $ 68,309 $47,299
Volume 2.9% 2.7% (1.3%)
Earnings per share:
Net sales 4.3% 4.6% 3.0%
As reported – basic $1.87 $2.21 $1.14
Average base price increase 0.3% 1.7% 2.1%
– diluted $1.81 $2.16 $1.14
Gross profit 7.4% 13.0% 5.2%
Excluding special items
Operating income 6.3% 33.0% 34.0%
– basic $2.19 $1.84 $1.25
Advertising expense 10.0% 8.5% 0.5%
– diluted $2.12 $1.80 $1.24
Selling, general and administrative 3.7% 11.8% 13.5%
1998: For the 52-week fiscal year ended December 27, 1998, ACC
CONSOLIDATED RESULTS OF CONTINUING OPERATIONS –
reported net income of $67.8 million, or $1.87 per basic share ($1.81
1998 VS. 1997 AND 1997 VS. 1996 (EXCLUDING SPECIAL ITEMS)
per diluted share). During 1998, the Company recorded a $17.2 mil-
1998 vs. 1997: Net sales increased 4.3% over 1997, which was caused
lion pretax charge for severance and related costs of restructuring the
primarily by a unit volume increase of 2.9%. The increase in net sales
Company’s production operations. A $2.2 million pretax charge also
was also attributable to increased export sales, which generate higher
was recorded during 1998 for the impairment of certain long-lived
net revenue per barrel than domestic sales, and a modestly improved
assets at one of the Company’s distributorships. These items resulted
domestic pricing environment.
in a total special pretax charge of $19.4 million, or $0.32 per basic
Gross profit increased 7.4% to $740.6 million from 1997 due to
share ($0.31 per diluted share), after tax. Without this special charge,
the 4.3% net sales increase discussed above, coupled with a lower
ACC would have reported net earnings of $79.6 million, or $2.19 per
increase in cost of goods sold of 2.4%. The increase in cost of goods
basic share ($2.12 per diluted share).
sold was attributable to higher volumes and slightly higher costs for
1997: For the 52-week fiscal year ended December 28, 1997, ACC
beer and certain packaging materials, partially offset by improved
reported net income of $82.3 million, or $2.21 per basic share ($2.16
cost absorption due to higher beer production levels and lower
per diluted share). During 1997, the Company received a $71.5 mil-
aluminum costs.
lion payment from Molson Breweries (Molson) to settle legal dis-
Operating income grew 6.3% to $123.2 million in 1998 as
putes with ACC and CBC, less approximately $3.2 million in related
a result of higher gross profit discussed above, partially offset by
legal expenses. ACC also recorded a $22.4 million reserve related
a 7.6% increase in marketing, general and administrative expenses.
to the recoverability of CBC’s investment in Jinro-Coors Brewing
Advertising costs increased 10.0% over 1997 due to increased
18
21. investments behind the core brands both domestically and interna- LIQUIDITY AND CAPITAL RESOURCES
The Company’s primary sources of liquidity are cash provided by
tionally. General and administrative costs increased primarily due
operating activities and external borrowings. As of December 27, 1998,
to increased spending on Year 2000 compliance issues.
ACC had working capital of $165.1 million, and its net cash position
Net non-operating income of $7.3 million in 1998 changed
was $160.0 million compared to $168.9 million as of December 28,
from a net expense position of $0.5 million in 1997. This $7.8 mil-
1997, and $110.9 million as of December 29, 1996. In addition to its
lion change is primarily due to higher interest income resulting
cash resources, ACC had short-term investments of $96.2 million at
from higher cash balances, lower interest expense from lower debt
December 27, 1998, compared to $42.2 million at December 28, 1997.
balances and the sale in the fourth quarter of certain patents related
ACC also had $31.4 million of marketable investments with maturities
to aluminum can decorating technologies.
exceeding one year at December 27, 1998, compared to $47.1 million
The Company’s effective tax rate decreased to 39.0% in 1998
at December 28, 1997. ACC had no marketable investments other
from 40.8% in 1997 primarily due to higher tax-exempt income and
than cash equivalents at December 29, 1996. The Company believes
lower state tax expense. The 1998 effective tax rate exceeded the
that cash flows from operations and short-term borrowings will be
statutory rate primarily because of state tax expense.
sufficient to meet its ongoing operating requirements; scheduled prin-
Net earnings for 1998 were $79.6 million, or $2.19 per basic
cipal and interest payments on indebtedness; dividend payments;
share ($2.12 per diluted share), compared to $68.3 million, or $1.84
costs to make computer software Year 2000 compliant; and anticipated
per basic share ($1.80 per diluted share), for 1997, representing
capital expenditures in the range of approximately $90 million to
increases of 19.0% (basic) and 17.8% (diluted) in earnings per share.
$100 million for production equipment, information systems, repairs
1997 vs. 1996: Net sales increased 4.6% driven primarily by an and upkeep, and environmental compliance.
increase in unit volume of 2.7%. This increase in net sales was
Operating activities: Net cash provided by operating activities was
also attributable to increased international sales, which generate
$181.1 million for 1998, $260.6 million for 1997 and $189.6 mil-
higher net revenue per barrel than domestic sales; greater revenues
lion for 1996. The decrease in operating cash flows in 1998 from
related to the Canadian business due to the favorable impact of the
1997 of $79.4 million is primarily a result of the Molson settlement
interim agreement in effect during 1997 with Molson Breweries;
included in the 1997 cash flows from operations.
and net price increases.
The increase in cash flows provided by operating activities
Gross profit in 1997 rose 13.0% to $689.7 million from 1996
in 1997 compared to 1996 was attributable primarily to higher net
due to the 4.6% increase in net sales, as discussed above, while cost
income, decreases in inventories and other assets, and increases in
of goods sold were flat. Increases in cost of goods caused by higher
accounts payable and accrued expenses and other liabilities, partially
sales volume were offset by reduced can costs; higher income recog-
offset by increases in accounts and notes receivable. The decrease in
nized from CBC’s joint ventures, which produce bottles and cans;
inventories primarily resulted from lower levels of packaging supplies
lower costs related to fixed asset write-offs; lower costs for
inventories on hand. The decrease in other assets was due to a reduc-
employee benefits; and less depreciation expense.
tion in other supplies. The increase in accounts payable and accrued
Operating income increased 33.0% to $115.9 million in 1997
expenses and other liabilities relative to 1996 reflected accruals for
as a result of the higher gross profit discussed above, offset by a
incentive compensation and increased payables for excise taxes. The
9.7% increase in marketing, general and administrative expenses.
increase in accounts and notes receivable reflects higher sales volumes
Advertising costs increased 8.5% over 1996, with increased market-
and higher amounts due from container joint venture partners.
ing investment in premium brands and international advertising
costs. General and administrative costs increased primarily due to Investing activities: During 1998, ACC spent $124.0 million on invest-
incentive compensation, continued investment in both domestic and ing activities compared to $127.9 million in 1997 and $51.4 million in
international sales organizations, higher costs of operating distribu- 1996. The 1998 decrease was due primarily to net changes in ACC’s
torships (a distributorship was acquired in mid-1997) and increases marketable securities with extended maturities that are not considered
in administrative and start-up costs for certain foreign operations. cash equivalents offset by increases in property additions. The net of
Net non-operating expenses in 1997 declined significantly from purchases over sales of these marketable securities was $39.3 million
1996 because of a 60.6% decrease in net interest expense partially in 1998. Capital expenditures increased to $104.5 million in 1998
offset by a 28.2% decrease in miscellaneous income. Increased cash from $60.4 million in 1997 and $65.1 million in 1996. In 1998, capital
and investment balances attributed to improved cash flow resulted expenditures focused primarily on information systems and facilities
in higher interest income on investments, causing the change in net maintenance. Additional expenditures were incurred for cost reduction
interest expense. Decreased royalties earned on certain can produc- and capacity and quality improvements. In 1997, capital expenditures
tion technologies caused the decrease in miscellaneous income. focused on enhancing packaging operations, while 1996 expenditures
The Company’s effective tax rate decreased to 40.8% in 1997 focused on information systems and expansion of packaging capacity.
from 41.8% in 1996 primarily due to higher tax-exempt income and Proceeds from property sales were $2.3 million in 1998, compared to
foreign tax credits. The 1997 effective tax rate exceeded the statutory $3.3 million in 1997 and $8.1 million in 1996. The distributions from
rate primarily because of the effects of certain foreign investments. joint ventures increased to $22.4 million in 1998 from $13.3 million
Net earnings for 1997 were $68.3 million, or $1.84 per basic in 1997 and $5.0 million in 1996. The increase in these distributions
share ($1.80 per diluted share), compared to $47.3 million, or $1.25 during 1998 was mainly attributable to the Coors Canada partnership,
per basic share ($1.24 per diluted share) for 1996, representing which commenced operations in January 1998. In 1997, the increase
increases of 47.2% (basic) and 45.2% (diluted) in earnings per share. in distributions was mainly due to increased cash flow from operations
and reduced capital expenditures at a certain joint venture.
19
22. Financing activities: During 1998, the Company spent $66.0 million hockey and basketball teams. With the addition of this agreement,
on financing activities primarily due to principal payments on ACC’s the Company’s total commitments for advertising and promotions
medium-term notes of $27.5 million, net purchases of Class B com- at sports arenas, stadiums and other venues and events are approxi-
mon stock for $17.8 million and dividend payments of $21.9 million. mately $97 million over the next 10 years.
Net cash used in financing activities was $72.0 million during
Hedging activities: As of December 27, 1998, hedging activities con-
1997 primarily attributable to principal payments on ACC’s medium-
sisted of hard currency forward contracts and purchased options to
term notes of $20.5 million, net purchases of Class B common stock
directly offset hard currency exposures and swap contracts to reduce
for $35.6 million and dividend payments of $20.5 million.
exposure to interest rate fluctuations on certain investment securi-
ACC spent $59.3 million on financing activities during 1996
ties. The forward contracts are irrevocable contracts, whereas the
due to principal payments on its medium-term notes of $38.0 mil-
options give the Company the right, but not the obligation, to exer-
lion, net purchases of Class B common stock for $2.3 million and
cise the option on the expiration date. The forward contracts and
dividend payments of $19.0 million.
options, as well as the swap contracts, reduce the risk to financial
Debt obligations: As of December 27, 1998, ACC had $40.0 million position and results of operations due to changes in the underlying
outstanding in medium-term notes, which will become due in 1999. foreign exchange or interest rate. Any variation in the rate accruing
With cash on hand, the Company repaid principal of $27.5 million to the contract or option would be offset by a similar change in
and $20.5 million on these notes in 1998 and 1997, respectively. the related exposure. Therefore, upon execution of the contract
Fixed interest rates on these notes range from 8.63% to 8.73%. ACC or option, variations in rates would not adversely impact the
also had $100 million outstanding in Senior Notes as of December 27, Company’s financial statements. ACC’s hedging activities and hard
1998. The repayment schedule is $80 million in 2002 and the remain- currency exposures are minimal. The Company does not enter into
ing $20 million in 2005. Fixed interest rates on these notes range derivative financial instruments for speculation or trading purposes.
from 6.76% to 6.95%.
Stock repurchase plan: On November 12, 1998, the board of directors
The Company’s debt to total capitalization ratio was 15.8%
authorized the extension of the Company’s stock repurchase program
in 1998, 19.0% at the end of 1997 and 21.2% at the end of 1996.
through 1999. The program authorizes repurchases of up to $40 million
Revolving line of credit: In addition to the medium-term notes and of ACC’s outstanding Class B common stock during 1999. Repurchases
the Senior Notes, the Company has an unsecured, committed credit will be financed by funds generated from operations or possibly from
arrangement totaling $200 million and as of December 27, 1998, short-term borrowings. The Company spent approximately $27.6 mil-
had all $200 million available. This line of credit has a five-year term lion in 1998 to repurchase common stock, primarily in purchasing
that expires in 2002, with two optional one-year extensions. During approximately 766,000 shares of outstanding Class B common stock
1998, one of the one-year extension options was exercised, which under the previously approved stock repurchase program.
extended the maturity to 2003. A facilities fee is paid on the total
Investment in Jinro-Coors Brewing Company: CBC invested approx-
amount of the committed credit. Under the arrangement, the
imately $22 million for a 33% interest in JCBC in 1992. CBC has
Company is required to maintain a certain debt to total capitalization
accounted for this investment under the cost basis of accounting,
ratio, with which the Company was in compliance at year-end 1998.
given that CBC has not had the ability to exercise significant
CBC’s distribution subsidiary in Japan has two revolving lines
influence over JCBC and that CBC’s investment in JCBC has been
of credit that it uses in normal operations. Each of these facilities
considered temporary. This investment included a put option that
provides up to 500 million yen (approximately $4.3 million each as
was exercised by CBC in December 1997. The put option entitled
of December 27, 1998) in short-term financing. As of December 27,
CBC to require Jinro Limited (the 67% owner of JCBC) to purchase
1998, the approximate yen equivalent of $5.9 million was outstand-
CBC’s investment at the greater of cost or market value (both meas-
ing under these arrangements and included in “accrued expenses
ured in Korean won).
and other liabilities” in the consolidated balance sheets.
Beginning in April 1997, Jinro Limited, a publicly traded sub-
Pension plan and postretirement plan amendments: In November sidiary of Jinro Group, missed debt payments and began attempting
1998, the ACC board of directors approved changes to one of its to restructure. In response to its financial difficulties and those of
defined benefit pension plans and one of its postretirement plans that its subsidiaries (including JCBC), Jinro Group has been working
provides medical benefits and life insurance for eligible dependents. with its creditors and the Korean government to restructure its
The changes, which will result in amendments to the respective debts and has been selling real estate and merging and/or selling
plans, will be effective July 1, 1999, and will increase the projected businesses. The financial difficulties of JCBC and Jinro Limited, the
benefit obligation at the effective date of the defined benefit plan and guarantor of the put option discussed above, called into question
the postretirement plan by approximately $48 million and $6.7 mil- the recoverability of CBC’s investment in JCBC. Therefore, during
lion, respectively. To offset the increase in the projected benefit the second quarter of 1997, CBC fully reserved for its investment in
obligation of the defined benefit pension plan, the Company made JCBC. This reserve was classified as a special charge in the accom-
a $48 million contribution to the plan in January 1999. panying statements of income.
When CBC exercised its put option in December 1997, it reclassified
Advertising and promotions: In July 1998, the Company announced
its investment in JCBC to a note receivable from Jinro Limited. Since Jinro
a long-term sponsorship and promotion agreement with the owners
Limited’s obligation under the put option is measured in Korean won and
of the Pepsi Center™, an arena under construction in Denver,
given the current significant devaluation of that currency, the full amount
Colorado, which will be the future home of the city’s professional
received from Jinro Limited would be significantly less than the value of
20
23. CBC’s original investment. Jinro Limited, which is operating under pro- • labor issues, including union activities that could require a sub-
tection from its creditors under the Korean composition law, had until stantial increase in cost of goods sold or lead to a strike;
June 1998 to perform its obligation under the put option. It did not per- • significant increases in federal, state or local beer or other
form. The obligation arising from CBC’s put exercise is subject to the excise taxes;
terms of Jinro Limited’s composition plan. The note receivable is unse- • increases in rail transportation rates or interruptions of rail service;
cured and potentially has very little value under the composition plan. • the potential impact of further industry consolidation and the
In February 1999, Jinro Limited announced a plan to sell JCBC change in competitive environment given the planned sale of Stroh;
through international bidding by the end of June 1999. The Company • the impact on CBC’s distribution system of the planned acquisi-
intends to participate in the bidding process. If the plan to sell JCBC tion of Stroh;
is not successful, a program will be set up to liquidate the assets. • risks associated with investments and operations in foreign
countries, including those related to foreign regulatory require-
Cautionary Statement Pursuant to Safe Harbor Provisions
ments; exchange rate fluctuations; and local political, social
of the Private Securities Litigation Reform Act of 1995
and economic factors;
This report contains “forward-looking statements” within
• significant increases in the estimated costs of the Year 2000
the meaning of the federal securities laws. These forward-looking
project; and
statements may include, among others, statements concerning the
• the risk that computer systems of the Company or its significant
Company’s outlook for 1999; overall volume trends; pricing trends
suppliers or customers may not be Year 2000 compliant.
and industry forces; cost reduction strategies and their results; the
These and other risks and uncertainties affecting the Company
Company’s expectations for funding its 1999 capital expenditures and
are discussed in greater detail in this report and in the Company’s
operations; the Company’s expectations for funding work on computer
other filings with the Securities and Exchange Commission.
software to make it compliant with Year 2000; and other statements
of expectations, beliefs, future plans and strategies, anticipated events
OUTLOOK FOR 1999
or trends and similar expressions concerning matters that are not
Volume gains are expected to increase net sales in 1999; how-
historical facts. These forward-looking statements are subject to risks
ever, the pricing environment is expected to be more favorable than
and uncertainties that could cause actual results to differ materially
in the past few years. Continuing increased value-pack activity
from those expressed in or implied by the statements.
could have an unfavorable impact on top-line performance due
To improve its financial performance, the Company must grow
to lower margins.
premium beverage volume, achieve modest price increases for its
For fiscal year 1999, raw material costs per barrel are expected
products and reduce its overall cost structure. The most important fac-
to be down slightly, while fixed costs and freight costs per barrel are
tors that could influence the achievement of these goals — and cause
expected to be fairly flat. This outlook could change if cost trends
actual results to differ materially from those expressed in the forward-
change during the first nine months of 1999. CBC continues to
looking statements — include, but are not limited to, the following:
pursue improvements in its operations and technology functions
• the inability of the Company and its distributors to develop and
to achieve cost reductions over time.
execute effective marketing and sales strategies for Coors products;
Advertising costs are expected to increase in 1999 while other
• the potential erosion of sales revenues through discounting
general and administrative costs are expected to have minimal
or a higher proportion of sales in value-packs;
fluctuation from 1998. Management continues to monitor CBC’s
• a potential shift in consumer preferences toward lower-priced products;
market opportunities and to invest behind its brands and sales
• a potential shift in consumer preferences away from the
efforts accordingly. Incremental sales and marketing spending will
premium light beer category, including Coors Light;
be determined on an opportunity-by-opportunity basis. However,
• a potential shift in consumer preferences away from products
the competitive battleground appears to be shifting to marketing
packaged in aluminum cans, which are less expensive, toward
and advertising, possibly resulting in the incremental revenue
bottled products;
generated by price increases being spent on advertising.
• the intensely competitive, slow-growth nature of the beer industry;
See the item titled Year 2000 under “CONTINGENCIES” of this
• demographic trends and social attitudes that can reduce beer sales;
section for a discussion of the expected financial impact of this issue.
• the continued growth in the popularity of imports and other
Total net interest income is expected to be lower in 1999
specialty beers;
based on CBC’s lower cash balances offset by lower outstanding
• increases in the cost of aluminum, paper packaging and other
debt relative to its 1998 financial position. Lower returns on cash
raw materials;
balances also are expected due to lower anticipated yields. Net
• the Company’s inability to reduce manufacturing, freight and
interest income could be less favorable than expected if the
overhead costs to more competitive levels;
Company decides to invest a substantial portion of its cash bal-
• changes in significant laws and government regulations affecting
ances back into the Company. Additional outstanding common
environmental compliance and income taxes;
stock may be repurchased in 1999 as approved by the ACC board
• the inability to achieve targeted improvements in CBC’s
of directors in November 1998.
distribution system;
The effective tax rate for 1999 is not expected to differ signifi-
• the imposition of restrictions on advertising (e.g., media, outdoor
cantly from the 1998 effective tax rate applied to income excluding
ads or sponsorships);
special items. The level and mix of pretax income for 1999 could
affect the actual rate for the year.
21