Erie Indemnity Company reported financial results for the third quarter of 2005. Net income decreased 9.5% to $53 million compared to the same period in 2004. Management fee revenue, which Erie receives from providing services to its property and casualty subsidiaries, decreased 2.9% due to lower direct written premiums and a slightly lower management fee rate. The property and casualty subsidiaries reported a higher combined ratio of 85.9% compared to 83% in the prior year, as favorable reserve adjustments in prior periods were not repeated. However, the company did not experience any losses from Hurricanes Katrina and Rita. Erie will continue efforts to enhance its competitive positioning and profitability.
1. ERIE INDEMNITY COMPANY
2005 THIRD QUARTER
SHAREHOLDERS’ REPORT
After making significant improvements in our underwriting its property/casualty subsidiary and the Company’s three
profitability over the past few years, we have demonstrated property/casualty subsidiaries (collectively, the “Property
our ability to sustain that favorable pattern. This is allowing and Casualty Group”) write personal and commercial
the Company to take rating actions that will enhance lines property/casualty coverages exclusively through
our competitive position in our markets, and positively independent agents and pool their underwriting results.
impact the Property and Casualty Group’s ability to attract The financial position or results of operations of the
new policyholders and to retain existing policyholders. Exchange are not consolidated with those of the Company.
We are already experiencing positive growth trends in
The Company’s earnings are largely generated by fees
our homeowners and commercial lines of business. We
based on direct written premiums of the Property and
are optimistic that trend will continue, and that we will
Casualty Group, the principal member of which is the
make progress in generating additional profitable private
Exchange. The Company, therefore, has a direct incentive
passenger auto business.
to protect the financial condition of the Exchange. The
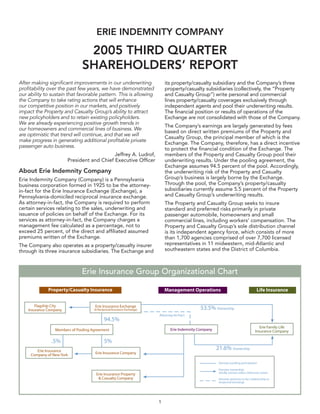
Jeffrey A. Ludrof, members of the Property and Casualty Group pool their
President and Chief Executive Officer underwriting results. Under the pooling agreement, the
Exchange assumes 94.5 percent of the pool. Accordingly,
About Erie Indemnity Company the underwriting risk of the Property and Casualty
Group’s business is largely borne by the Exchange.
Erie Indemnity Company (Company) is a Pennsylvania
Through the pool, the Company’s property/casualty
business corporation formed in 925 to be the attorney-
subsidiaries currently assume 5.5 percent of the Property
in-fact for the Erie Insurance Exchange (Exchange), a
and Casualty Group’s underwriting results.
Pennsylvania-domiciled reciprocal insurance exchange.
As attorney-in-fact, the Company is required to perform The Property and Casualty Group seeks to insure
certain services relating to the sales, underwriting and standard and preferred risks primarily in private
issuance of policies on behalf of the Exchange. For its passenger automobile, homeowners and small
services as attorney-in-fact, the Company charges a commercial lines, including workers’ compensation. The
management fee calculated as a percentage, not to Property and Casualty Group’s sole distribution channel
exceed 25 percent, of the direct and affiliated assumed is its independent agency force, which consists of more
premiums written of the Exchange. than ,700 agencies comprised of over 7,700 licensed
representatives in midwestern, mid-Atlantic and
The Company also operates as a property/casualty insurer
southeastern states and the District of Columbia.
through its three insurance subsidiaries. The Exchange and
Erie Insurance Group Organizational Chart
2. Corporate Information
Financial Information Stock Transfer Agent
The Erie Indemnity Company submits a quarterly report American Stock Transfer Trust Company
to the Securities and Exchange Commission on Form 59 Maiden Lane
0-Q. Shareholders may obtain a copy of the Form 0-Q Plaza Level
report without charge by writing to: Chief Financial New York, NY 0038
Officer, Erie Indemnity Company, 00 Erie Insurance (800) 937-5449
Place, Erie, PA, 6530 or by visiting the Company’s Web
Corporate Headquarters
site at www.erieinsurance.com.
00 Erie Insurance Place
Common Stock Information Erie, PA 6530
The Erie Indemnity Company’s Class A, non-voting (84) 870-2000
common stock is traded on the NASDAQ Stock Market
Internet Address
under the symbol “ERIE.” Quotations are available via
major financial news sources. Financial statement filings, shareholder information, press
releases and general news about the Company may also
be accessed at www.erieinsurance.com.
Erie Indemnity Company Third Quarter 2005 Results
Highlights of the third quarter 2005 results of the Erie The property and casualty direct written premiums of
Indemnity Company are as follows: the Erie Insurance Group, upon which management fee
revenue is calculated, totaled $.0 billion in the third
• Net income totaled $53.0 million, a decrease of 9.5
quarter of 2005, down 2. percent from third quarter of
percent from $58.6 million at September 30, 2004.
2004. The average written premium per policy increased
• Net income per share decreased by 8.4 percent to by .2 percent for the twelve months ended September
$.76 per share, compared to $.83 per share in the 30, 2005, to $,055, as compared to $,042 for the twelve
comparable quarter for 2004. months ended September 30, 2004.
• Net income, excluding net realized gains on The Company’s emphasis on underwriting profitability,
investments and related federal income taxes, more competitive market conditions and slight decreases
decreased by 0.6 percent to $5.9 million, or $.74 in rates resulted in a slowing of growth in new business
per share, from $58.0 million, or $.82 per share, for the premiums written. New property and casualty premium
same period one year ago. written for Erie Insurance Group declined 2.9 percent to
$00.7 million in the third quarter of 2005 from $03.6
• Management fee revenue decreased by .9 percent to
million in the third quarter of 2004. Personal lines new
$24.6 million, from $246.4 million for the same period
premium written declined 5.4 percent, while commercial
one year ago.
lines new premium written increased 3.4 percent in the
• The Property and Casualty Group’s adjusted statutory third quarter of 2005 compared to the same period in
combined ratio for the third quarter 2005 was 85.9 2004. The year-over-year policy retention rate declined to
percent, compared to 83.0 percent a year earlier. The 88.4 percent at September 30, 2005 from 88.7 percent
Company experienced no underwriting losses as a at September 30, 2004. The third quarter of 2005 policy
result of Hurricanes Katrina and Rita. retention rate of 88.4 percent was a slight increase from
the 88.3 percent rate recorded at the end of the second
Management operations quarter of 2005.
Management fee revenue decreased by .9 percent to In the latter part of 2004 and into 2005, the Property
$24.6 million for the quarter ended September 30, and Casualty Group implemented insurance scoring for
2005, compared to $246.4 million for the same period underwriting purposes for its private passenger auto and
one year ago. Management fee revenue was reduced by homeowners lines of business in most of its operating
$.6 million and $4.6 million in the third quarters of 2005 states in response to changing competitive market
and 2004, respectively, for the allowance for mid-term conditions. Insurance scoring has also been incorporated,
policy cancellations. Management fee revenue is based along with other risk characteristics, into a rating plan with
on the management fee rate, established by the Board of multiple pricing tiers. This segmented pricing provides
Directors, and the direct written premiums of the Property the Property and Casualty Group greater flexibility in
and Casualty Group. The lower management fee rate in pricing policies with varying degrees of risk. The rating
the third quarter of 2005 of 23.75 percent, compared to plan with multiple pricing tiers was implemented in most
24 percent in the third quarter of 2004, resulted in $2.6 states for new business in March 2005 and for renewal
million less in management fee revenue for the quarter business in April 2005. In 2006, the Company anticipates
ended September 30, 2005, or a decrease in diluted net implementing additional pricing segmentations in auto
income per share of $.02. and homeowners insurance.
2
3. The effect of rate increases implemented in 2004 aggregate excess-of-loss reinsurance arrangement
offset by 2005 pricing actions approved, filed, awaiting for accident year 200, which offset the effect of the
approval or contemplated through September 30, reduction in assumed reserves. As a result, reinsurance
2005, is anticipated to result in a net decrease in written charges under the excess-of-loss reinsurance arrangement
premiums of $0. million. The majority of the rate with the Exchange were $2.2 million for the third quarter
decreases stems from the private passenger auto and 2005 compared to $.2 million in the third quarter 2004.
the homeowners lines of business in Pennsylvania. In the The impact of seasonal fluctuations was offset by
majority of states, an 8 percent rate reduction on certain positive development of prior accident year losses, which
coverages for new private passenger auto policyholders improved the Property and Casualty Group’s statutory
with no claims or violations was effective July , 2005. combined ratio by .8 points. Catastrophe losses, as
In Tennessee and West Virginia this rate reduction for classified by the Company, during the third quarter of
policyholders with no claims or violations was 6 percent. 2005, added 0.5 points to the Property and Casualty
Pricing actions anticipated in 2005 are a result of the Group’s reported statutory combined ratio. The Company
improvement in underwriting results. Pricing actions experienced no underwriting losses from Hurricanes
approved, contemplated or filed and awaiting approval Katrina and Rita during the third quarter of 2005 or
through September 30, 2005, could reduce written Hurricane Wilma in October 2005.
premium in 2006 for the Property and Casualty Group by
$87.4 million. Investment operations
The cost of management operations increased 3.6 Net revenue from investment operations for the third
percent to $94.8 million in the third quarter of 2005, quarter of 2005 reflects an increase of 8.7 percent to
from $88.0 million for the same period in 2004. $25. million, compared to $2.2 million for the same
Commission costs totaled $40.3 million for the third period in 2004. Net investment income was $4.8 million
quarter of 2005, a 0. percent increase from the $40.2 for each of the quarters ended September 30, 2005 and
million reported in the third quarter of 2004. Third quarter 2004. Net realized gains on investments of $.8 million
costs of management operations, excluding commissions, were recorded during the third quarter of 2005 compared
increased 4.0 percent to $54.5 million in 2005 from to $0.9 million for the third quarter of 2004.
$47.8 million in 2004, primarily due to increased
Equity in earnings of limited partnerships totaled $8.0
personnel costs, including contract labor for information
million in the third quarter of 2005, compared to $3.8
technology projects and higher underwriting expenses
million in the third quarter of 2004. During the third
related to the use of insurance scoring in 2005.
quarter of 2005, the Company recorded earnings
Insurance underwriting operations from one partnership of $4.4 million in the form of a
distribution.
The Company’s insurance underwriting operations
The Company’s earnings from its 2.6 percent equity
generated underwriting income of $.7 million in the third
ownership of Erie Family Life decreased to $0.6 million
quarter of 2005 compared to $2.9 million in the third
for the third quarter of 2005 from $.7 million in the third
quarter of 2004. Underlying the Company’s results were
quarter 2004. The results in the third quarter of 2005
the underwriting results of the Property and Casualty
reflect a $0.5 million charge for a change in estimate
Group.
related to a new FAS 60 reserve valuation system
For the third quarter 2005, the reported statutory implemented by Erie Family Life during the quarter.
combined ratio of the Property and Casualty Group was
During the third quarter of 2005, the Company
90.5, and when adjusted for the profit component of the
repurchased 395,445 shares of its outstanding Class A
management fee, the combined ratio was 85.9 for the
common stock in conjunction with the stock repurchase
quarter, compared to a reported statutory combined ratio
plan that was authorized in December 2003. The shares
of 88.6 and an adjusted combined ratio of 83.0 for the
were purchased at a total cost of $20.8 million, or an
third quarter 2004. The Property and Casualty Group’s
average price per share of $5.90. The Company has
statutory combined ratio increased in the third quarter
$49 million remaining in its current share repurchase
of 2005 as a result of an increase of $47.0 million (net of
authorization.
ceded recoveries) to pre-986 automobile catastrophic
injury liability reserves, or a 4.7 point increase to the Erie Indemnity Company provides management services
statutory combined ratio, and seasonal increases in claim to the member companies of the Erie Insurance Group,
volume, which are recognized in the quarter in which they which includes the Erie Insurance Exchange, Flagship
occur, contributed 6. points to the statutory combined City Insurance Company, Erie Insurance Company,
ratio. The assumed loss and loss adjustment expense Erie Insurance Property and Casualty Company, Erie
reserves related to the September , 200, attack Insurance Company of New York and Erie Family Life
on the World Trade Center were reduced in the third Insurance Company. According to A.M. Best Company,
quarter 2005 by $42 million, decreasing the Property and Erie Insurance Group, based in Erie, Pennsylvania, is
Casualty Group’s statutory combined ratio by 4.2 points the 6th largest automobile insurer in the United States
for the quarter. While the Company’s GAAP combined based on direct premiums written and the 22nd largest
ratio was impacted by these reserve adjustments, the property/casualty insurer in the United States based on
reduction in the World Trade Center assumed loss and total lines net premium written. The Group, rated A+
loss adjustment expense reserves triggers a reduction in (Superior) by A.M. Best Company, has almost 3.8 million
previously recorded recoveries under the intercompany
3
4. policies in force and operates in states and the District profitability and business relationships and the Company’s other
business activities during 2005 and beyond. In some cases, you
of Columbia. Erie Insurance Group ranked 425 on the
can identify forward-looking statements by terms such as “may,”
FORTUNE 500 and is included in Forbes Magazine’s
“will,” “should,” “could,” “would,” “expect,” “plan,” “intend,”
PLATINUM 400 list of the best-managed companies in
“anticipate,” “believe,” “estimate,” “project,” “predict,”
America.
“potential” and similar expressions. These forward-looking
“Safe Harbor” Statement Under the Private Securities statements reflect the Company’s current views about future
Litigation Reform Act of 1995: Certain forward-looking events, are based on assumptions and are subject to known and
statements contained herein involve risks and uncertainties. These unknown risks and uncertainties that may cause results to differ
statements include certain discussions relating to management materially from those anticipated in those statements. Many of
fee revenue, cost of management operations, underwriting, the factors that will determine future events or achievements are
premium and investment income volume, business strategies, beyond our ability to control or predict.
CONSOLIDATED STATEMENTS OF OPERATIONS
(Amounts in thousands, except per share data)
Three months ended Nine months ended
September 30 September 30
2005 2004 2005 2004
(unaudited) (unaudited)
Operating revenue
Management fee revenue—net $ 228,349 $ 232,837 $ 686,475 $ 684,539
Premiums earned 53,908 52,862 6,72 54,576
Service agreement revenue 5,294 5,384 5,440 6,207
Total operating revenue 287,551 291,083 863,636 855,322
Operating expenses
Cost of management operations 84,056 77,659 539,228 52,599
Losses and loss adjustment expenses incurred 36,995 34,602 03,457 2,642
Policy acquisition and other underwriting expenses 2,637 2,53 36,836 35,906
Total operating expenses 233,688 224,414 679,521 670,147
Investment income—unaffiliated
Investment income, net of expenses 4,755 4,795 45,58 45,086
Net realized gains on investments ,765 859 6,457 6,743
Equity in earnings of limited partnerships 8,032 3,845 30,788 5,727
Total investment income—unaffiliated 24,552 19,499 92,403 57,556
Income before income taxes and equity in earnings of
Erie Family Life Insurance Company 78,45 86,68 276,58 242,73
Provision for income taxes 25,930 29,4 92,24 8,865
Equity in earnings of Erie Family Life Insurance
Company, net of tax 520 ,539 2,667 4,227
Net income $ 53,005 $ 58,566 $ 186,944 $ 165,093
Net income per share—Class A basic $ 0.84 $ 0.92 $ 2.97 $ 2.58
Net income per share—Class B basic $ 128.01 $ 139.84 $ 450.68 $ 393.52
Net income per share—diluted $ 0.76 $ 0.83 $ 2.69 $ 2.34
Weighted average shares outstanding—diluted 69,320 70,259 69,563 70,657
Dividends declared per share
Class A common stock $ 0.325 $ 0.25 $ 0.975 $ 0.645
Class B common stock $ 48.75 $ 32.25 $ 46.25 $ 96.75
4
5. CONSOLIDATED STATEMENTS OF OPERATIONS—SEGMENT BASIS
(Amounts in thousands, except per share data)
Three months ended Nine months ended
September 30 September 30
2005 2004 2005 2004
(unaudited) (unaudited)
Management operations
Management fee revenue $ 24,639 $ 246,388 $ 726,429 $ 724,379
Service agreement revenue 5,294 5,384 5,440 6,207
Total revenue from management operations 246,933 25,772 74,869 740,586
Cost of management operations 94,768 87,998 570,62 55,957
Income from management operations 52,165 63,774 171,257 188,629
Insurance underwriting operations
Premiums earned 53,908 52,862 6,72 54,576
Losses and loss adjustment expenses incurred 36,995 34,602 03,457 2,642
Policy acquisition and other underwriting expenses 5,25 5,365 45,407 45,389
Total losses and expenses 52,20 49,967 48,864 58,03
Underwriting gain (loss) 1,698 2,895 12,857 ( 3,455)
Investment operations
Net investment income 4,755 4,795 45,58 45,086
Net realized gains on investments ,765 859 6,457 6,743
Equity in earnings of limited partnerships 8,032 3,845 30,788 5,727
Equity in earnings of Erie Family Life Insurance Company 560 ,654 2,868 4,545
Net revenue from investment operations 25,112 21,153 95,271 62,101
Income before income taxes 78,975 87,822 279,385 247,275
Provision for income taxes 25,970 29,256 92,44 82,82
Net income $ 53,005 $ 58,566 $ 186,944 $ 165,093
Net income per share—diluted $ 0.76 $ 0.83 $ 2.69 $ 2.34
Amounts presented on a segment basis are presented gross of intercompany/intersegment items.
5
6. RECONCILIATION OF OPERATING INCOME TO NET INCOME
For the Periods Ended September 30, 2005 and 2004
Definition of Non-GAAP and Operating management services, insurance underwriting and
Measures investment operations that may be obscured by
the net effects of realized capital gains and losses.
Management believes that investors’ understanding
Realized capital gains and losses may vary significantly
of the Company’s performance is enhanced by the
between periods and are generally driven by business
disclosure of the following non-GAAP financial measure.
decisions and economic developments such as capital
The Company’s method of calculating this measure may
market condition, the timing of which is unrelated to
differ from those used by other companies; therefore,
management services and the insurance underwriting
comparability may be limited.
processes of the Company. The Company believes it
Operating income is net income excluding realized is useful for investors to evaluate these components
capital gains and losses and related federal income separately and in the aggregate when reviewing the
taxes. Equity in earnings or losses of Erie Family Life Company’s performance. The Company is aware that the
Insurance Company and equity in earnings or losses of price-to-earnings multiple, commonly used by investors
limited partnerships are not excluded from the calculation as a forward-looking valuation technique, uses operating
of operating income. Both of these categories include income as the denominator. Operating income should
the respective investment’s realized capital gains and not be considered as a substitute for net income and
losses, as well as unrealized gains and losses, as these does not reflect the overall profitability of the Company’s
investments are accounted for under the equity method. business.
Net income is the GAAP measure that is most directly The following table reconciles operating income and net
comparable to operating income. income for the periods ended September 30, 2005 and
2004:
The Company uses operating income to evaluate the
results of operations. It reveals trends in the Company’s
Three months ended Nine months ended
September 30 September 30
2005 2004 2005 2004
(in thousands) (unaudited) (unaudited)
Operating income $ 51,858 $ 58,007 $ 176,247 $ 160,710
Net realized gains on investments ,765 859 6,457 6,743
Income tax expense on realized gains ( 68) ( 300) ( 5,760) ( 2,360)
Realized gains net of income tax expense ,47 559 0,697 4,383
Net income $ 53,005 $ 58,566 $ 186,944 $ 165,093
Three months ended Nine months ended
September 30 September 30
2005 2004 2005 2004
(per share information—diluted) (unaudited) (unaudited)
Operating income $ 0.74 $ 0.82 $ 2.54 $ 2.28
Net realized gains on investments 0.03 0.0 0.24 0.0
Income tax expense on realized gains ( 0.0) ( 0.00) ( 0.09) ( 0.04)
Realized gains net of income tax expense 0.02 0.0 0.5 0.06
Net income $ 0.76 $ 0.83 $ 2.69 $ 2.34
6
7. CONSOLIDATED STATEMENTS OF FINANCIAL POSITION
(Amounts in thousands, except per share data)
September 30 December 3
2005 2004
(unaudited)
Assets
Investments
Fixed maturities $ 988,333 $ 974,52
Equity securities
Preferred stock 69,489 43,85
Common stock 92,690 58,843
Other invested assets 36,5 35,508
Total investments 1,386,663 1,312,714
Cash and cash equivalents 42,735 50,06
Equity in Erie Family Life Insurance Company 56,773 58,728
Premiums receivable from policyholders 287,52 275,72
Receivables from affiliates ,80,095 ,45,238
Other assets 6,988 37,282
Total assets $ 3,115,406 $ 2,979,744
Liabilities and shareholders’ equity
Liabilities
Unpaid losses and loss adjustment expenses $ 985,836 $ 943,034
Unearned premiums 480,404 472,553
Other liabilities 336,887 297,276
Total liabilities 1,803,127 1,712,863
Total shareholders’ equity 1,312,279 1,266,881
Total liabilities and shareholders’ equity $ 3,115,406 $ 2,979,744
Book value per share $ 19.03 $ 18.14
Shares outstanding 68,947 69,852
7