SlideShare une entreprise Scribd logo
1  sur  2
Télécharger pour lire hors ligne
F E AT U R E S   design it ∙ build it ∙ run it ∙ design it ∙ build it ∙ run it ∙ design it ∙ build it ∙ run it ∙ design it ∙ build it ∙ run it ∙ design it
                 build it ∙ run it ∙ design it ∙ build it ∙ run it ∙ design it ∙ build it ∙ run it ∙ design it ∙ build it ∙ run it ∙ design it ∙ build it

                  Embarcadero J Optimizer
                 run it ∙ design it ∙ build it ∙ run it ∙ design it ® build it ∙ run it ∙ design it ∙ build it ∙ run™ ∙ design it ∙ build it ∙ run it
                                                                      ∙                                                it
                 design it ∙ build it ∙ run it ∙ design it ∙ build it ∙ run it ∙ design it ∙ build it ∙ run it ∙ design it ∙ build it ∙ run it ∙ design it
                 build it ∙ run it ∙ design it ∙ build it ∙ run it ∙ design it ∙ build it ∙ run it ∙ design it ∙ build it ∙ run it ∙ design it ∙ build it
                 run it ∙ design it ∙ build it ∙ run it ∙ design it ∙ build it ∙ run it ∙ design it ∙ build it ∙ run it ∙ design it ∙ build it ∙ run it


                       Feature Matrix
    OPERATING SYSTEMS                                                                                          MEMORY ANd CPU PROfILING
       Microsoft Windows XP SP3                                                                                 High-level performance-related data displayed in real time in order
       Microsoft Windows Vista SP1                                                                              to determine whether a performance issue is related to CPU,
                                                                                                                memory, or both.
       Mac OS X (10.5)
                                                                                                                Automatic Memory Leak Detector monitors the evolution of memory
       Red Hat Enterprise Linux 5                                                                               usage over time for the immediate identification of potential memory
       Solaris 10 SPARC (J Optimizer Agent only)                                                                leaks.
    TOUCH-POINT PLUG-INS                                                                                        Real-time monitoring of object allocations to understand how the
                                                                                                                profiled program uses the virtual machine memory; Allocation
       Eclipse 3.3.2, Java and Java EE Editions
                                                                                                                Backtrace View enables identification of the code or part of the
       Eclipse 3.4.1, Java and Java EE Editions                                                                 program responsible for object allocations.
       Genuitec MyEclipse 6.6                                                                                   Object Size Display automatically computes and displays, in real time,
       Genuitec MyEclipse 7.0                                                                                   the amount of memory being consumed by all instances of a class;
                                                                                                                then sort and view by object size to prioritize objects consuming the
       IBM Rational Application Developer 7.5                                                                   most memory.
    APPLICATION SERVERS                                                                                         Reduced reference graph provides a transitive closure of the full
       Apache Geronimo 1.1.1                                                                                    reference graph to display only references that should be removed in
       Apache Geronimo 2.0                                                                                      order to free the object for garbage collection.

       Apache Tomcat 5.0                                                                                        CPU Profiler measures pure CPU usage or time usage during
                                                                                                                a profiling session, with option to use sampling-based or
       Apache Tomcat 5.5                                                                                        instrumentation-based profiler.
       Apache Tomcat 6.0                                                                                        Display profiling information per thread and thread groups, with color
       BEA WebLogic Application Server 9.2 MP3                                                                  highlighting of threads that were busy during profiling session.
       BEA WebLogic Application Server 10.1 MP1                                                                 HotSpot Display lists methods where most time was spent, to help
                                                                                                                identify bottlenecks due to single methods.
       IBM WebSphere 6.1
                                                                                                                Scalable call graph visually isolates critical code. Select a string
       IBM WebSphere 6.1 with EJB 3 Feature Pack                                                                allocation and highlight the flow of a method call to see where
       JBoss 3.2.6                                                                                              memory and time are being spent.
       JBoss 4.0.5                                                                                              Automatic Application Quality Analyzer supports performance-error
       JBoss 4.2                                                                                                prevention and coding standards by automatically detecting VM-level
                                                                                                                performance bugs.
       JBoss 5.0
                                                                                                                Export views in XML, HTML and CSV format.
       Oracle Application Server 10.1.3.3 (Agent support only)
                                                                                                               THREAd dEBUGGING
       Sun GlassFish V1.1 UR1
                                                                                                                Real-time display of the progress of all threads running within the
       Sun GlassFish V2.0 UR2                                                                                   virtual machine.
       Jetty 6.1 (Agent support only)                                                                           Understand thread contentions for a monitor with the detailed panels
    COdE PROfILING ANd PERfORMANCE OPTIMIzATION                                                                 of the Contention View.
       Complete code profiling and performance optimization capabilities                                        Wait state monitoring to understand why a thread is not making
       for identifying and solving code-level performance issues.                                               progress with the Waiting View and I/O Waiting View.
       Improve performance and reliability of any Java code: Java                                               Identify and correct excessive locking where a thread enters and
       applications, Java EE applications, servlets, applets, EJBs, JavaBeans,                                  holds monitors using the Monitor Enter View reports.
       JSP applications, and Java Tag Libraries.                                                                Analyze deadlocks using graphical view of the relationships between
       Easily connect to a remote Java process using the J Optimizer Agent                                      threads and monitors to quickly understand deadlock situations.
       to test a program running on a remote machine.                                                           Predict deadlocks with Monitor Usage Analyzer which generates
       Developers have the option to install J Optimizer touch point                                            full list of warnings and errors that might lead to deadlocks and
       plug-in into an existing Eclipse or Eclipse-based product and make                                       performance bottlenecks, such as lock order warnings, lock and wait
       it profile ready.                                                                                        warnings, and lock and I/O wait warnings.
COdE COVERAGE                                                                                                             REQUEST ANALYzER
Code Coverage helps identify dead code, frequently used code, and                                                          Profile the performance behavior of your Java EE application
unloaded classes in your Java applications.                                                                                code across the following Java EE components: JDBC, JSP, JNDI,
Class Coverage View lists all classes and the real-time test results for                                                   Enterprise JavaBeans, and JMS containers.
each class. You can see how many lines of code have executed, and                                                          Improve performance and reliability of Java EE-related application
you can apply filters to test only certain classes.                                                                        code earlier in development with drill-down performance
Real-time display of all classes and interfaces used by the tested                                                         information for Java EE components.
program and real-time percentage of lines covered per class.                                                               Visual interface simplifies the complexity of Java EE application
Method Coverage View displays the source code for methods in a                                                             interactions using graphical representation.
selected class, as well as statistical information about the number of                                                     System Dashboard view provides a graphical display of the
times your method was called while your test application was running.                                                      application time spent in Java EE components and total number
Source Code Viewer shows lines of code that have never been                                                                of requests. Shows the percentage of use for each server module
executed, making it easier to spot dead code.                                                                              to quickly detect any major component-level performance issues.

Option to display the interfaces that have been loaded by the virtual                                                      System Composite view displays all of the Java EE events that
machine and those that have not been loaded.                                                                               have occurred in an application, in real time, in their proper
                                                                                                                           hierarchy. Hierarchy shows the relationship of events in terms of
Batch-mode support to easily include code coverage in any batch-                                                           which events spawn others.
mode testing process.
                                                                                                                          SNAPSHOTS ANd PROGRESS TRACKER
AUdITS ANd METRICS
                                                                                                                           Snapshots capture all the data from a particular test run, which
Metrics evaluate object model complexity and quantify your code.                                                           can then be opened for analysis in the product that generated it,
Metrics results can be viewed graphically in either bar charts or Kiviat                                                   such as Profiler, Code Coverage, or Request Analyzer.
charts format.                                                                                                             Continuously monitor and measure the impact of performance
Metrics can be used to create reports and compare the overall impact                                                       changes by comparing visual snapshots.
of changes in a project.                                                                                                   Progress Tracker enables you to visually compare, monitor, and
Audits provide information on design issues, naming conventions,                                                           measure the impact of performance changes by comparing visual
and other items which can impact code quality.                                                                             snapshots from Profiler, Code Coverage, and Request Analyzer
                                                                                                                           snapshots.
Audit results can be displayed with descriptions of what each audit
looks for and how to fix violations.                                                                                       Generate reports that can be exported in PDF and HTML format.
Includes a group of audits known as “Bad Smell Audits” that detect
some issues or convention violations in source code (misplaced
classes, attributes and methods, wrong inheritance usage), which
require some code refactoring.
Create specific QA Sets for source code audits and metrics, and save
them to a local file system, or as part of a project which can then be
shared with the team.


                                                                         Download a Free Trial at www.embarcadero.com
Corporate Headquarters | Embarcadero Technologies | 100 California Street, 12th Floor | San Francisco, CA 94111 | www.embarcadero.com | sales@embarcadero.com
     © 2009 Embarcadero Technologies, Inc. Embarcadero, the Embarcadero Technologies logos, and all other Embarcadero Technologies product or service names are trademarks or registered trademarks of Embarcadero Technologies, Inc.
                                                                            All other trademarks are property of their respective owners. JO/FM/2009/03/19

Contenu connexe

Plus de Michael Findling

Tutorpedia Foundation Silent Auction Item List – February 23, 2011
Tutorpedia Foundation Silent Auction Item List – February 23, 2011Tutorpedia Foundation Silent Auction Item List – February 23, 2011
Tutorpedia Foundation Silent Auction Item List – February 23, 2011Michael Findling
 
Website Marketing Seminar 2009
Website Marketing Seminar 2009Website Marketing Seminar 2009
Website Marketing Seminar 2009Michael Findling
 
Reasons to migrate from Delphi 7 to Delphi 2009
Reasons to migrate from Delphi 7  to Delphi 2009Reasons to migrate from Delphi 7  to Delphi 2009
Reasons to migrate from Delphi 7 to Delphi 2009Michael Findling
 
Java Optimization For Faster Code & Better Results | J Optimizer
Java Optimization For Faster Code & Better Results | J OptimizerJava Optimization For Faster Code & Better Results | J Optimizer
Java Optimization For Faster Code & Better Results | J OptimizerMichael Findling
 
Top Ten Reasons to Upgrade from Delphi 7
Top Ten Reasons to Upgrade from Delphi 7Top Ten Reasons to Upgrade from Delphi 7
Top Ten Reasons to Upgrade from Delphi 7Michael Findling
 
Database Tools and Developer Software Licence Management
Database Tools and Developer Software Licence ManagementDatabase Tools and Developer Software Licence Management
Database Tools and Developer Software Licence ManagementMichael Findling
 
Database Design and Data Modeling | PowerDesigner to All Access
Database Design and Data Modeling | PowerDesigner to All AccessDatabase Design and Data Modeling | PowerDesigner to All Access
Database Design and Data Modeling | PowerDesigner to All AccessMichael Findling
 
Preventing Database Perfomance Issues | DB Optimizer
Preventing Database Perfomance Issues | DB OptimizerPreventing Database Perfomance Issues | DB Optimizer
Preventing Database Perfomance Issues | DB OptimizerMichael Findling
 
Build Windows Applications Fast | Delphi Prism
Build Windows Applications Fast | Delphi PrismBuild Windows Applications Fast | Delphi Prism
Build Windows Applications Fast | Delphi PrismMichael Findling
 
Develop Enterprise Java Applications | JBuilder
Develop Enterprise Java Applications | JBuilderDevelop Enterprise Java Applications | JBuilder
Develop Enterprise Java Applications | JBuilderMichael Findling
 
Develop Ruby Applications Fast | TubroRuby
Develop Ruby Applications Fast | TubroRubyDevelop Ruby Applications Fast | TubroRuby
Develop Ruby Applications Fast | TubroRubyMichael Findling
 
Develop Ruby Applications Fast | TubroRuby
Develop Ruby Applications Fast | TubroRubyDevelop Ruby Applications Fast | TubroRuby
Develop Ruby Applications Fast | TubroRubyMichael Findling
 
Business Process Modeling | Embarcadero Technologies EA/Studio
Business Process Modeling | Embarcadero Technologies EA/StudioBusiness Process Modeling | Embarcadero Technologies EA/Studio
Business Process Modeling | Embarcadero Technologies EA/StudioMichael Findling
 
Secure Applications With 3rdRail and TurboRuby
Secure Applications With 3rdRail and TurboRubySecure Applications With 3rdRail and TurboRuby
Secure Applications With 3rdRail and TurboRubyMichael Findling
 
Optimizing Your Database Performance | Embarcadero Technologies
Optimizing Your Database Performance | Embarcadero TechnologiesOptimizing Your Database Performance | Embarcadero Technologies
Optimizing Your Database Performance | Embarcadero TechnologiesMichael Findling
 
PowerSQL Aids Application Developer Productivity
PowerSQL Aids Application Developer ProductivityPowerSQL Aids Application Developer Productivity
PowerSQL Aids Application Developer ProductivityMichael Findling
 
Data Modeling Lineage | Embarcadero Technoloiges
Data Modeling Lineage | Embarcadero TechnoloigesData Modeling Lineage | Embarcadero Technoloiges
Data Modeling Lineage | Embarcadero TechnoloigesMichael Findling
 
Ten Ways For DBA's To Save Time
Ten Ways For DBA's To Save TimeTen Ways For DBA's To Save Time
Ten Ways For DBA's To Save TimeMichael Findling
 
Optimizer Para Py Mes Entrevista Sinergia Empresaria
Optimizer Para Py Mes Entrevista Sinergia EmpresariaOptimizer Para Py Mes Entrevista Sinergia Empresaria
Optimizer Para Py Mes Entrevista Sinergia EmpresariaMichael Findling
 

Plus de Michael Findling (20)

Tutorpedia Foundation Silent Auction Item List – February 23, 2011
Tutorpedia Foundation Silent Auction Item List – February 23, 2011Tutorpedia Foundation Silent Auction Item List – February 23, 2011
Tutorpedia Foundation Silent Auction Item List – February 23, 2011
 
Website Marketing Seminar 2009
Website Marketing Seminar 2009Website Marketing Seminar 2009
Website Marketing Seminar 2009
 
Reasons to migrate from Delphi 7 to Delphi 2009
Reasons to migrate from Delphi 7  to Delphi 2009Reasons to migrate from Delphi 7  to Delphi 2009
Reasons to migrate from Delphi 7 to Delphi 2009
 
Java Optimization For Faster Code & Better Results | J Optimizer
Java Optimization For Faster Code & Better Results | J OptimizerJava Optimization For Faster Code & Better Results | J Optimizer
Java Optimization For Faster Code & Better Results | J Optimizer
 
Top Ten Reasons to Upgrade from Delphi 7
Top Ten Reasons to Upgrade from Delphi 7Top Ten Reasons to Upgrade from Delphi 7
Top Ten Reasons to Upgrade from Delphi 7
 
Database Tools and Developer Software Licence Management
Database Tools and Developer Software Licence ManagementDatabase Tools and Developer Software Licence Management
Database Tools and Developer Software Licence Management
 
Database Design and Data Modeling | PowerDesigner to All Access
Database Design and Data Modeling | PowerDesigner to All AccessDatabase Design and Data Modeling | PowerDesigner to All Access
Database Design and Data Modeling | PowerDesigner to All Access
 
Preventing Database Perfomance Issues | DB Optimizer
Preventing Database Perfomance Issues | DB OptimizerPreventing Database Perfomance Issues | DB Optimizer
Preventing Database Perfomance Issues | DB Optimizer
 
Build Windows Applications Fast | Delphi Prism
Build Windows Applications Fast | Delphi PrismBuild Windows Applications Fast | Delphi Prism
Build Windows Applications Fast | Delphi Prism
 
Develop Enterprise Java Applications | JBuilder
Develop Enterprise Java Applications | JBuilderDevelop Enterprise Java Applications | JBuilder
Develop Enterprise Java Applications | JBuilder
 
Develop Ruby Applications Fast | TubroRuby
Develop Ruby Applications Fast | TubroRubyDevelop Ruby Applications Fast | TubroRuby
Develop Ruby Applications Fast | TubroRuby
 
Develop Ruby Applications Fast | TubroRuby
Develop Ruby Applications Fast | TubroRubyDevelop Ruby Applications Fast | TubroRuby
Develop Ruby Applications Fast | TubroRuby
 
Business Process Modeling | Embarcadero Technologies EA/Studio
Business Process Modeling | Embarcadero Technologies EA/StudioBusiness Process Modeling | Embarcadero Technologies EA/Studio
Business Process Modeling | Embarcadero Technologies EA/Studio
 
Secure Applications With 3rdRail and TurboRuby
Secure Applications With 3rdRail and TurboRubySecure Applications With 3rdRail and TurboRuby
Secure Applications With 3rdRail and TurboRuby
 
Optimizing Your Database Performance | Embarcadero Technologies
Optimizing Your Database Performance | Embarcadero TechnologiesOptimizing Your Database Performance | Embarcadero Technologies
Optimizing Your Database Performance | Embarcadero Technologies
 
PowerSQL Aids Application Developer Productivity
PowerSQL Aids Application Developer ProductivityPowerSQL Aids Application Developer Productivity
PowerSQL Aids Application Developer Productivity
 
Data Modeling Lineage | Embarcadero Technoloiges
Data Modeling Lineage | Embarcadero TechnoloigesData Modeling Lineage | Embarcadero Technoloiges
Data Modeling Lineage | Embarcadero Technoloiges
 
Harnessing Data Growth
Harnessing Data GrowthHarnessing Data Growth
Harnessing Data Growth
 
Ten Ways For DBA's To Save Time
Ten Ways For DBA's To Save TimeTen Ways For DBA's To Save Time
Ten Ways For DBA's To Save Time
 
Optimizer Para Py Mes Entrevista Sinergia Empresaria
Optimizer Para Py Mes Entrevista Sinergia EmpresariaOptimizer Para Py Mes Entrevista Sinergia Empresaria
Optimizer Para Py Mes Entrevista Sinergia Empresaria
 

Dernier

SALESFORCE EDUCATION CLOUD | FEXLE SERVICES
SALESFORCE EDUCATION CLOUD | FEXLE SERVICESSALESFORCE EDUCATION CLOUD | FEXLE SERVICES
SALESFORCE EDUCATION CLOUD | FEXLE SERVICESmohitsingh558521
 
DevEX - reference for building teams, processes, and platforms
DevEX - reference for building teams, processes, and platformsDevEX - reference for building teams, processes, and platforms
DevEX - reference for building teams, processes, and platformsSergiu Bodiu
 
New from BookNet Canada for 2024: Loan Stars - Tech Forum 2024
New from BookNet Canada for 2024: Loan Stars - Tech Forum 2024New from BookNet Canada for 2024: Loan Stars - Tech Forum 2024
New from BookNet Canada for 2024: Loan Stars - Tech Forum 2024BookNet Canada
 
DSPy a system for AI to Write Prompts and Do Fine Tuning
DSPy a system for AI to Write Prompts and Do Fine TuningDSPy a system for AI to Write Prompts and Do Fine Tuning
DSPy a system for AI to Write Prompts and Do Fine TuningLars Bell
 
A Deep Dive on Passkeys: FIDO Paris Seminar.pptx
A Deep Dive on Passkeys: FIDO Paris Seminar.pptxA Deep Dive on Passkeys: FIDO Paris Seminar.pptx
A Deep Dive on Passkeys: FIDO Paris Seminar.pptxLoriGlavin3
 
Sample pptx for embedding into website for demo
Sample pptx for embedding into website for demoSample pptx for embedding into website for demo
Sample pptx for embedding into website for demoHarshalMandlekar2
 
How to write a Business Continuity Plan
How to write a Business Continuity PlanHow to write a Business Continuity Plan
How to write a Business Continuity PlanDatabarracks
 
Rise of the Machines: Known As Drones...
Rise of the Machines: Known As Drones...Rise of the Machines: Known As Drones...
Rise of the Machines: Known As Drones...Rick Flair
 
SIP trunking in Janus @ Kamailio World 2024
SIP trunking in Janus @ Kamailio World 2024SIP trunking in Janus @ Kamailio World 2024
SIP trunking in Janus @ Kamailio World 2024Lorenzo Miniero
 
unit 4 immunoblotting technique complete.pptx
unit 4 immunoblotting technique complete.pptxunit 4 immunoblotting technique complete.pptx
unit 4 immunoblotting technique complete.pptxBkGupta21
 
Ensuring Technical Readiness For Copilot in Microsoft 365
Ensuring Technical Readiness For Copilot in Microsoft 365Ensuring Technical Readiness For Copilot in Microsoft 365
Ensuring Technical Readiness For Copilot in Microsoft 3652toLead Limited
 
Moving Beyond Passwords: FIDO Paris Seminar.pdf
Moving Beyond Passwords: FIDO Paris Seminar.pdfMoving Beyond Passwords: FIDO Paris Seminar.pdf
Moving Beyond Passwords: FIDO Paris Seminar.pdfLoriGlavin3
 
New from BookNet Canada for 2024: BNC CataList - Tech Forum 2024
New from BookNet Canada for 2024: BNC CataList - Tech Forum 2024New from BookNet Canada for 2024: BNC CataList - Tech Forum 2024
New from BookNet Canada for 2024: BNC CataList - Tech Forum 2024BookNet Canada
 
"Debugging python applications inside k8s environment", Andrii Soldatenko
"Debugging python applications inside k8s environment", Andrii Soldatenko"Debugging python applications inside k8s environment", Andrii Soldatenko
"Debugging python applications inside k8s environment", Andrii SoldatenkoFwdays
 
Tampa BSides - Chef's Tour of Microsoft Security Adoption Framework (SAF)
Tampa BSides - Chef's Tour of Microsoft Security Adoption Framework (SAF)Tampa BSides - Chef's Tour of Microsoft Security Adoption Framework (SAF)
Tampa BSides - Chef's Tour of Microsoft Security Adoption Framework (SAF)Mark Simos
 
Passkey Providers and Enabling Portability: FIDO Paris Seminar.pptx
Passkey Providers and Enabling Portability: FIDO Paris Seminar.pptxPasskey Providers and Enabling Portability: FIDO Paris Seminar.pptx
Passkey Providers and Enabling Portability: FIDO Paris Seminar.pptxLoriGlavin3
 
Training state-of-the-art general text embedding
Training state-of-the-art general text embeddingTraining state-of-the-art general text embedding
Training state-of-the-art general text embeddingZilliz
 
Time Series Foundation Models - current state and future directions
Time Series Foundation Models - current state and future directionsTime Series Foundation Models - current state and future directions
Time Series Foundation Models - current state and future directionsNathaniel Shimoni
 
Unraveling Multimodality with Large Language Models.pdf
Unraveling Multimodality with Large Language Models.pdfUnraveling Multimodality with Large Language Models.pdf
Unraveling Multimodality with Large Language Models.pdfAlex Barbosa Coqueiro
 
Nell’iperspazio con Rocket: il Framework Web di Rust!
Nell’iperspazio con Rocket: il Framework Web di Rust!Nell’iperspazio con Rocket: il Framework Web di Rust!
Nell’iperspazio con Rocket: il Framework Web di Rust!Commit University
 

Dernier (20)

SALESFORCE EDUCATION CLOUD | FEXLE SERVICES
SALESFORCE EDUCATION CLOUD | FEXLE SERVICESSALESFORCE EDUCATION CLOUD | FEXLE SERVICES
SALESFORCE EDUCATION CLOUD | FEXLE SERVICES
 
DevEX - reference for building teams, processes, and platforms
DevEX - reference for building teams, processes, and platformsDevEX - reference for building teams, processes, and platforms
DevEX - reference for building teams, processes, and platforms
 
New from BookNet Canada for 2024: Loan Stars - Tech Forum 2024
New from BookNet Canada for 2024: Loan Stars - Tech Forum 2024New from BookNet Canada for 2024: Loan Stars - Tech Forum 2024
New from BookNet Canada for 2024: Loan Stars - Tech Forum 2024
 
DSPy a system for AI to Write Prompts and Do Fine Tuning
DSPy a system for AI to Write Prompts and Do Fine TuningDSPy a system for AI to Write Prompts and Do Fine Tuning
DSPy a system for AI to Write Prompts and Do Fine Tuning
 
A Deep Dive on Passkeys: FIDO Paris Seminar.pptx
A Deep Dive on Passkeys: FIDO Paris Seminar.pptxA Deep Dive on Passkeys: FIDO Paris Seminar.pptx
A Deep Dive on Passkeys: FIDO Paris Seminar.pptx
 
Sample pptx for embedding into website for demo
Sample pptx for embedding into website for demoSample pptx for embedding into website for demo
Sample pptx for embedding into website for demo
 
How to write a Business Continuity Plan
How to write a Business Continuity PlanHow to write a Business Continuity Plan
How to write a Business Continuity Plan
 
Rise of the Machines: Known As Drones...
Rise of the Machines: Known As Drones...Rise of the Machines: Known As Drones...
Rise of the Machines: Known As Drones...
 
SIP trunking in Janus @ Kamailio World 2024
SIP trunking in Janus @ Kamailio World 2024SIP trunking in Janus @ Kamailio World 2024
SIP trunking in Janus @ Kamailio World 2024
 
unit 4 immunoblotting technique complete.pptx
unit 4 immunoblotting technique complete.pptxunit 4 immunoblotting technique complete.pptx
unit 4 immunoblotting technique complete.pptx
 
Ensuring Technical Readiness For Copilot in Microsoft 365
Ensuring Technical Readiness For Copilot in Microsoft 365Ensuring Technical Readiness For Copilot in Microsoft 365
Ensuring Technical Readiness For Copilot in Microsoft 365
 
Moving Beyond Passwords: FIDO Paris Seminar.pdf
Moving Beyond Passwords: FIDO Paris Seminar.pdfMoving Beyond Passwords: FIDO Paris Seminar.pdf
Moving Beyond Passwords: FIDO Paris Seminar.pdf
 
New from BookNet Canada for 2024: BNC CataList - Tech Forum 2024
New from BookNet Canada for 2024: BNC CataList - Tech Forum 2024New from BookNet Canada for 2024: BNC CataList - Tech Forum 2024
New from BookNet Canada for 2024: BNC CataList - Tech Forum 2024
 
"Debugging python applications inside k8s environment", Andrii Soldatenko
"Debugging python applications inside k8s environment", Andrii Soldatenko"Debugging python applications inside k8s environment", Andrii Soldatenko
"Debugging python applications inside k8s environment", Andrii Soldatenko
 
Tampa BSides - Chef's Tour of Microsoft Security Adoption Framework (SAF)
Tampa BSides - Chef's Tour of Microsoft Security Adoption Framework (SAF)Tampa BSides - Chef's Tour of Microsoft Security Adoption Framework (SAF)
Tampa BSides - Chef's Tour of Microsoft Security Adoption Framework (SAF)
 
Passkey Providers and Enabling Portability: FIDO Paris Seminar.pptx
Passkey Providers and Enabling Portability: FIDO Paris Seminar.pptxPasskey Providers and Enabling Portability: FIDO Paris Seminar.pptx
Passkey Providers and Enabling Portability: FIDO Paris Seminar.pptx
 
Training state-of-the-art general text embedding
Training state-of-the-art general text embeddingTraining state-of-the-art general text embedding
Training state-of-the-art general text embedding
 
Time Series Foundation Models - current state and future directions
Time Series Foundation Models - current state and future directionsTime Series Foundation Models - current state and future directions
Time Series Foundation Models - current state and future directions
 
Unraveling Multimodality with Large Language Models.pdf
Unraveling Multimodality with Large Language Models.pdfUnraveling Multimodality with Large Language Models.pdf
Unraveling Multimodality with Large Language Models.pdf
 
Nell’iperspazio con Rocket: il Framework Web di Rust!
Nell’iperspazio con Rocket: il Framework Web di Rust!Nell’iperspazio con Rocket: il Framework Web di Rust!
Nell’iperspazio con Rocket: il Framework Web di Rust!
 

Java Optimization For Better Results & Lower Costs | J Optimizer

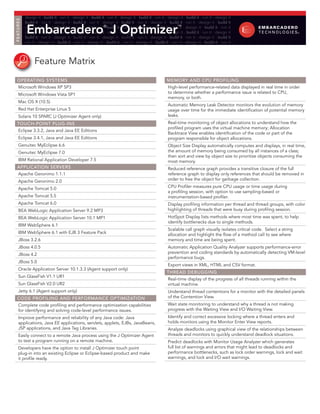
  • 1. F E AT U R E S design it ∙ build it ∙ run it ∙ design it ∙ build it ∙ run it ∙ design it ∙ build it ∙ run it ∙ design it ∙ build it ∙ run it ∙ design it build it ∙ run it ∙ design it ∙ build it ∙ run it ∙ design it ∙ build it ∙ run it ∙ design it ∙ build it ∙ run it ∙ design it ∙ build it Embarcadero J Optimizer run it ∙ design it ∙ build it ∙ run it ∙ design it ® build it ∙ run it ∙ design it ∙ build it ∙ run™ ∙ design it ∙ build it ∙ run it ∙ it design it ∙ build it ∙ run it ∙ design it ∙ build it ∙ run it ∙ design it ∙ build it ∙ run it ∙ design it ∙ build it ∙ run it ∙ design it build it ∙ run it ∙ design it ∙ build it ∙ run it ∙ design it ∙ build it ∙ run it ∙ design it ∙ build it ∙ run it ∙ design it ∙ build it run it ∙ design it ∙ build it ∙ run it ∙ design it ∙ build it ∙ run it ∙ design it ∙ build it ∙ run it ∙ design it ∙ build it ∙ run it Feature Matrix OPERATING SYSTEMS MEMORY ANd CPU PROfILING Microsoft Windows XP SP3 High-level performance-related data displayed in real time in order Microsoft Windows Vista SP1 to determine whether a performance issue is related to CPU, memory, or both. Mac OS X (10.5) Automatic Memory Leak Detector monitors the evolution of memory Red Hat Enterprise Linux 5 usage over time for the immediate identification of potential memory Solaris 10 SPARC (J Optimizer Agent only) leaks. TOUCH-POINT PLUG-INS Real-time monitoring of object allocations to understand how the profiled program uses the virtual machine memory; Allocation Eclipse 3.3.2, Java and Java EE Editions Backtrace View enables identification of the code or part of the Eclipse 3.4.1, Java and Java EE Editions program responsible for object allocations. Genuitec MyEclipse 6.6 Object Size Display automatically computes and displays, in real time, Genuitec MyEclipse 7.0 the amount of memory being consumed by all instances of a class; then sort and view by object size to prioritize objects consuming the IBM Rational Application Developer 7.5 most memory. APPLICATION SERVERS Reduced reference graph provides a transitive closure of the full Apache Geronimo 1.1.1 reference graph to display only references that should be removed in Apache Geronimo 2.0 order to free the object for garbage collection. Apache Tomcat 5.0 CPU Profiler measures pure CPU usage or time usage during a profiling session, with option to use sampling-based or Apache Tomcat 5.5 instrumentation-based profiler. Apache Tomcat 6.0 Display profiling information per thread and thread groups, with color BEA WebLogic Application Server 9.2 MP3 highlighting of threads that were busy during profiling session. BEA WebLogic Application Server 10.1 MP1 HotSpot Display lists methods where most time was spent, to help identify bottlenecks due to single methods. IBM WebSphere 6.1 Scalable call graph visually isolates critical code. Select a string IBM WebSphere 6.1 with EJB 3 Feature Pack allocation and highlight the flow of a method call to see where JBoss 3.2.6 memory and time are being spent. JBoss 4.0.5 Automatic Application Quality Analyzer supports performance-error JBoss 4.2 prevention and coding standards by automatically detecting VM-level performance bugs. JBoss 5.0 Export views in XML, HTML and CSV format. Oracle Application Server 10.1.3.3 (Agent support only) THREAd dEBUGGING Sun GlassFish V1.1 UR1 Real-time display of the progress of all threads running within the Sun GlassFish V2.0 UR2 virtual machine. Jetty 6.1 (Agent support only) Understand thread contentions for a monitor with the detailed panels COdE PROfILING ANd PERfORMANCE OPTIMIzATION of the Contention View. Complete code profiling and performance optimization capabilities Wait state monitoring to understand why a thread is not making for identifying and solving code-level performance issues. progress with the Waiting View and I/O Waiting View. Improve performance and reliability of any Java code: Java Identify and correct excessive locking where a thread enters and applications, Java EE applications, servlets, applets, EJBs, JavaBeans, holds monitors using the Monitor Enter View reports. JSP applications, and Java Tag Libraries. Analyze deadlocks using graphical view of the relationships between Easily connect to a remote Java process using the J Optimizer Agent threads and monitors to quickly understand deadlock situations. to test a program running on a remote machine. Predict deadlocks with Monitor Usage Analyzer which generates Developers have the option to install J Optimizer touch point full list of warnings and errors that might lead to deadlocks and plug-in into an existing Eclipse or Eclipse-based product and make performance bottlenecks, such as lock order warnings, lock and wait it profile ready. warnings, and lock and I/O wait warnings.
  • 2. COdE COVERAGE REQUEST ANALYzER Code Coverage helps identify dead code, frequently used code, and Profile the performance behavior of your Java EE application unloaded classes in your Java applications. code across the following Java EE components: JDBC, JSP, JNDI, Class Coverage View lists all classes and the real-time test results for Enterprise JavaBeans, and JMS containers. each class. You can see how many lines of code have executed, and Improve performance and reliability of Java EE-related application you can apply filters to test only certain classes. code earlier in development with drill-down performance Real-time display of all classes and interfaces used by the tested information for Java EE components. program and real-time percentage of lines covered per class. Visual interface simplifies the complexity of Java EE application Method Coverage View displays the source code for methods in a interactions using graphical representation. selected class, as well as statistical information about the number of System Dashboard view provides a graphical display of the times your method was called while your test application was running. application time spent in Java EE components and total number Source Code Viewer shows lines of code that have never been of requests. Shows the percentage of use for each server module executed, making it easier to spot dead code. to quickly detect any major component-level performance issues. Option to display the interfaces that have been loaded by the virtual System Composite view displays all of the Java EE events that machine and those that have not been loaded. have occurred in an application, in real time, in their proper hierarchy. Hierarchy shows the relationship of events in terms of Batch-mode support to easily include code coverage in any batch- which events spawn others. mode testing process. SNAPSHOTS ANd PROGRESS TRACKER AUdITS ANd METRICS Snapshots capture all the data from a particular test run, which Metrics evaluate object model complexity and quantify your code. can then be opened for analysis in the product that generated it, Metrics results can be viewed graphically in either bar charts or Kiviat such as Profiler, Code Coverage, or Request Analyzer. charts format. Continuously monitor and measure the impact of performance Metrics can be used to create reports and compare the overall impact changes by comparing visual snapshots. of changes in a project. Progress Tracker enables you to visually compare, monitor, and Audits provide information on design issues, naming conventions, measure the impact of performance changes by comparing visual and other items which can impact code quality. snapshots from Profiler, Code Coverage, and Request Analyzer snapshots. Audit results can be displayed with descriptions of what each audit looks for and how to fix violations. Generate reports that can be exported in PDF and HTML format. Includes a group of audits known as “Bad Smell Audits” that detect some issues or convention violations in source code (misplaced classes, attributes and methods, wrong inheritance usage), which require some code refactoring. Create specific QA Sets for source code audits and metrics, and save them to a local file system, or as part of a project which can then be shared with the team. Download a Free Trial at www.embarcadero.com Corporate Headquarters | Embarcadero Technologies | 100 California Street, 12th Floor | San Francisco, CA 94111 | www.embarcadero.com | sales@embarcadero.com © 2009 Embarcadero Technologies, Inc. Embarcadero, the Embarcadero Technologies logos, and all other Embarcadero Technologies product or service names are trademarks or registered trademarks of Embarcadero Technologies, Inc. All other trademarks are property of their respective owners. JO/FM/2009/03/19