SlideShare a Scribd company logo
1 of 11
Download to read offline
Online Presence Continues to Grow and Persons 55+ Grew the Most
                    in Q4 2010

                                                        Total Internet
                 25,100                                                                                   24,989
                 25,000
Total UV (000)


                                                               +2%
                 24,900
                 24,800
                 24,700   24,602
                 24,600
                 24,500
                 24,400


                                              Growth of Online Users by Age
                                                  Q4 2009 vs. Q4 2010
                 10,000                                                      +1%
                  9,000
        Total UV (000)


                  8,000                            0%
                  7,000
                  6,000            -4%                                                      +12%
                  5,000
                  4,000                                                  8,708   8,767
                  3,000                       6,750   6,760
                  2,000       4,895   4,690                                               4,225   4,747
                  1,000
                      0
                              Persons: 2-17   Persons: 18-34             Persons: 35-54   Persons: 55+
% Composition Unique Visitors                                                                            % Composition UV
              by Age Segments                                                                                     Regional Breakout

                       Males     Females                                                                             Atlantic
                                                                                                                       7%
                                                                                                               British
 2-17             9%                  10%                                                                     Columbia
                                                                                                                                          Ontario
                                                                                                                13%
                                                                                                                                           38%
                                                                                                              Praries
18-24        5%         5%                                                                                     18%


                                                                                                                             Quebec
25-34             9%                  9%                                                                                      24%

                                                                                                              % Composition
35-44             9%                  9%                                                                 Household Income Breakout

                                                                                    35%
                                                                                    30%
45-54             9%                 8%                                                                               31%
                                                                                    25%
                                                                                    20%          24%                                                             26%
                                                                                    15%                                                    20%
 55+              9%                  10%                                           10%
                                                                                     5%
                                                                                     0%
        0%        5%           10%         15%                  20%                            Less than           $40,000 -            $75,000 -          $100,000 or
                                                                                                $40,000             $74,999              $99,999              more
                                          © comScore, Inc. Proprietary and Confidential.   9
                                                                                                Source: comScore Inc., Media Metrix, CA, All Locations, Persons: 2+, 3 MO. AVG Q4 2010
Online Landscape Worldwide in 2010
Canada maintained its position as the most engaged online audience, ranking highest among the top markets in
average hours and visits per visitor in Q4 2010.

                                          #1                     #2                     #1

               Total Unique Visitors
                                       Average Hours/Visitor   Average Pages/Visitor   Average Visits/Visitor
                       (000)
Location       Q4 2010     Q4 2009     Q4 2010     Q4 2009     Q4 2010      Q4 2009    Q4 2010      Q4 2009
Worldwide      1,314,031   1,206,146     23.1        23.7       2,133        2,252      53.0          54.6
China          287,451      232,037      13.5        15.6       1,238        1,599      38.6          57.7
U.S.           181,239      172,194      35.3        33.3       2,953        2,822      80.9          70.8
Japan           72,913      69,826       18.4        20.0       1,928        2,108      43.8          47.3
Germany         49,257      45,216       24.1        22.0       2,858        2,654      60.0          58.7
Russia          45,692      36,589       21.8        16.5       2,704        2,399      52.9          44.5
France          41,827      39,137       26.6        28.1       2,752        2,934      68.7          70.3
India           41,170      36,535       11.9        12.1       1,089        1,183      30.6          27.1
Brazil          39,335      32,849       25.8        27.0       2,089        2,672      56.5          58.8
UK              38,581      37,674       32.3        31.3       2,883        2,735      69.4          60.3
South Korea     30,155      29,424       27.7        35.6       4,093        4,986      50.1          72.5
Canada          22,945      23,138       43.5        42.2       3,349        3,793      95.2          88.8
Top Gaining Site Categories by Total Unique Visitors

More Canadians were accessing Community and Entertainment sites in Q4 2010. Political News sites saw the
strongest growth, up 47 percent versus year ago.


                                                                  Top Gaining Site Categories
                               25,000 +18%   +25%
                                                                          Q4 2009   Q4 2010
 Total Unique Visitors (000)


                               20,000
                                                    +16%
                                                           +23%
                                                                   +20%   +26%
                               15,000
                                                                                 +29%
                                                                                        +29%
                               10,000                                                          +25%
                                                                                                      +27%
                                                                                                             +23%   +29% +30%

                                5,000                                                                                           +37%
                                                                                                                                       +47%

                                   0
Conversational Media Continues its Climb
      Even though Social Networking had a strong reach in 2009, we continued to see growth in unique visitors in
      2010. Likewise, UV growth was also seen on Blog sites as Canadians spent 58% more time and consumed 36%
      more pages in Q4 2010 compared to that of Q4 2009.

                                                         Social Networking   Blogs
                                                  +13%   YoY                 +9%

                               25,000
Total Unique Visitors (000)


                               24,000
                               23,000
                               22,000
                               21,000
                               20,000
                               19,000
                               18,000
                               17,000
                               16,000
                               15,000
Top Conversational Media Sites
                                                Total Unique Visitors (000):   % Change    % Change
        Most                                      Q4 2010   Q4 2009             Unique       Total
  Conversational                                                                Visitors    Minutes
Media sites saw an                                                               +7%         -4%
                              Facebook.com
increase in unique
 visitors and time                   Blogger                                     -3%         +11
 spent in Q4 2010        Windows Live Profile                                    -25%        -34%
 compared to last
                            Technorati Media                                     +40%       +161%
        year.
                                  WordPress                                      -16%        -1%

                            Federated Media                                      +31%       +138%

                                  Twitter.com                                    +11%       +26%

                                LinkedIn.com                                     +35%       +79%
Top gainers included:                                                            N/A         N/A
                               Gawker Media
Technorati Media (40%)
Federated Media (31%)         HubPages.com                                       +63%       +107%
Twitter.com (11%)
                                    Myspace                                      -42%        -76%
LinkedIn.com (35%)
                                Squidoo.com                                      +19%       +26%

                                     BlogHer                                     +1%        +34%

                              DeviantArt.com                                     -24%        +8%

                                    Typepad                                      -25%        -2%
Persons 55+ were the Strongest Drivers of Social Networking Growth

Social Networking continues to be consumed by many different demographics of the Canadian population. As
this category continues to grow, older age segments are increasingly more engaged in this content.

                   Persons Age: Q4 2010                       Social Media Growth Q4 2009 vs. Q4 2010


                                                                              % Change
                                                                                              % Change
                                                            Persons - Age      Unique
                                                                                              Total Visits
                           6%                                                  Visitors
                                      17%
    2-17          12%                                             2-17            -9%            -18%
   18-24
                                                                 18-24            -1%                -7%
   25-34
   35-44                                      10%
                                                                 25-34           14%                 15%
   45-54
            17%
   55-64                                                         35-44           12%                 15%
   65+
                                                                 45-54           15%                 15%
                                            19%
                                                                 55-64           36%                 48%
                        19%
                                                                  65+            34%                 45%
Ad Dollars Continue to Flow Online in 2010
      Total Display Ad                      Percentage of 2010 Total Display Ad Impressions
     Impressions (MM)
182,500

                         180,927                        Q4 2010           Q1 2010
                                                         27%               24%
180,000

                                                                          Q2 2010
                                                          Q3 2010          24%
177,500                                                    25%

          175,970

175,000
                                   The number of total display ad impressions has grown 3% in 2010, with
                                   the majority of the ad impressions delivered in the final quarter of the
172,500                            year. In 2010, the top two advertisers online were Procter & Gamble,
                                   followed by GMAC/Ally. Together they accounted for nearly 17 billion
                                   display ad impressions throughout the year.
170,000
          Q4 2009        Q4 2010
A Shift: Where Advertising is Displayed Online
                              Total Display Ad Impressions (000) by Category                          +15.6
                                                Q4 2009       Q4 2010                                 billion
60,000,000

50,000,000

40,000,000

30,000,000
                   -5.1                                     +11.1
                  billion                                   billion
20,000,000                                                                         +2.2
                                       -1.0
                                                                                  billion
                                      billion
10,000,000

        0
                   E-mail         Business/Finance          Photos                Sports        Social Networking

While the number of total display ad impressions grew 3% in 2010, the Social Networking category has shown
the largest increase in ad impressions delivered, accounting for more than 58 billion impressions in Q4 2010.
This is the result of increased social media sites that have the ability to deliver ad impressions and shifting ad
impressions delivered on categories like: E-mail (-34%) and Business/Finance (-28%).
Smartphone Penetration by Market

                                   % Change Mobile Platforms for Reportable Countries
                                                 Q4 2009 vs. Q4 2010


 Smartphone:                    Smartphone:         Smartphone:      Smartphone:          Smartphone:         Smartphone:
     +60%                           +63%                +38%             +12%                 +59%                +81%
Feature Phone:                 Feature Phone:      Feature Phone:   Feature Phone:       Feature Phone:      Feature Phone:
     -12%                           -17%                -14%              -6%                 -11%                -14%

                                          Mobile Platforms for Reportable Countries
                                                          Q4 2010
                100%

                80%      Smartphone                 Feature Phone
% Composition


                           Leader                      Leader
                60%

                40%

                20%

                 0%
                                           Smartphone                                        Feature Phone
                 Japan         United States      United Kingdom      Spain          Italy        Germany         France
Platform Share of Smartphone Subscribers

                                             RIM       Google          Apple         Microsoft         Palm          Symbian


                             US                32%                             29%                            25%              8%    4% 3%


                                  0%    10%          20%         30%    40%          50%     60%         70%         80%       90%         100%

                                                                        Total Subscribers (000s)
                           100%                                                                   4%
                                                                           7%                                       12%
                            90%                            19%             10%                   13%                                 20%
                                       32%
Total Subscribers (000s)


                            80%                                            7%                     5%                21%
                            70%
                                                           28%                                                      5%               31%
                            60%
                            50%
                                                           17%             66%                   68%                                 8%
                            40%        55%
                                                                                                                    48%
                            30%
                                                                                                                                     31%
                            20%                            30%
                            10%
                                       12%                                 9%                    10%                13%              10%
                            0%                             5%
                                       JA                  UK              SP                    IT                 GE               FR

More Related Content

What's hot

Edelman Social Entertainment - Slide Deck
Edelman Social Entertainment - Slide DeckEdelman Social Entertainment - Slide Deck
Edelman Social Entertainment - Slide DeckEdelman_UK
 
2011 Edelman Trust Barometer: Global & Country Insights
2011 Edelman Trust Barometer: Global & Country Insights2011 Edelman Trust Barometer: Global & Country Insights
2011 Edelman Trust Barometer: Global & Country InsightsEdelman Digital
 
2010 SMB Information Protection Survey
2010 SMB Information Protection Survey2010 SMB Information Protection Survey
2010 SMB Information Protection SurveySymantec
 
Tele2 Third quarter 2012
Tele2 Third quarter 2012Tele2 Third quarter 2012
Tele2 Third quarter 2012Tele2
 
Making the Long Tail Wag
Making the Long Tail WagMaking the Long Tail Wag
Making the Long Tail Wagowenhewitson
 
Wisdom of crowds business intelligence market study findings overview
Wisdom of crowds business intelligence market study findings overviewWisdom of crowds business intelligence market study findings overview
Wisdom of crowds business intelligence market study findings overviewYellowfin
 
Edatasource - Sponsor Breakfast Presentation
Edatasource - Sponsor Breakfast PresentationEdatasource - Sponsor Breakfast Presentation
Edatasource - Sponsor Breakfast PresentationMediaPost
 
10 Keys for Destination Management and Marketing - Part 1
10 Keys for Destination Management and Marketing - Part 110 Keys for Destination Management and Marketing - Part 1
10 Keys for Destination Management and Marketing - Part 1South African Tourism
 
CMC Analystsmeet 20/2004 Q4
CMC Analystsmeet 20/2004 Q4CMC Analystsmeet 20/2004 Q4
CMC Analystsmeet 20/2004 Q4finance21
 
Social Media & Mapping Industry
Social Media & Mapping IndustrySocial Media & Mapping Industry
Social Media & Mapping IndustryMani Singh
 
City of Austin - Volunteerism Benchmarking Study
City of Austin -  Volunteerism Benchmarking StudyCity of Austin -  Volunteerism Benchmarking Study
City of Austin - Volunteerism Benchmarking StudyDavid J. Neff
 
Russian and Ukrainian internet market: major verticals
Russian and Ukrainian internet market: major verticalsRussian and Ukrainian internet market: major verticals
Russian and Ukrainian internet market: major verticalsInna Ponomarenko
 
Managed mobility - SSDesign
Managed mobility  - SSDesignManaged mobility  - SSDesign
Managed mobility - SSDesignSS Design
 
The Australian Internet and tech report
The Australian Internet and tech reportThe Australian Internet and tech report
The Australian Internet and tech reportadtech
 
Integrated Marketing - Overman
Integrated Marketing - OvermanIntegrated Marketing - Overman
Integrated Marketing - OvermanEric Overman
 
Wateen Wimax Marketing Research
Wateen Wimax  Marketing ResearchWateen Wimax  Marketing Research
Wateen Wimax Marketing ResearchM. Aaqib Vatao
 
Kaderledenstudie 2012 HUMO
Kaderledenstudie 2012 HUMOKaderledenstudie 2012 HUMO
Kaderledenstudie 2012 HUMOHumoMedia
 

What's hot (20)

Edelman Social Entertainment - Slide Deck
Edelman Social Entertainment - Slide DeckEdelman Social Entertainment - Slide Deck
Edelman Social Entertainment - Slide Deck
 
2011 Edelman Trust Barometer: Global & Country Insights
2011 Edelman Trust Barometer: Global & Country Insights2011 Edelman Trust Barometer: Global & Country Insights
2011 Edelman Trust Barometer: Global & Country Insights
 
2010 SMB Information Protection Survey
2010 SMB Information Protection Survey2010 SMB Information Protection Survey
2010 SMB Information Protection Survey
 
Tele2 Third quarter 2012
Tele2 Third quarter 2012Tele2 Third quarter 2012
Tele2 Third quarter 2012
 
Making the Long Tail Wag
Making the Long Tail WagMaking the Long Tail Wag
Making the Long Tail Wag
 
BIMA Presentation
BIMA PresentationBIMA Presentation
BIMA Presentation
 
Power Communications - Digital
Power Communications - DigitalPower Communications - Digital
Power Communications - Digital
 
Wisdom of crowds business intelligence market study findings overview
Wisdom of crowds business intelligence market study findings overviewWisdom of crowds business intelligence market study findings overview
Wisdom of crowds business intelligence market study findings overview
 
Edatasource - Sponsor Breakfast Presentation
Edatasource - Sponsor Breakfast PresentationEdatasource - Sponsor Breakfast Presentation
Edatasource - Sponsor Breakfast Presentation
 
10 Keys for Destination Management and Marketing - Part 1
10 Keys for Destination Management and Marketing - Part 110 Keys for Destination Management and Marketing - Part 1
10 Keys for Destination Management and Marketing - Part 1
 
CMC Analystsmeet 20/2004 Q4
CMC Analystsmeet 20/2004 Q4CMC Analystsmeet 20/2004 Q4
CMC Analystsmeet 20/2004 Q4
 
Social Media & Mapping Industry
Social Media & Mapping IndustrySocial Media & Mapping Industry
Social Media & Mapping Industry
 
City of Austin - Volunteerism Benchmarking Study
City of Austin -  Volunteerism Benchmarking StudyCity of Austin -  Volunteerism Benchmarking Study
City of Austin - Volunteerism Benchmarking Study
 
Russian and Ukrainian internet market: major verticals
Russian and Ukrainian internet market: major verticalsRussian and Ukrainian internet market: major verticals
Russian and Ukrainian internet market: major verticals
 
Managed mobility - SSDesign
Managed mobility  - SSDesignManaged mobility  - SSDesign
Managed mobility - SSDesign
 
Prezentace Mobilnidata Final Sbornik
Prezentace Mobilnidata Final SbornikPrezentace Mobilnidata Final Sbornik
Prezentace Mobilnidata Final Sbornik
 
The Australian Internet and tech report
The Australian Internet and tech reportThe Australian Internet and tech report
The Australian Internet and tech report
 
Integrated Marketing - Overman
Integrated Marketing - OvermanIntegrated Marketing - Overman
Integrated Marketing - Overman
 
Wateen Wimax Marketing Research
Wateen Wimax  Marketing ResearchWateen Wimax  Marketing Research
Wateen Wimax Marketing Research
 
Kaderledenstudie 2012 HUMO
Kaderledenstudie 2012 HUMOKaderledenstudie 2012 HUMO
Kaderledenstudie 2012 HUMO
 

Viewers also liked

Рейтинг управляющих компаний за 2 квартал 2013 г.
Рейтинг управляющих компаний за 2 квартал 2013 г.Рейтинг управляющих компаний за 2 квартал 2013 г.
Рейтинг управляющих компаний за 2 квартал 2013 г.Alexander Bayzarov
 
Роль ментора в стартапе
Роль ментора в стартапеРоль ментора в стартапе
Роль ментора в стартапеNatalia Sakhnova
 
менторство школа концепция
менторство школа концепцияменторство школа концепция
менторство школа концепцияAlexander Bayzarov
 
Как работать с ментором?
Как работать с ментором?Как работать с ментором?
Как работать с ментором?Veronika Orlovskaya
 
Как развивать перспективных сотрудников, как управлять талантами, что такое t...
Как развивать перспективных сотрудников, как управлять талантами, что такое t...Как развивать перспективных сотрудников, как управлять талантами, что такое t...
Как развивать перспективных сотрудников, как управлять талантами, что такое t...Директор по персоналу & Кадровое Дело
 
About mentoring for my CDRF Global Group
About mentoring for my CDRF Global GroupAbout mentoring for my CDRF Global Group
About mentoring for my CDRF Global GroupSergey Dovgopolyy
 

Viewers also liked (7)

Рейтинг управляющих компаний за 2 квартал 2013 г.
Рейтинг управляющих компаний за 2 квартал 2013 г.Рейтинг управляющих компаний за 2 квартал 2013 г.
Рейтинг управляющих компаний за 2 квартал 2013 г.
 
Роль ментора в стартапе
Роль ментора в стартапеРоль ментора в стартапе
Роль ментора в стартапе
 
менторство школа концепция
менторство школа концепцияменторство школа концепция
менторство школа концепция
 
Как работать с ментором?
Как работать с ментором?Как работать с ментором?
Как работать с ментором?
 
Как развивать перспективных сотрудников, как управлять талантами, что такое t...
Как развивать перспективных сотрудников, как управлять талантами, что такое t...Как развивать перспективных сотрудников, как управлять талантами, что такое t...
Как развивать перспективных сотрудников, как управлять талантами, что такое t...
 
About mentoring for my CDRF Global Group
About mentoring for my CDRF Global GroupAbout mentoring for my CDRF Global Group
About mentoring for my CDRF Global Group
 
Mentoring ppt
Mentoring pptMentoring ppt
Mentoring ppt
 

Similar to Canada digital review

Genome Olympics viewing habits
Genome Olympics viewing habitsGenome Olympics viewing habits
Genome Olympics viewing habitsMaria Pousa
 
IMCA 2009 Practice Management Survey Results
IMCA 2009 Practice Management Survey ResultsIMCA 2009 Practice Management Survey Results
IMCA 2009 Practice Management Survey ResultsExplore Atlanta
 
Egyptian elections presidential debate may 2012
Egyptian elections presidential debate may 2012Egyptian elections presidential debate may 2012
Egyptian elections presidential debate may 2012SocialEyez
 
Small Business Pulse Report
Small Business Pulse Report Small Business Pulse Report
Small Business Pulse Report Constant Contact
 
Microsoft Cloud Computing Research April 2012
Microsoft Cloud Computing Research April 2012Microsoft Cloud Computing Research April 2012
Microsoft Cloud Computing Research April 2012Amarach Research
 
Cisco Candidate Survey Report Winter 2012
Cisco Candidate Survey Report Winter 2012Cisco Candidate Survey Report Winter 2012
Cisco Candidate Survey Report Winter 2012georgeleobarnes
 
Gridley’s mobile-ny-industy-roadmap-tips-for-successful-fundraise
Gridley’s mobile-ny-industy-roadmap-tips-for-successful-fundraiseGridley’s mobile-ny-industy-roadmap-tips-for-successful-fundraise
Gridley’s mobile-ny-industy-roadmap-tips-for-successful-fundraiseLinda Gridley
 
Caucasus ict trends
Caucasus ict trendsCaucasus ict trends
Caucasus ict trendsKaty Pearce
 
Making the longtail wag - Owen Hewitson
Making the longtail wag - Owen HewitsonMaking the longtail wag - Owen Hewitson
Making the longtail wag - Owen Hewitsonauexpo Conference
 
U ti investorday2011-freightforwarding
U ti investorday2011-freightforwardingU ti investorday2011-freightforwarding
U ti investorday2011-freightforwardingFrankie Coki
 
Wickes summary
Wickes summaryWickes summary
Wickes summaryJCDecauxUK
 
China Online Retail Market - iResearch - Will Tao
China Online Retail Market -  iResearch - Will TaoChina Online Retail Market -  iResearch - Will Tao
China Online Retail Market - iResearch - Will TaoiResearch
 
Strix Applications Case Studies
Strix  Applications  Case StudiesStrix  Applications  Case Studies
Strix Applications Case Studiestritv
 
Igtm pre event golf survey by sports marketing survey - part I
Igtm pre event golf survey by sports marketing survey - part IIgtm pre event golf survey by sports marketing survey - part I
Igtm pre event golf survey by sports marketing survey - part IMS-Co
 
2005 - 5th Us Analyst Investors Meeting Commercial Airline Market
2005 - 5th Us Analyst Investors Meeting   Commercial Airline Market2005 - 5th Us Analyst Investors Meeting   Commercial Airline Market
2005 - 5th Us Analyst Investors Meeting Commercial Airline MarketEmbraer RI
 
Telecom versus Online - Worlds in collision
Telecom versus Online - Worlds in collisionTelecom versus Online - Worlds in collision
Telecom versus Online - Worlds in collisionireijjhhjhut
 

Similar to Canada digital review (20)

Genome Olympics viewing habits
Genome Olympics viewing habitsGenome Olympics viewing habits
Genome Olympics viewing habits
 
IMCA 2009 Practice Management Survey Results
IMCA 2009 Practice Management Survey ResultsIMCA 2009 Practice Management Survey Results
IMCA 2009 Practice Management Survey Results
 
Egyptian elections presidential debate may 2012
Egyptian elections presidential debate may 2012Egyptian elections presidential debate may 2012
Egyptian elections presidential debate may 2012
 
Small Business Pulse Report
Small Business Pulse Report Small Business Pulse Report
Small Business Pulse Report
 
Microsoft Cloud Computing Research April 2012
Microsoft Cloud Computing Research April 2012Microsoft Cloud Computing Research April 2012
Microsoft Cloud Computing Research April 2012
 
Cisco Candidate Survey Report Winter 2012
Cisco Candidate Survey Report Winter 2012Cisco Candidate Survey Report Winter 2012
Cisco Candidate Survey Report Winter 2012
 
Axp 2011 csbar_market
Axp 2011 csbar_marketAxp 2011 csbar_market
Axp 2011 csbar_market
 
Gridley’s mobile-ny-industy-roadmap-tips-for-successful-fundraise
Gridley’s mobile-ny-industy-roadmap-tips-for-successful-fundraiseGridley’s mobile-ny-industy-roadmap-tips-for-successful-fundraise
Gridley’s mobile-ny-industy-roadmap-tips-for-successful-fundraise
 
Caucasus ict trends
Caucasus ict trendsCaucasus ict trends
Caucasus ict trends
 
Making the longtail wag - Owen Hewitson
Making the longtail wag - Owen HewitsonMaking the longtail wag - Owen Hewitson
Making the longtail wag - Owen Hewitson
 
Azerbaijanicts
AzerbaijanictsAzerbaijanicts
Azerbaijanicts
 
U ti investorday2011-freightforwarding
U ti investorday2011-freightforwardingU ti investorday2011-freightforwarding
U ti investorday2011-freightforwarding
 
Wickes summary
Wickes summaryWickes summary
Wickes summary
 
China Online Retail Market - iResearch - Will Tao
China Online Retail Market -  iResearch - Will TaoChina Online Retail Market -  iResearch - Will Tao
China Online Retail Market - iResearch - Will Tao
 
Strix Applications Case Studies
Strix  Applications  Case StudiesStrix  Applications  Case Studies
Strix Applications Case Studies
 
Igtm pre event golf survey by sports marketing survey - part I
Igtm pre event golf survey by sports marketing survey - part IIgtm pre event golf survey by sports marketing survey - part I
Igtm pre event golf survey by sports marketing survey - part I
 
2005 - 5th Us Analyst Investors Meeting Commercial Airline Market
2005 - 5th Us Analyst Investors Meeting   Commercial Airline Market2005 - 5th Us Analyst Investors Meeting   Commercial Airline Market
2005 - 5th Us Analyst Investors Meeting Commercial Airline Market
 
Telecom versus Online - Worlds in collision
Telecom versus Online - Worlds in collisionTelecom versus Online - Worlds in collision
Telecom versus Online - Worlds in collision
 
Eduventures
EduventuresEduventures
Eduventures
 
Moral Panics over the Internet
Moral Panics over the InternetMoral Panics over the Internet
Moral Panics over the Internet
 

Canada digital review

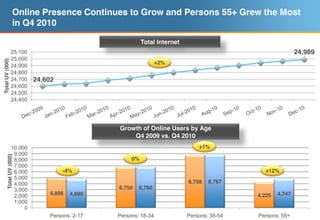
  • 1. Online Presence Continues to Grow and Persons 55+ Grew the Most in Q4 2010 Total Internet 25,100 24,989 25,000 Total UV (000) +2% 24,900 24,800 24,700 24,602 24,600 24,500 24,400 Growth of Online Users by Age Q4 2009 vs. Q4 2010 10,000 +1% 9,000 Total UV (000) 8,000 0% 7,000 6,000 -4% +12% 5,000 4,000 8,708 8,767 3,000 6,750 6,760 2,000 4,895 4,690 4,225 4,747 1,000 0 Persons: 2-17 Persons: 18-34 Persons: 35-54 Persons: 55+
  • 2. % Composition Unique Visitors % Composition UV by Age Segments Regional Breakout Males Females Atlantic 7% British 2-17 9% 10% Columbia Ontario 13% 38% Praries 18-24 5% 5% 18% Quebec 25-34 9% 9% 24% % Composition 35-44 9% 9% Household Income Breakout 35% 30% 45-54 9% 8% 31% 25% 20% 24% 26% 15% 20% 55+ 9% 10% 10% 5% 0% 0% 5% 10% 15% 20% Less than $40,000 - $75,000 - $100,000 or $40,000 $74,999 $99,999 more © comScore, Inc. Proprietary and Confidential. 9 Source: comScore Inc., Media Metrix, CA, All Locations, Persons: 2+, 3 MO. AVG Q4 2010
  • 3. Online Landscape Worldwide in 2010 Canada maintained its position as the most engaged online audience, ranking highest among the top markets in average hours and visits per visitor in Q4 2010. #1 #2 #1 Total Unique Visitors Average Hours/Visitor Average Pages/Visitor Average Visits/Visitor (000) Location Q4 2010 Q4 2009 Q4 2010 Q4 2009 Q4 2010 Q4 2009 Q4 2010 Q4 2009 Worldwide 1,314,031 1,206,146 23.1 23.7 2,133 2,252 53.0 54.6 China 287,451 232,037 13.5 15.6 1,238 1,599 38.6 57.7 U.S. 181,239 172,194 35.3 33.3 2,953 2,822 80.9 70.8 Japan 72,913 69,826 18.4 20.0 1,928 2,108 43.8 47.3 Germany 49,257 45,216 24.1 22.0 2,858 2,654 60.0 58.7 Russia 45,692 36,589 21.8 16.5 2,704 2,399 52.9 44.5 France 41,827 39,137 26.6 28.1 2,752 2,934 68.7 70.3 India 41,170 36,535 11.9 12.1 1,089 1,183 30.6 27.1 Brazil 39,335 32,849 25.8 27.0 2,089 2,672 56.5 58.8 UK 38,581 37,674 32.3 31.3 2,883 2,735 69.4 60.3 South Korea 30,155 29,424 27.7 35.6 4,093 4,986 50.1 72.5 Canada 22,945 23,138 43.5 42.2 3,349 3,793 95.2 88.8
  • 4. Top Gaining Site Categories by Total Unique Visitors More Canadians were accessing Community and Entertainment sites in Q4 2010. Political News sites saw the strongest growth, up 47 percent versus year ago. Top Gaining Site Categories 25,000 +18% +25% Q4 2009 Q4 2010 Total Unique Visitors (000) 20,000 +16% +23% +20% +26% 15,000 +29% +29% 10,000 +25% +27% +23% +29% +30% 5,000 +37% +47% 0
  • 5. Conversational Media Continues its Climb Even though Social Networking had a strong reach in 2009, we continued to see growth in unique visitors in 2010. Likewise, UV growth was also seen on Blog sites as Canadians spent 58% more time and consumed 36% more pages in Q4 2010 compared to that of Q4 2009. Social Networking Blogs +13% YoY +9% 25,000 Total Unique Visitors (000) 24,000 23,000 22,000 21,000 20,000 19,000 18,000 17,000 16,000 15,000
  • 6. Top Conversational Media Sites Total Unique Visitors (000): % Change % Change Most Q4 2010 Q4 2009 Unique Total Conversational Visitors Minutes Media sites saw an +7% -4% Facebook.com increase in unique visitors and time Blogger -3% +11 spent in Q4 2010 Windows Live Profile -25% -34% compared to last Technorati Media +40% +161% year. WordPress -16% -1% Federated Media +31% +138% Twitter.com +11% +26% LinkedIn.com +35% +79% Top gainers included: N/A N/A Gawker Media Technorati Media (40%) Federated Media (31%) HubPages.com +63% +107% Twitter.com (11%) Myspace -42% -76% LinkedIn.com (35%) Squidoo.com +19% +26% BlogHer +1% +34% DeviantArt.com -24% +8% Typepad -25% -2%
  • 7. Persons 55+ were the Strongest Drivers of Social Networking Growth Social Networking continues to be consumed by many different demographics of the Canadian population. As this category continues to grow, older age segments are increasingly more engaged in this content. Persons Age: Q4 2010 Social Media Growth Q4 2009 vs. Q4 2010 % Change % Change Persons - Age Unique Total Visits 6% Visitors 17% 2-17 12% 2-17 -9% -18% 18-24 18-24 -1% -7% 25-34 35-44 10% 25-34 14% 15% 45-54 17% 55-64 35-44 12% 15% 65+ 45-54 15% 15% 19% 55-64 36% 48% 19% 65+ 34% 45%
  • 8. Ad Dollars Continue to Flow Online in 2010 Total Display Ad Percentage of 2010 Total Display Ad Impressions Impressions (MM) 182,500 180,927 Q4 2010 Q1 2010 27% 24% 180,000 Q2 2010 Q3 2010 24% 177,500 25% 175,970 175,000 The number of total display ad impressions has grown 3% in 2010, with the majority of the ad impressions delivered in the final quarter of the 172,500 year. In 2010, the top two advertisers online were Procter & Gamble, followed by GMAC/Ally. Together they accounted for nearly 17 billion display ad impressions throughout the year. 170,000 Q4 2009 Q4 2010
  • 9. A Shift: Where Advertising is Displayed Online Total Display Ad Impressions (000) by Category +15.6 Q4 2009 Q4 2010 billion 60,000,000 50,000,000 40,000,000 30,000,000 -5.1 +11.1 billion billion 20,000,000 +2.2 -1.0 billion billion 10,000,000 0 E-mail Business/Finance Photos Sports Social Networking While the number of total display ad impressions grew 3% in 2010, the Social Networking category has shown the largest increase in ad impressions delivered, accounting for more than 58 billion impressions in Q4 2010. This is the result of increased social media sites that have the ability to deliver ad impressions and shifting ad impressions delivered on categories like: E-mail (-34%) and Business/Finance (-28%).
  • 10. Smartphone Penetration by Market % Change Mobile Platforms for Reportable Countries Q4 2009 vs. Q4 2010 Smartphone: Smartphone: Smartphone: Smartphone: Smartphone: Smartphone: +60% +63% +38% +12% +59% +81% Feature Phone: Feature Phone: Feature Phone: Feature Phone: Feature Phone: Feature Phone: -12% -17% -14% -6% -11% -14% Mobile Platforms for Reportable Countries Q4 2010 100% 80% Smartphone Feature Phone % Composition Leader Leader 60% 40% 20% 0% Smartphone Feature Phone Japan United States United Kingdom Spain Italy Germany France
  • 11. Platform Share of Smartphone Subscribers RIM Google Apple Microsoft Palm Symbian US 32% 29% 25% 8% 4% 3% 0% 10% 20% 30% 40% 50% 60% 70% 80% 90% 100% Total Subscribers (000s) 100% 4% 7% 12% 90% 19% 10% 13% 20% 32% Total Subscribers (000s) 80% 7% 5% 21% 70% 28% 5% 31% 60% 50% 17% 66% 68% 8% 40% 55% 48% 30% 31% 20% 30% 10% 12% 9% 10% 13% 10% 0% 5% JA UK SP IT GE FR