Travel Taxes in the U.S. The Best and Worst Cities to Visit 2013 (Select Pages)
•
1 j'aime•494 vues

The 2013 findings from GBTA Foundation's annual study of car rental, hotel and meal taxes in the top 50 U.S. travel destination cities reveal that discriminatory taxes levied specifically on travel related services increase the total tax bill for a traveler by 58%. The full report is available for purchase for non-members and at no cost for GBTA members. To learn more about the Global Business Travel Association please visit www.gbta.org.

Recommandé
Contenu connexe
En vedette
En vedette (12)
Dernier
Dernier (20)
Travel Taxes in the U.S. The Best and Worst Cities to Visit 2013 (Select Pages)
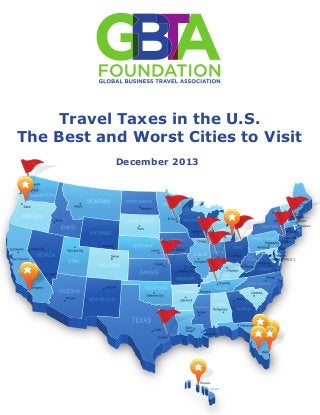
- 1. Travel Taxes in the U.S. The Best and Worst Cities to Visit December 2013
- 2. 11 Overall Tax Burden, Airport Locations The lowest and highest travel tax burdens at airport locations are shown below. These rankings account for the combined effect of general sales taxes and discriminatory travel taxes for lodging, car rentals, and meals. Just one city is new in each of the Airport-location Top Ten lists in this survey. Baltimore’s BWI Airport location supplanted regional competitor Reagan National Airport (DCA) in the Top Ten low-tax airport locations. This change is due to new taxes introduced in Northern Virginia. While serving the Washington DC area, Reagan National airport and its surrounding hotels are physically located in Arlington County, Virginia. In the past year, the state of Virginia has introduced a 2% transient occupancy tax, a 0.3% increase in the state-wide sales tax, and an additional 0.7% sales tax increase for the Northern Virginia region where Arlington is located. These increases were enough not only to knock DC/Reagan National out of the Top Ten, but to move it all the way down to 20th position on the list. Lowest Total Tax Burden - Airport Combined Taxes on Lodging, Rental Cars, and Meals (lowest to highest) Rank in 2013 Change this year Rank in 2012 1 Fort Lauderdale (FLL) 1 2 Fort Myers (RSW) 2 3 West Palm Beach (PBI) 3 4 Detroit (DTW) 4 5 Portland (PDX) 5 6 Honolulu (HNL) 7 7 Orlando (MCO) 9 8 Tampa (TPA) 10 9 Orange County (SNA) 8 10 Baltimore (BWI) 12 dropped from the list: 20 Washington (DCA) 6
- 3. State City Location Combined* percentage tax rate Added flat tax amount Overall effective tax rate on meals Tax on $93.32 in daily meals 1 OR Portland Central city 0.00% $0.00 0.00% $0.00 2 HI Honolulu Central city 4.67% $0.00 4.67% $4.35 3 FL Fort Lauderdale Central city 6.00% $0.00 6.00% $5.60 4 FL Fort Myers Central city 6.00% $0.00 6.00% $5.60 5 FL West Palm Beach Central city 6.00% $0.00 6.00% $5.60 6 MD Baltimore Central city 6.00% $0.00 6.00% $5.60 7 MI Detroit Central city 6.00% $0.00 6.00% $5.60 8 WI Milwaukee Central city 6.10% $0.00 6.10% $5.69 9 CT Hartford Central city 6.35% $0.00 6.35% $5.93 10 FL Orlando Central city 6.50% $0.00 6.50% $6.07 11 FL Jacksonville Central city 7.00% $0.00 7.00% $6.53 12 FL Tampa Central city 7.00% $0.00 7.00% $6.53 13 PA Pittsburgh Central city 7.00% $0.00 7.00% $6.53 14 MA Boston Central city 7.00% $0.00 7.00% $6.53 15 NM Albuquerque Central city 7.00% $0.00 7.00% $6.53 16 OH Columbus Central city 7.00% $0.00 7.00% $6.53 17 NC Charlotte Central city 7.75% $0.00 7.75% $7.23 18 NC Raleigh Central city 7.75% $0.00 7.75% $7.23 19 UT Salt Lake City Central city 7.85% $0.00 7.85% $7.33 20 CA Ontario Central city 8.00% $0.00 8.00% $7.47 21 CA Orange County Central city 8.00% $0.00 8.00% $7.47 22 CA San Diego Central city 8.00% $0.00 8.00% $7.47 23 CO Denver Central city 8.00% $0.00 8.00% $7.47 24 GA Atlanta Central city 8.00% $0.00 8.00% $7.47 25 OH Cleveland Central city 8.00% $0.00 8.00% $7.47 26 PA Philadelphia Central city 8.00% $0.00 8.00% $7.47 27 NV Las Vegas Central city 8.10% $0.00 8.10% $7.56 28 TX San Antonio Central city 8.13% $0.00 8.13% $7.58 29 TX Austin Central city 8.25% $0.00 8.25% $7.70 30 TX Dallas Central city 8.25% $0.00 8.25% $7.70 31 TX Houston Central city 8.25% $0.00 8.25% $7.70 32 AZ Phoenix Central city 8.30% $0.00 8.30% $7.75 33 CA Sacramento Central city 8.50% $0.00 8.50% $7.93 34 CA San Francisco Central city 8.75% $0.00 8.75% $8.17 35 CA San Jose Central city 8.75% $0.00 8.75% $8.17 36 NY Buffalo Central city 8.75% $0.00 8.75% $8.17 37 NY New York Central city 8.88% $0.00 8.88% $8.28 38 CA Burbank Central city 9.00% $0.00 9.00% $8.40 39 CA Los Angeles Central city 9.00% $0.00 9.00% $8.40 40 CA Oakland Central city 9.00% $0.00 9.00% $8.40 41 FL Miami Central city 9.00% $0.00 9.00% $8.40 42 IN Indianapolis Central city 9.00% $0.00 9.00% $8.40 43 TN Nashville Central city 9.25% $0.00 9.25% $8.63 44 LA New Orleans Central city 9.38% $0.00 9.38% $8.75 45 WA Seattle Central city 9.50% $0.00 9.50% $8.87 46 DC Washington Central city 10.00% $0.00 10.00% $9.33 47 MO St. Louis Central city 10.18% $0.00 10.18% $9.50 48 MO Kansas City Central city 10.35% $0.00 10.35% $9.66 49 IL Chicago Central city 10.75% $0.00 10.75% $10.03 50 MN Minneapolis Central city 10.78% $0.00 10.78% $10.06 *Combined state, county, city and taxing districts. Note: Top ten and bottom ten are in bold. Maximum rate 10.78% $0.00 10.78% $10.06 Minimum rate 0.00% $0.00 0.00% $0.00 Average rate 7.86% $0.00 7.86% $7.34 Median rate 8.00% $0.00 8.00% $7.47 Central City Daily Meals Tax Rates and Tax Amount Restaurant Taxes Top 50 Destinations 25