
Recommended
More Related Content
What's hot
What's hot (20)
Viewers also liked
Viewers also liked (20)
Similar to IBIS-L: IBIS-L: An innovative solution for remote monitoring of displacements on slopes and structures.
Similar to IBIS-L: IBIS-L: An innovative solution for remote monitoring of displacements on slopes and structures. (7)
IBIS-L: IBIS-L: An innovative solution for remote monitoring of displacements on slopes and structures.
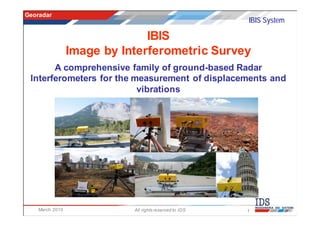
- 1. Georadar IBIS System IBIS Image by Interferometric Survey A comprehensive family of ground-based Radar Interferometers for the measurement of displacements and vibrations March 2010 All rights reserved to IDS 1
- 2. Georadar IBIS System IBIS: ground-based interferometric radars IDS present the IBIS family: an innovative range of advanced “geodetic” instruments based on ground-based radar interferometry aimed at providing accurate measurement of movements over wide areas. IBIS products have been designed to address the specific needs of the civil engineering, geotechnical and mining markets This revolutionary approach provides the IBIS users with accurate remote measurements without requiring any contact with the target and in almost all weather conditions. March 2010 All rights reserved to IDS 2
- 3. Georadar IBIS System IBIS product range PRODUCTS APPLICATIONS IBIS - L LANDSLIDE & DAM MONITORING IBIS - M SLOPE STABILITY IN MINING IBIS - S STRUCTURE MOVEMENTS March 2010 All rights reserved to IDS 3
- 4. Georadar IBIS System IBIS-S: system & application fields BRIDGE TESTING CULTURAL HERITAGES IBIS-S INDUSTRIAL FACILITIES March 2010 All rights reserved to IDS 4
- 5. Georadar IBIS System IBIS-L: system & application fields LANDSLIDE MONITORING DAM MONITORING IBIS-L GROUND SETTLEMENTS MONITORING March 2010 All rights reserved to IDS 5
- 6. Georadar IBIS System IBIS-M: system & application field IBIS-M SLOPE MOVEMENT MONITORING WITHIn OPEN PITS MINES March 2010 All rights reserved to IDS 6
- 7. Georadar IBIS System Techniques behind the IBIS systems The IBIS products are based on four well-known radar techniques: 1. Stepped-Frequency Continuous Wave (SF-CW) technique resolves the scenario in the range direction, detecting the position in range of different targets placed along the radar’s line of sight; 2. Synthetic Aperture Radar (SAR) allows to obtain 2D high-resolution radar images by adding to the range resolution (fro the SF-CW), the cross-range angular resolution 3. Interferometric technique, computes the displacement of each pixels by comparing the phase information of the radar signal collected at different times. 4. Persistent Scatterers algorithm (PSInSAR) selects among the whole image the high quality pixels and estimates the atmospheric artefacts in an automatic and robust way March 2010 All rights reserved to IDS 7
- 8. Georadar IBIS System Stepped Frequency-Continuous Wave The SFCW radar detects the position in range of different targets placed along the radar’s line of sight n-th range bin IBIS-S Range profile Amplitude The range resolution of 0.5 m, independent from the distance. Distance (m) March 2010 All rights reserved to IDS 8
- 9. Georadar IBIS System IBIS-S: 1-dimensional range profiles Range Profile: one dimensional image with 0.5m range resolution Welding lines are good reflective points IBIS-S installed at the turbine pillar base (height 60m) March 2010 All rights reserved to IDS 9
- 10. Georadar IBIS System IBIS-L & IBIS-M: Synthetic Aperture Radar (SAR) SAR technique enables the system to provide high cross range resolution exploiting the movement of the physical antenna along a straight trajectory (linear scanner) Using 2 m rail IBIS-L system obtains 4.38mrad (=0.25deg) angle resolution The SAR process of the data, collected during the movement of the sensor head on the 2 meter track, allows the IBIS-L and M systems to synthesize a 2m antenna whose azimuth beam width is: λ Δϕ = = 4.38mrad 2⋅L March 2010 All rights reserved to IDS 10
- 11. Georadar IBIS System IBIS-L & IBIS-M: SAR 2-dimensional images The combination of SAR and SF-CW techniques allows the system to resolve the scenario into two dimensional pixels Power Map Pixel dimension: • 0.5m in range; • 1.35m – 4.05m cross range for 300 - 900m range Optical Image March 2010 All rights reserved to IDS 11
- 12. Georadar IBIS System Interferometric capability The interferometric analysis provides data on object displacement by comparing phase information, collected in different time periods, of reflected waves from the object, providing a measure of the displacement with an accuracy of less than 0.01mm (intrinsic radar accuracy in the order of 0.001 mm.) TX First acquisition RX ϕ1 λ d d=− (ϕ 2 − ϕ1 ) 4π TX Second acquisition RX ϕ2 March 2010 All rights reserved to IDS 12
- 13. Georadar IBIS System Interferometric capability The displacement is measured in the direction of the line of sight of the system. To calculate the real displacement is needed to know the acquisition geometry R dp h α d dp h R The distance R d= sin(α ) = d = dp ⋅ is measured sin(α ) R h by IBIS-S March 2010 All rights reserved to IDS 13
- 14. Georadar IBIS System IBIS main advantages The main advantages of the use of IBIS for monitoring are: possibility to carry out the survey without accessing the land/structure but installing the IBIS system in its proximity obtain information from all the area illuminated by the antenna beam: the radar measures the local displacement of the scenario by resolving it into pixels of a few square meters high displacement measurement accuracy, up to 1/10 mm day-night continuous operation completely autonomous operation not requiring human intervention acquisition frequency of the order minutes for IBIS-L, msec for IBIS-S March 2010 All rights reserved to IDS 14
- 15. Georadar IBIS System Landslide monitoring Active earth slide evolving into an earth flow in the lower part Very fast movements (m/days) during re-activation periods March 2010 All rights reserved to IDS 15
- 16. Georadar IBIS System Landslide monitoring DISTANZA DAL VERSANTE [m] 450-1300 APERTURA ORIZZONTALE ANTENNE [gradi] 38 RISOLUZIONE IN RANGE [m] 0.5 RISOLUZIONE IN CROSS-RANGE [mrad] 4.5 ACQUISIZIONI PER ORA - 9 DURATA SESSIONE [ore] 24 IBIS - L IBIS - L IBIS-L IBIS-L System set-up March 2010 All rights reserved to IDS 16
- 17. Georadar IBIS System Landslide monitoring 1 0.5 Geocoded quality map Picture taken from the radar location More than 40.000 measurement points are identified on the quality map March 2010 All rights reserved to IDS 17
- 18. Georadar IBIS System Geocoded cumulative displacement map (1 h) Geocoded Line Of Sight Displacement Map [mm] 2 -50 March 2010 All rights reserved to IDS 18
- 19. Georadar IBIS System Geocoded cumulative displacement map (2 h) Geocoded Line Of Sight Displacement Map [mm] 2 -50 March 2010 All rights reserved to IDS 19
- 20. Georadar IBIS System Geocoded cumulative displacement map (3 h) Geocoded Line Of Sight Displacement Map [mm] 2 -50 March 2010 All rights reserved to IDS 20
- 21. Georadar IBIS System Geocoded cumulative displacement map (4 h) Geocoded Line Of Sight Displacement Map [mm] 2 -50 March 2010 All rights reserved to IDS 21
- 22. Georadar IBIS System Geocoded cumulative displacement map (5 h) Geocoded Line Of Sight Displacement Map [mm] 2 -50 March 2010 All rights reserved to IDS 22
- 23. Georadar IBIS System Geocoded cumulative displacement map (6 h) Geocoded Line Of Sight Displacement Map [mm] 2 -50 March 2010 All rights reserved to IDS 23
- 24. Georadar IBIS System Geocoded cumulative displacement map (7 h) Geocoded Line Of Sight Displacement Map [mm] 2 -50 March 2010 All rights reserved to IDS 24
- 25. Georadar IBIS System Geocoded cumulative displacement map (8 h) Geocoded Line Of Sight Displacement Map [mm] 2 -50 March 2010 All rights reserved to IDS 25
- 26. Georadar IBIS System Geocoded cumulative displacement map (9 h) Geocoded Line Of Sight Displacement Map [mm] 2 -50 March 2010 All rights reserved to IDS 26
- 27. Georadar IBIS System Geocoded cumulative displacement map (10 h) Geocoded Line Of Sight Displacement Map [mm] 2 -50 March 2010 All rights reserved to IDS 27
- 28. Georadar IBIS System Geocoded cumulative displacement map (11 h) Geocoded Line Of Sight Displacement Map [mm] 2 -50 March 2010 All rights reserved to IDS 28
- 29. Georadar IBIS System Geocoded cumulative displacement map (12 h) Geocoded Line Of Sight Displacement Map [mm] 2 -50 March 2010 All rights reserved to IDS 29
- 30. Georadar IBIS System Geocoded cumulative displacement map (13 h) Geocoded Line Of Sight Displacement Map [mm] 2 -50 March 2010 All rights reserved to IDS 30
- 31. Georadar IBIS System Geocoded cumulative displacement map (14 h) Geocoded Line Of Sight Displacement Map [mm] 2 -50 March 2010 All rights reserved to IDS 31
- 32. Georadar IBIS System Geocoded cumulative displacement map (15 h) Geocoded Line Of Sight Displacement Map [mm] 2 -50 March 2010 All rights reserved to IDS 32
- 33. Georadar IBIS System Geocoded cumulative displacement map (16 h) Geocoded Line Of Sight Displacement Map [mm] 2 -50 March 2010 All rights reserved to IDS 33
- 34. Georadar IBIS System Geocoded cumulative displacement map (17 h) Geocoded Line Of Sight Displacement Map [mm] 2 -50 March 2010 All rights reserved to IDS 34
- 35. Georadar IBIS System Geocoded cumulative displacement map (18 h) Geocoded Line Of Sight Displacement Map [mm] 2 -50 March 2010 All rights reserved to IDS 35
- 36. Georadar IBIS System Geocoded cumulative displacement map (19 h) Geocoded Line Of Sight Displacement Map [mm] 2 -50 March 2010 All rights reserved to IDS 36
- 37. Georadar IBIS System Geocoded cumulative displacement map (20 h) Geocoded Line Of Sight Displacement Map [mm] 2 -50 March 2010 All rights reserved to IDS 37
- 38. Georadar IBIS System Geocoded cumulative displacement map (21 h) Geocoded Line Of Sight Displacement Map [mm] 2 -50 March 2010 All rights reserved to IDS 38
- 39. Georadar IBIS System Geocoded cumulative displacement map (22 h) Geocoded Line Of Sight Displacement Map [mm] 2 -50 March 2010 All rights reserved to IDS 39
- 40. Georadar IBIS System Geocoded cumulative displacement map (23 h) Geocoded Line Of Sight Displacement Map [mm] 2 -50 March 2010 All rights reserved to IDS 40
- 41. Georadar IBIS System Geocoded cumulative displacement map (24 h) Geocoded Line Of Sight Displacement Map [mm] 2 -50 March 2010 All rights reserved to IDS 41
- 42. Georadar IBIS System Identification of moving portions of the slope Geocoded Line Of Sight Displacement Map Zona A Zona B Zona C Zona D [mm] 2 -50 March 2010 All rights reserved to IDS 42
- 43. Georadar IBIS System Displacement time series ZONA A - movimento di alcuni punti di misura selezionati Line Of Sight Displacement Time Series Mappe di spostamento cumulato dopo 24 ore March 2010 All rights reserved to IDS 43
- 44. Georadar IBIS System Displacement time series ZONE A - displacement of a few points Line Of Sight Displacement Time Series Mappe di spostamento cumulato dopo 24 ore March 2010 All rights reserved to IDS 44
- 45. Georadar IBIS System Displacement time series ZONE B - displacement of a few points Line Of Sight Displacement Time Series Mappe di spostamento cumulato dopo 24 ore March 2010 All rights reserved to IDS 45
- 46. Georadar IBIS System Displacement time series ZONE C - displacement of a few points Line Of Sight Displacement Time Series Mappe di spostamento cumulato dopo 24 ore March 2010 All rights reserved to IDS 46
- 47. Georadar IBIS System IBIS-M for open-pit mines Following a 80,000 ton slip occurred in late 2009 and the consequent closure of operations, an IBIS-M unit was deployed in January 2010 at the Pipeline pit in Cortez, Nevada, owned by Barrick. The IBIS-M system was aimed at providing early warnings and support for geotechnical evaluation purposes. After 7 months of rental of the equipment, in July 2010, the IBIS-M unit was purchased by Barrick.
- 48. Georadar IBIS System IBIS-M for open-pit mines DISTANCE FROM THE SLOPE [m] 800 – 1500 ANTENNA BEAM WIDTH [deg] 68 NUMBER OF POINTS - 90.000 0.5 RANGE RESOLUTION [m] (1.64 ft) CROSS-RANGE RESOLUTION [mrad] 4.5 SCANNING TIME [min] 5
- 49. Georadar IBIS System IBIS-M set-up Dispatch Room Guardian Software Shelter (pit rim) 24/7 monitoring for alarms IBIS‐M basic configuration unit Status alarms/emails Fully enclosed (HVAC, WiFi) Geotechnical alarms/emails Mine grid power supply Backup power (1 day with genset) IBIS Controller Software 24/7 functioning Wireless link +/‐ 200‐300KB VPN, VNC every 6‐7 mins connections Engineer’s laptop
- 50. Georadar IBIS System IBIS-M set-up Proces sing unit Dedicated laptop Sensor unit Pa nasonic CF19 IP65 Power supply unit (IBIS and laptop) Linear scanner Base Shelter
- 51. Georadar IBIS System Cumulative displacement from 03/02 to 18/02
- 52. Georadar IBIS System Cumulative displacement from 03/02 to 25/02
- 53. Georadar IBIS System Cumulative displacement from 03/02 to 07/03
- 54. Georadar IBIS System Cumulative displacement from 03/02 to 21/03
- 55. Georadar IBIS System Cumulative displacement from 03/02 to 04/04
- 56. Georadar IBIS System Cumulative displacement from 03/02 to 19/04
- 57. Georadar IBIS System Cumulative displacement from 03/02 to 04/05
- 58. Georadar IBIS System Cumulative displacement from 03/02 to 18/05
- 59. Georadar IBIS System Cumulative displacement from 03/02 to 01/06
- 60. Georadar IBIS System Cumulative displacement from 03/02 to 15/06
- 61. Georadar IBIS System Cumulative displacement from 03/02 to 29/06
- 62. Georadar IBIS System Cumulative displacement from 03/02 to 14/07
- 63. Georadar IBIS System Cumulative displacement from 03/02 to 29/07
- 64. Georadar IBIS System Cumulative displacement from 03/02 to 13/08
- 65. Georadar IBIS System Cumulative displacement from 03/02 to 27/08
- 66. Georadar IBIS System Cumulative displacement from 03/02 to 10/09
- 67. Georadar IBIS System Cumulative displacement from 03/02 to 21/09
- 68. Georadar IBIS System Cumulative displacement from 03/02 to 21/09: time series
- 69. Georadar IBIS System Cumulative displacement from 03/02 to 21/09: time series
- 70. Georadar IBIS System Dam monitoring Cancano Dam view Dam characteristics Dam Type Gravity arch Location Alpi Retiche - Italy Dam height (m) 125.5 Crowing length (m) 381 Dam plan Survey performed with the Surveying Dept. of Milan Polytechnic March 2010 All rights reserved to IDS 70
- 71. Georadar IBIS System Dam monitoring IBIS-L configuration • Dam-sensor distance: 400m • Range resolution: 0.5m • Angle resolution: 4.7mrad • Sampling interval: ca. 9 minutes March 2010 All rights reserved to IDS 71
- 72. Georadar IBIS System Dam monitoring Zoom onMap area SNR dam dam rocks March 2010 All rights reserved to IDS 72
- 73. Georadar IBIS System Dam monitoring Dam Power map projected over plan March 2010 All rights reserved to IDS 73
- 74. Georadar IBIS System Dam monitoring Selected pixel L.O.S. displacement – 5 pixel belonging to the dam crown March 2010 All rights reserved to IDS 74
- 75. Georadar IBIS System Dam monitoring Point displacement comparable with dam coordinometer March 2010 All rights reserved to IDS 75
- 76. Georadar IBIS System Dam monitoring Crowining point displacement comparison between IBIS-L and coordinometer measure IBIS-L sampling interval: 9min Pendulum sampling interval: 4hours March 2010 All rights reserved to IDS 76
- 77. Georadar IBIS System IBIS Guardian IBIS Guardian • Real time processing with automatic atmospheric corrections • Alarm generation with user-defined levels and multiple alarm criteria • Fully georeferenced outputs • 3D interactive data handling • User defined zones for alarm generation • Exportability of outputs to GIS and mine planning software 77
- 78. Georadar IBIS System GUARDIAN typical output Displacement Map - in mm for every pixel - negative displacements are in approach Velocity Map DEM - in mm/h for every pixel Hazard Map -Variable number of levels and thresholds -Automatically updated with the last data Quality Map Alarm -Exclude / Differentiation of areas - Trigger the alarms: - Values between 0-1 Moving - PC SC REEN - Reliability of the pixel for - SMS distance measurements Stable - EMAIL March – April 2010
- 79. Georadar IBIS System Bridge testing: static live load test Viaducts crossing Forlanini Avenue Bridge beams are good reflecting points (Milan, Italy) Static monitoring of a new bridge: Determination of displacement of the bridge during a static load test March 2010 All rights reserved to IDS 79
- 80. Georadar IBIS System Bridge testing: static live load test 90 B C A D 80 H E F IBIS-S 70 G installation SNR (dB) 60 50 Range profile of 40 P2-S – P3-S span 30 0 10 20 30 40 50 60 70 Ground-Range (m) March 2010 All rights reserved to IDS 80
- 81. Georadar IBIS System Bridge testing: static live load test LC1 LVDT 10 displacement (mm) 0 -10 B D -20 F H -30 0 200 400 600 800 1000 1200 1400 time (s) March 2010 All rights reserved to IDS 81
- 82. Georadar IBIS System Bridge testing: static live load test LC1 LVDT 10 IBIS-S displacement (mm) LVDT 0 -8.84 -10 -15.62 -20.50 -20 -30 0 200 400 600 800 1000 1200 1400 time (s) March 2010 All rights reserved to IDS 82
- 83. Georadar IBIS System Bridge testing: static live load test LC2 LVDT 10 IBIS-S displacement (mm) 0 LVDT -10 -14.28 -20 -25.20 -30 -32.76 -40 0 200 400 600 800 1000 1200 1400 time (s) March 2010 All rights reserved to IDS 83
- 84. Georadar IBIS System Bridge testing: static live load test LC1, P2-S – P3-S span: Deformed elastic curve provided by IBIS-S March 2010 All rights reserved to IDS 84
- 85. Georadar IBIS System Bridge testing: dynamic test of bridge span Measurement objective: comparison with accelerometers, resonance frequencies and modal shape retrieval Central arch length (m): 62.5 March 2010 All rights reserved to IDS 85
- 86. Georadar IBIS System Bridge testing: dynamic test of bridge span To make a comparison between the results of IBIS-S system and accelerometers system 6 corner reflector were installed at the same position of accelerometers March 2010 All rights reserved to IDS 86
- 87. Georadar IBIS System Bridge testing: dynamic test of bridge span Bridge photograph and range profile March 2010 All rights reserved to IDS 87
- 88. Georadar IBIS System Bridge testing: dynamic test of bridge span Velocity comparison for Test Point 22 Velocity [mm/sec] Zoom on the first 15 sec – direct comparison IBIS-S IBIS-S acc Time [sec] Velocity [mm/sec] accelerometer Time [sec] March 2010 All rights reserved to IDS 88
- 89. Georadar IBIS System Bridge testing: dynamic test of bridge span Frequency analysis acc comparison on 3000sec acquisition duration IBIS-S Acc detected IBIS-S detected Percentage frequency frequency error Hz Hz % 2,617 2,595 0,84 3,164 3,182 -0,57 6,641 6,608 0,50 8,086 8,077 0,11 March 2010 All rights reserved to IDS 89
- 90. Georadar IBIS System Bridge testing: dynamic test of bridge span Modal shape obtained by accelerometer data f = 2.617 Hz f = 3.164 Hz f = 6.641 Hz f = 8.086 Hz March 2010 All rights reserved to IDS 90
- 91. Georadar IBIS System Bridge testing: dynamic test of bridge span Modal shapes comparison 1.2 Normalized Mode Shape Accelerometer IBIS-S sensor 0.6 0.0 f=2.617Hz -0.6 -1.2 0 23 46 69 92 115 Distance along deck (m) 1.2 Normalized Mode Shape Accelerometer IBIS-S sensor 0.6 0.0 f=3.164Hz -0.6 -1.2 0 23 46 69 92 115 Distance along deck (m) March 2010 All rights reserved to IDS 91
- 92. Georadar IBIS System Bridge testing: dynamic test of bridge span Modal shapes comparison 1.2 Normalized Mode Shape Accelerometer IBIS-S sensor 0.6 0.0 f=6.641Hz -0.6 -1.2 0 23 46 69 92 115 Distance along deck (m) 1.2 Normalized Mode Shape Accelerometer IBIS-S sensor 0.6 0.0 f=8.086Hz -0.6 -1.2 0 23 46 69 92 115 Distance along deck (m) March 2010 All rights reserved to IDS 92
- 93. Georadar IBIS System Bridge testing: Cable-stayed bridges Application goal: dynamic analysis done through ambient vibration testing (AVT) aimed at: - Identify the amplitude of the cable vibrations; - Identify the natural resonant frequencies and the cable dumping factors - Evaluate the tension and the operating strain of cables to verify the correct distribution of loads and the temporal variation of tensions along the bridge life March 2010 All rights reserved to IDS 93
- 94. Georadar IBIS System Bridge testing: Cable-stayed bridges Advantages in the use of IBIS-S: - Provide displacement measurements (useful to evaluate the amplitude of vibrations) - Very accurate measurement: an order of magnitude higher than LDV - No traffic shut-done needed (IBIS can be installed under the bridge or beside the bridge towers) - Simultaneuous measurement on a large number of cables (potentially all cables of each side at once) - Rapid installation and measurement set-up March 2010 All rights reserved to IDS 94
- 95. Georadar IBIS System Bridge testing: Cable-stayed bridges Geometrical sketch of IBIS-S set-up: IBIS on the bridge IBIS below the bridge March 2010 All rights reserved to IDS 95
- 96. Georadar IBIS System Bridge testing: Cable-stayed bridges Olginate bridge (Italy) March 2010 All rights reserved to IDS 96
- 97. Georadar IBIS System Bridge testing: Cable-stayed bridges Olginate bridge (Italy) IBIS-S set-up Range Profile Displacement graph 0,8 Displacements (mm) 0,4 0,0 -0,4 -0,8 -1,2 -1,6 -2,0 Interferometro IBIS-S 0 100 200 300 400 500 600 7 00 800 900 10 00 Time (s) March 2010 All rights reserved to IDS 97
- 98. Georadar IBIS System Bridge testing: Cable-stayed bridges Example: Olginate bridge (Italy) Comparison with accelerometers 800 Acceleration (mm/s 2) 600 400 200 0 -200 -400 -600 -800 Sensore WR731A Interferometro IBIS 260 270 280 29 0 300 310 Time (s) 500 400 Acceleration (mm/s 2) 300 200 100 0 -100 -200 -300 -400 Sensore WR731A Interferometro IBIS -500 260 270 280 29 0 300 310 Piezo-electric accel. WR 731A Time (s) March 2010 All rights reserved to IDS 98
- 99. Georadar IBIS System Bridge testing: Cable-stayed bridges Example: Olginate bridge (Italy) 26 24 22 Frequency (Hz) Frequency Domain Analysis 20 18 fre que nz a [Hz] 0 10 -1 Interferometro IBIS 16 f = 3.906 n 10 14 12 ASD (mm) 2/Hz -2 10 -3 10 IBIS 10 8 -4 6 10 4 -5 10 2 -6 0 10 -7 0 1 2 3 4 5 6 7 10 -8 n n 10 10 -1 0 5 10 15 20 25 Tension Sensore WR731A ASD (mm) 2/Hz -2 10 Cable S09' 10 -3 Accel. IBIS-S Accelerometer -4 10 -5 fexp Tension fexp Tension 10 (Hz) (kN) (Hz) (kN) -6 10 3.906 1883.1 3.809 1790.7 -7 10 0 5 10 15 20 25 7.764 1860.0 7.495 1733.3 Frequency (Hz) 11.720 1883.7 11.470 1804.2 Resonant frequencies 15.630 1884.5 f1 (Hz) f2 (Hz) f3 (Hz) f4 (Hz) f5 (Hz) f6 (Hz) 19.510 1879.2 IBIS-S 3.906 7.764 11.720 15.630 19.510 23.460 23.460 1886.9 Accel. 3.809 7.495 11.470 1880 1776 March 2010 All rights reserved to IDS 99
- 100. Georadar IBIS System High-rise structures: chimney testing Measurement objective: measurement of the displacements of the old and new chimney and identification of their resonance frequencies Old chimney New chimney Chimney high: 183m Measurement parameters: maximum range: 300 m sampling frequency: 50 Hz range resolution: 0.5 m distance from the target: ~ 50 m March 2010 All rights reserved to IDS 100
- 101. Georadar IBIS System High-rise structures: chimney testing Range profile of the new chimney T h e rm a l S N R - S u r v 0 2 50 40 30 SNR [dB] 20 10 0 -1 0 0 50 100 150 200 2 50 R an ge [m ] March 2010 All rights reserved to IDS 101
- 102. Georadar IBIS System High-rise structures: chimney testing Horizontal displacement Frequency Analysis New chimney 2 45 40 1.5 Projected Displacement [mm] 35 Point located at the 30 1 [mm/H z] middle of the 25 X: 0.38 chimney, at a height Y: 20.54 of 121 m 0.5 20 15 0 10 Rbin 266 5 -0.5 0 0.5 1 1.5 2 100 200 300 400 500 600 frequency [Hz] time [sec] 45 3.5 Rbin 362 40 3 Projected Displacement [mm] Point located at the 2.5 35 top of the chimney, 2 30 at a height of 172 m [mm/Hz] X: 0.38 1.5 25 Y : 22.3 8 1 20 0.5 15 0 10 -0.5 5 Identified frequency: 0.38 Hz 100 200 300 400 500 600 0 0.2 0.4 0.6 0.8 1 1. 2 frequency [Hz] 1.4 1. 6 1.8 2 time [sec] March 2010 All rights reserved to IDS 102