2. Introduction
• It is a novel & non destructive method of chemical analysis and
a variety of x –ray techniques are available in practice.
• These are : X – Ray Absorption : X-ray diffraction
X-ray Fluorescence
• “ Every crystalline substance gives a pattern; the same substance
2
• “ Every crystalline substance gives a pattern; the same substance
always gives the same pattern; and in a mixture of substances each
produces its pattern independently of the others”.
• The X-ray diffraction pattern of a pure substance is, therefore, like
a “fingerprint of the substance”.
7. Why to select XRD?
• Measure the average spacing's between layers of atoms.
• Determine the orientation of a single crystal.
7
• Find the crystal structure of an unknown material.
• Measure the size, shape and internal stress of small
crystalline regions.
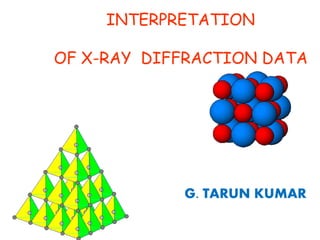
8. What is Crystallography???
• The atoms are arranged in a regular
pattern, and there is as smallest volume
element that by repetition in three
dimensions describes the crystal. This
8
dimensions describes the crystal. This
smallest volume element is called a unit
cell.
• The dimensions of the unit cell is
described by three axes : a, b, c and the
angles between them α, β , and γ are
lattice constants which can be
determined by XRD.Lattice
9. Diffraction Conditions
Fraunhofer diffraction Bragg diffraction
}d
}d
9
For constructive
interference,
d sin = n
For constructive
interference,
2(d sin) =n
d
}
}
d
d sin
}
}d
d sin d sin
10. How X-rays are Produced???
10
X-rays are produced whenever high-speed electrons collide with a metal
target. A source of electrons – hot W filament, a high accelerating voltage
between the cathode (W) and the anode and a metal target, Cu, Al, Mo,
Mg.
13. D8 ADVANCE Bragg-Brentano
Diffractometer
• A scintillation counter may be
used as detector instead of film
to yield exact intensity data.
• Using automated goniometers
step by step scattered intensity
13
step by step scattered intensity
may be measured and stored
digitally.
• The digitised intensity may be
very detailed discussed by
programs.
• More powerful methods may be
used to determine lots of
information about the specimen.
16. Experimental XRD data are compared to
reference patterns to determine what
phases are present
16
The reference patterns are represented by sticks
the position and intensity of the reference sticks
should match the data.
A small amount of mismatch in peak position and
intensity is acceptable experimental error.
21. All calculations are more accurate if you use more
peaks over a longer angular range
21
If you use one or two peaks, you must assume:
– That there is no specimen displacement error when calculating lattice
parameters
– That there is no microstrain broadening when calculating crystallite
size.
22. If you use many peaks over a long angular range (for
example, 7+ peaks over a 60° 2theta range), you can:
Calculate and correct for specimen displacement when
solving lattice parameters.
22
solving lattice parameters.
Calculate and account for microstrain broadening when
calculating crystallite size.
Improve precision by one or two orders of magnitude.
24. Applications of XRD
XRD is a non destructive technique to identify
crystalline phases.
The powder xrd pattern may be thought of as
24
The powder xrd pattern may be thought of as
finger print of the single crystal structure, and it
may be used conduct qualitative and quantitative
analysis.
XRD is a technique used to determine the
orientation of the given crystal compound.
25. Obtain XRD pattern are used to measure d-spacings of
the given compound.
Determination of Cis-Trans isomerism.
25
Determination of Cis-Trans isomerism.
To measure thickness of thin films and multi-layers.
To determine atomic arrangement.