
Recommended
More Related Content
Viewers also liked
Viewers also liked (16)
Recently uploaded
Recently uploaded (20)
Survey Summary art/zoo/bot/hist/sci
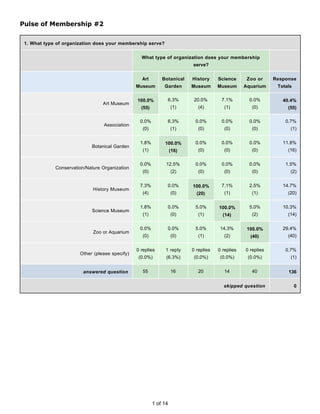
- 1. Pulse of Membership #2 1. What type of organization does your membership serve? What type of organization does your membership serve? Art Botanical History Science Zoo or Response Museum Garden Museum Museum Aquarium Totals 100.0% 6.3% 20.0% 7.1% 0.0% 40.4% Art Museum (55) (1) (4) (1) (0) (55) 0.0% 6.3% 0.0% 0.0% 0.0% 0.7% Association (0) (1) (0) (0) (0) (1) 1.8% 100.0% 0.0% 0.0% 0.0% 11.8% Botanical Garden (1) (16) (0) (0) (0) (16) 0.0% 12.5% 0.0% 0.0% 0.0% 1.5% Conservation/Nature Organization (0) (2) (0) (0) (0) (2) 7.3% 0.0% 100.0% 7.1% 2.5% 14.7% History Museum (4) (0) (20) (1) (1) (20) 1.8% 0.0% 5.0% 100.0% 5.0% 10.3% Science Museum (1) (0) (1) (14) (2) (14) 0.0% 0.0% 5.0% 14.3% 100.0% 29.4% Zoo or Aquarium (0) (0) (1) (2) (40) (40) 0 replies 1 reply 0 replies 0 replies 0 replies 0.7% Other (please specify) (0.0%) (6.3%) (0.0%) (0.0%) (0.0%) (1) answered question 55 16 20 14 40 136 skipped question 0 1 of 14
- 2. 2. Comparing year to date membership totals in the 4th Quarter of 2009 to year to date membership totals in Q4 2008, did your membership... What type of organization does your membership serve? Art Botanical History Science Zoo or Response Museum Garden Museum Museum Aquarium Totals 21.8% 50.0% 35.0% 42.9% 67.5% 41.2% Increase from the previous year (12) (8) (7) (6) (27) (56) 72.7% 43.8% 50.0% 28.6% 22.5% 47.8% Decrease from the previous year (40) (7) (10) (4) (9) (65) 5.5% 6.3% 15.0% 28.6% 10.0% 11.0% Stay the same (3) (1) (3) (4) (4) (15) answered question 55 16 20 14 40 136 skipped question 0 3. In comparing membership revenues year to date in the 4th Quarter of 2009 to membership revenues year to date in Q4 2008, have your membership revenues.... What type of organization does your membership serve? Art Botanical History Science Zoo or Response Museum Garden Museum Museum Aquarium Totals 29.1% 50.0% 35.0% 57.1% 72.5% 47.8% Increase over previous year's revenues (16) (8) (7) (8) (29) (65) 65.5% 37.5% 55.0% 21.4% 22.5% 43.4% Decrease from previous year's revenues (36) (6) (11) (3) (9) (59) Revenues were about the same in 2008 and 5.5% 12.5% 10.0% 21.4% 5.0% 8.8% 2007 (3) (2) (2) (3) (2) (12) answered question 55 16 20 14 40 136 skipped question 0 2 of 14
- 3. 4. Comparing your membership expenditure budget for 2009 to the previous year's budget, has your membership budget.... What type of organization does your membership serve? Art Botanical History Science Zoo or Response Museum Garden Museum Museum Aquarium Totals 5.5% 18.8% 15.0% 14.3% 10.0% 11.0% Increased over the previous year's budget (3) (3) (3) (2) (4) (15) 58.2% 18.8% 30.0% 21.4% 42.5% 44.1% Decreased from the previous year's budget (32) (3) (6) (3) (17) (60) Stayed about the same as the previous year's 36.4% 62.5% 55.0% 64.3% 47.5% 44.9% budget (20) (10) (11) (9) (19) (61) answered question 55 16 20 14 40 136 skipped question 0 5. If your 2010 expenditure budget has been approved, will it be.... What type of organization does your membership serve? Art Botanical History Science Zoo or Response Museum Garden Museum Museum Aquarium Totals 16.4% 12.5% 10.0% 21.4% 22.5% 18.4% Increasing over your 2009 budget (9) (2) (2) (3) (9) (25) 32.7% 18.8% 15.0% 14.3% 25.0% 26.5% Decreasing from your 2009 budget (18) (3) (3) (2) (10) (36) 32.7% 37.5% 25.0% 28.6% 20.0% 26.5% Staying the same as your 2009 budget (18) (6) (5) (4) (8) (36) 18.2% 31.3% 50.0% 35.7% 32.5% 28.7% 2010 budget is not yet approved (10) (5) (10) (5) (13) (39) answered question 55 16 20 14 40 136 skipped question 0 3 of 14
- 4. 6. Comparing new members year to date in 2009 to new members year to date in 2008, did your membership acquisition efforts... What type of organization does your membership serve? Art Botanical History Science Zoo or Response Museum Garden Museum Museum Aquarium Totals Acquired more new members in 2009 than in 32.7% 56.3% 45.0% 57.1% 62.5% 46.3% 2008 (18) (9) (9) (8) (25) (63) Acquired fewer new members in 2009 than in 47.3% 25.0% 25.0% 14.3% 20.0% 32.4% 2008 (26) (4) (5) (2) (8) (44) Acquired about the same number of new 20.0% 18.8% 30.0% 28.6% 17.5% 21.3% members in 2009 and 2008 (11) (3) (6) (4) (7) (29) answered question 55 16 20 14 40 136 skipped question 0 4 of 14
- 5. 7. Membership Acquisition. Please select all of the means of acquiring members that your program utilizes. What type of organization does your membership serve? Art Botanical History Science Zoo or Response Museum Garden Museum Museum Aquarium Totals 78.2% 93.8% 65.0% 71.4% 62.5% 73.5% Direct Mail (43) (15) (13) (10) (25) (100) 96.4% 100.0% 90.0% 100.0% 100.0% 97.1% On site membership sales (53) (16) (18) (14) (40) (132) 16.4% 12.5% 10.0% 0.0% 20.0% 14.7% Member Get A Member Campaigns (9) (2) (2) (0) (8) (20) 80.0% 93.8% 70.0% 85.7% 70.0% 76.5% Gift Membership Program (44) (15) (14) (12) (28) (104) 60.0% 81.3% 45.0% 71.4% 60.0% 62.5% Online Membership Campaigns (33) (13) (9) (10) (24) (85) 38.2% 31.3% 25.0% 50.0% 10.0% 28.7% Employee Incentive Campaigns (21) (5) (5) (7) (4) (39) Membership Promotion at Events or 72.7% 62.5% 80.0% 50.0% 50.0% 64.0% Conferences (40) (10) (16) (7) (20) (87) 5 replies 4 replies 2 replies 2 replies 7 replies 14.0% Other (please specify) (9.1%) (25.0%) (10.0%) (14.3%) (17.5%) (19) answered question 55 16 20 14 40 136 skipped question 0 5 of 14
- 6. 8. Please rate each source of Member Acquisition that you used in 2009 and 2008 and indicate if your results were better than last year, less than last year, or about the same. What type of organization does your membership serve? Art Botanical History Science Zoo or Response Museum Garden Museum Museum Aquarium Totals Direct Mail More 24.4% 38.5% 13.3% 55.6% 52.0% Successful (10) (5) (2) (5) (13) About the 41.5% 46.2% 46.7% 44.4% 32.0% Same (17) (6) (7) (4) (8) Less 34.1% 15.4% 40.0% 0.0% 16.0% Successful (14) (2) (6) (0) (4) 41 13 15 9 25 98 On site Sales More 47.9% 60.0% 47.4% 58.3% 59.0% Successful (23) (9) (9) (7) (23) About the 20.8% 33.3% 36.8% 33.3% 23.1% Same (10) (5) (7) (4) (9) Less 31.3% 6.7% 15.8% 8.3% 17.9% Successful (15) (1) (3) (1) (7) 48 15 19 12 39 125 Member Get A Member More 6.7% 0.0% 0.0% 0.0% 25.0% Successful (1) (0) (0) (0) (2) About the 66.7% 66.7% 83.3% 100.0% 50.0% Same (10) (2) (5) (1) (4) Less 26.7% 33.3% 16.7% 0.0% 25.0% Successful (4) (1) (1) (0) (2) 15 3 6 1 8 31 Gift Membership Program More 14.3% 13.3% 7.7% 22.2% 37.0% Successful (6) (2) (1) (2) (10) About the 52.4% 66.7% 46.2% 55.6% 55.6% Same (22) (10) (6) (5) (15) Less 33.3% 20.0% 46.2% 22.2% 7.4% Successful (14) (3) (6) (2) (2) 42 15 13 9 27 98 6 of 14
- 7. Promotion at Events or More 12.5% 18.2% 42.9% 16.7% 15.8% Conferences Successful (5) (2) (6) (1) (3) About the 55.0% 72.7% 42.9% 66.7% 68.4% Same (22) (8) (6) (4) (13) Less 32.5% 9.1% 14.3% 16.7% 15.8% Successful (13) (1) (2) (1) (3) 40 11 14 6 19 85 Other methods More 25.0% 57.1% 36.4% 33.3% 40.0% Successful (6) (4) (4) (2) (6) About the 54.2% 28.6% 54.5% 66.7% 60.0% Same (13) (2) (6) (4) (9) Less 20.8% 14.3% 9.1% 0.0% 0.0% Successful (5) (1) (1) (0) (0) 24 7 11 6 15 56 Comments 4 replies 1 reply 5 replies 0 replies 5 replies 15 answered question 53 16 19 13 39 132 skipped question 4 9. Comparing membership renewal rates in 2009 to those in 2008, would you say that renewal rates.... What type of organization does your membership serve? Art Botanical History Science Zoo or Response Museum Garden Museum Museum Aquarium Totals 30.9% 18.8% 10.0% 42.9% 35.0% 30.1% Improved in 2009 over 2008 (17) (3) (2) (6) (14) (41) 38.2% 37.5% 45.0% 21.4% 22.5% 31.6% Declined in 2009 over 2008 (21) (6) (9) (3) (9) (43) Renewal rates were about the same in 2009 as 30.9% 43.8% 45.0% 35.7% 42.5% 38.2% in 2008 (17) (7) (9) (5) (17) (52) answered question 55 16 20 14 40 136 skipped question 0 7 of 14
- 8. 10. What is your membership renewal rate? What type of organization does your membership serve? Art Botanical History Science Zoo or Response Museum Garden Museum Museum Aquarium Totals 9.1% 12.5% 10.0% 0.0% 0.0% 5.9% Over 80% (5) (2) (2) (0) (0) (8) 7.3% 6.3% 25.0% 7.1% 0.0% 7.4% 75% to 80% (4) (1) (5) (1) (0) (10) 23.6% 12.5% 15.0% 0.0% 10.0% 15.4% 70% to 74% (13) (2) (3) (0) (4) (21) 21.8% 25.0% 15.0% 0.0% 22.5% 19.9% 65% to 69% (12) (4) (3) (0) (9) (27) 12.7% 6.3% 5.0% 14.3% 15.0% 12.5% 60% to 64% (7) (1) (1) (2) (6) (17) 12.7% 12.5% 0.0% 28.6% 12.5% 12.5% 55% to 59% (7) (2) (0) (4) (5) (17) 7.3% 12.5% 0.0% 21.4% 10.0% 9.6% 50% to 54% (4) (2) (0) (3) (4) (13) 1.8% 6.3% 0.0% 0.0% 10.0% 4.4% 45% to 49% (1) (1) (0) (0) (4) (6) 0.0% 0.0% 5.0% 14.3% 7.5% 2.9% 40% to 44% (0) (0) (1) (2) (3) (4) 0.0% 0.0% 0.0% 0.0% 0.0% 0.0% Below 40% (0) (0) (0) (0) (0) (0) 3.6% 6.3% 25.0% 14.3% 12.5% 9.6% Don't know what the Renewal Rate is (2) (1) (5) (2) (5) (13) answered question 55 16 20 14 40 136 skipped question 0 8 of 14
- 9. 11. Please indicate the methods your program utilizes to drive membership renewals... What type of organization does your membership serve? Art Botanical History Science Zoo or Response Museum Garden Museum Museum Aquarium Totals 94.5% 100.0% 90.0% 100.0% 85.0% 92.6% Direct Mail letter packages (52) (16) (18) (14) (34) (126) 16.4% 25.0% 20.0% 28.6% 27.5% 22.1% Direct Mail postcards (9) (4) (4) (4) (11) (30) 65.5% 68.8% 45.0% 57.1% 62.5% 61.8% email (36) (11) (9) (8) (25) (84) 78.2% 81.3% 70.0% 85.7% 82.5% 78.7% on site renewals (43) (13) (14) (12) (33) (107) 60.0% 43.8% 20.0% 28.6% 27.5% 39.0% phone solicitations (33) (7) (4) (4) (11) (53) Other (please specify) 2 replies 1 reply 1 reply 1 reply 4 replies 9 answered question 55 16 20 14 40 136 skipped question 0 12. In 2009, have staffing levels within the membership department... What type of organization does your membership serve? Art Botanical History Science Zoo or Response Museum Garden Museum Museum Aquarium Totals 3.6% 12.5% 10.0% 7.1% 5.0% 5.9% Increased (2) (2) (2) (1) (2) (8) 29.1% 25.0% 20.0% 21.4% 15.0% 22.8% Decreased (16) (4) (4) (3) (6) (31) 67.3% 62.5% 70.0% 71.4% 80.0% 71.3% Stayed the same (37) (10) (14) (10) (32) (97) answered question 55 16 20 14 40 136 skipped question 0 9 of 14
- 10. 13. Please describe your organization's visitation or usage patterns this year. What type of organization does your membership serve? Art Botanical History Science Zoo or Response Museum Garden Museum Museum Aquarium Totals 40.0% 62.5% 40.0% 42.9% 65.0% 50.7% Visitation or usage has increased (22) (10) (8) (6) (26) (69) 32.7% 12.5% 20.0% 21.4% 15.0% 21.3% Visitation or usage has decreased (18) (2) (4) (3) (6) (29) 20.0% 18.8% 25.0% 35.7% 12.5% 19.9% Visitation or usage has stayed the same (11) (3) (5) (5) (5) (27) 7.3% 6.3% 15.0% 0.0% 7.5% 8.1% Do not know about our visitation or usage (4) (1) (3) (0) (3) (11) answered question 55 16 20 14 40 136 skipped question 0 14. In your professional opinion, comparing last year to this year, is the membership climate What type of organization does your membership serve? Art Botanical History Science Zoo or Response Museum Garden Museum Museum Aquarium Totals 25.5% 37.5% 20.0% 42.9% 42.5% 33.1% Improving (14) (6) (4) (6) (17) (45) 49.1% 25.0% 35.0% 35.7% 15.0% 33.8% Deteriorating (27) (4) (7) (5) (6) (46) 25.5% 37.5% 45.0% 21.4% 42.5% 33.1% About the same as always (14) (6) (9) (3) (17) (45) answered question 55 16 20 14 40 136 skipped question 0 10 of 14
- 11. 15. In 2009, were you able to....(check all that apply) What type of organization does your membership serve? Art Botanical History Science Zoo or Response Museum Garden Museum Museum Aquarium Totals Attend membership/association conferences in 3.6% 25.0% 45.0% 21.4% 32.5% 20.6% other cities (2) (4) (9) (3) (13) (28) Attend Membership/association conferences 25.5% 25.0% 45.0% 21.4% 12.5% 24.3% within driving distance (14) (4) (9) (3) (5) (33) 52.7% 75.0% 45.0% 64.3% 55.0% 56.6% Participate in webinars (29) (12) (9) (9) (22) (77) 56.4% 25.0% 35.0% 50.0% 42.5% 45.6% Could not attend conferences (31) (4) (7) (7) (17) (62) 6 replies 1 reply 1 reply 1 reply 2 replies 6.6% Other (please specify) (10.9%) (6.3%) (5.0%) (7.1%) (5.0%) (9) answered question 55 16 20 14 40 136 skipped question 0 11 of 14
- 12. 16. As you look towards 2010, do you anticipate...(check all that apply) What type of organization does your membership serve? Art Botanical History Science Zoo or Response Museum Garden Museum Museum Aquarium Totals Being able to attend membership/association 32.7% 18.8% 50.0% 57.1% 42.5% 36.8% conferences in other cities (18) (3) (10) (8) (17) (50) Being able to attend membersship/association 38.2% 50.0% 50.0% 42.9% 27.5% 38.2% confrences within driving distance (21) (8) (10) (6) (11) (52) 72.7% 81.3% 65.0% 78.6% 72.5% 72.1% Will be able to participate in webinars (40) (13) (13) (11) (29) (98) 34.5% 25.0% 15.0% 21.4% 25.0% 27.2% Will not be able to attend conferences (19) (4) (3) (3) (10) (37) 5 replies 0 replies 3 replies 1 reply 1 reply 5.9% Other (please specify) (9.1%) (0.0%) (15.0%) (7.1%) (2.5%) (8) answered question 55 16 20 14 40 136 skipped question 0 12 of 14
- 13. 17. If you were to participate in webinars related to membership topics, what topics are of greatest interest to you? (Check all that apply) What type of organization does your membership serve? Art Botanical History Science Zoo or Response Museum Garden Museum Museum Aquarium Totals 40.0% 37.5% 40.0% 35.7% 45.0% 39.7% Membership audits and strategic planning (22) (6) (8) (5) (18) (54) 76.4% 87.5% 75.0% 64.3% 57.5% 71.3% Membership acquisition (42) (14) (15) (9) (23) (97) 69.1% 62.5% 70.0% 71.4% 70.0% 69.1% Membership renewals (38) (10) (14) (10) (28) (94) 56.4% 56.3% 60.0% 50.0% 50.0% 52.9% Direct mail campaigns (31) (9) (12) (7) (20) (72) 54.5% 56.3% 60.0% 78.6% 62.5% 58.1% On site membership sales (30) (9) (12) (11) (25) (79) Evaluating membership benefits and dues 74.5% 56.3% 55.0% 71.4% 62.5% 64.7% structures (41) (9) (11) (10) (25) (88) 41.8% 50.0% 45.0% 50.0% 37.5% 41.2% Converting members to donors (23) (8) (9) (7) (15) (56) 74.5% 81.3% 75.0% 64.3% 57.5% 69.1% Membership upgrade campaigns (41) (13) (15) (9) (23) (94) 49.1% 62.5% 25.0% 42.9% 45.0% 46.3% Membership benchmarking and reporting (27) (10) (5) (6) (18) (63) 56.4% 43.8% 70.0% 42.9% 40.0% 49.3% Monthly and online giving programs (31) (7) (14) (6) (16) (67) 27.3% 50.0% 30.0% 21.4% 22.5% 29.4% Budgeting and forecasting (15) (8) (6) (3) (9) (40) Benchmarking and industry standards: how 52.7% 43.8% 25.0% 50.0% 45.0% 46.3% does your program stack up? (29) (7) (5) (7) (18) (63) 36.4% 43.8% 40.0% 7.1% 22.5% 31.6% Annual giving programs (20) (7) (8) (1) (9) (43) 5.5% 0.0% 0.0% 0.0% 5.0% 3.7% Not interested in webinars (3) (0) (0) (0) (2) (5) answered question 55 16 20 14 40 136 13 of 14
- 14. skipped question 0 14 of 14