
Recommended
Recommended
More Related Content
What's hot
What's hot (20)
Viewers also liked
Viewers also liked (17)
Similar to Cost management and performance measurements for petroleum upstream industry part c
Similar to Cost management and performance measurements for petroleum upstream industry part c (20)
More from Hamdy Rashed
More from Hamdy Rashed (9)
Recently uploaded
Recently uploaded (20)
Cost management and performance measurements for petroleum upstream industry part c
- 1. Cost Management and Performance Measurements for Petroleum Upstream Industry – Part C Hamdy Rashed, CMA, CAPM Bsc of Accounting, E-mail: rashed.hamdy@gmail.com, Updated on July 31, 2013 Abstract Cost control and management is not appropriate only for manufacturing and commercial industry; cost management is applied in upstream industry such as Petroleum exploration, development and production cost. Many Petroleum Companies don’t pay more attention to cost control and especially during exploration phase except if Companies face financial dilemma, declining production or if they see they cannot meet their planned schedule of Capital program that lead them to not meet their obligation, commitments and required return, therefore, they start considering cost reduction or control. This paper provide management accountant, cost controller, financial controller, financial manager, internal auditor and cost recovery auditor with brief of cost control, how cost is analyzed and managed and performance is measured in Petroleum upstream industry in accounting view and in conduction with technical information. The technical information that is covered in this paper is useful for accountant and non-technical staff who is interested. We don’t criticize or indicate fishing period that is stated in Standard Handbook of Petroleum and Natural Gas Engineering is wrong but we cover and adjust the fishing period formula and add new fishing period formulas in management accounting view only. Keywords: Cost Management and analysis for petroleum exploration, Optimizing production, exploration and development programs, Project Cost Management and Analysis for Petroleum Upstream Industry, Procurement Cost Management, Drilling Cost Management, Production Cost Management, G&A Cost reduction. This paper covers the cost management and decision analysis for petroleum industry in cost and management accounting and in conduction of technical information that could be changed based on technical parameters and analysis. We recommend Management accountant and financial or accounting internal auditor to work in cooperation or in consultation of technical auditors or advisor because the technical information can easily create confusion or misunderstanding, or misapplying the cost management and performance analysis concepts. We start numbering our heading by 9 to be in consequent of the previous paper. 9) Cost management by nature The below formulas are basic formulas for calculating, drilling costs per day, cementing costs services, mud services, casing and wellheads costs and production costs. Those formula are very easy to understand by non- technical professional, however, complex calculation for cementing, mudlogging, drilling fluids and others are not easy to be done by hand
- 2. Cost Management and analysis for performance evaluation Hamdy Rashed; CMA, CAPM 2 of non-technical professional due to complexity that need technical staff to use specialized program to solve the problems. Those basic formulas can help management accountant, cost controller who are not engineer to understand the variables of drilling and production costs in Petroleum upstream industry. 9.1) Drilling Cost To know how to control and manage drilling costs, we need to know the main cost drivers of drilling costs. The Below formula can help us to compute drilling costs which are effected by variables that could be controlled and managed: Drilling Cost = (Bit Cost + Rig Cost x (Drilling Time + Trip Time)) ÷ (Length Drilled) Drilling Cost => drilling cost $ per length unit ($/ft, $/m) Bit Cost => bit cost, $ Rig Cost => rig cost per hour, $ / hour, cost of hiring rig may represents 25% of total drilling costs. Rig rate is time- based drilling cost Drilling Time => total drilling time, hour Trip Time => trip time taken to change bit, hour Length Drilled => total length drilled by drill bit, ft or m Using inappropriate bit and drilling fluids or mud during drilling, may lead to reducing the penetration rate, increasing drilling problems ,expanding drilling length time and increasing the total costs. However, using heavier bit weight in harder formation, increase rotary speed, and using light mud weight are good alternatives to increase the penetration rate and reducing the drilling costs, problems may be occurred during the drilling such as failing to lift rock cuttings to surface and results stuck pipe or fails to keep high-pressure formation under control that results in gas kicks or blowout. The above formula is the preliminary calculation of drilling cost. However, there many factors that could indirectly participate in cost reduction. There are many other drilling costs that may has significant relative amounts specially if there is drilling problems such as stuck pipe and lost circulation problems. Also, there are other costs that are not covered by above formula that are related to the following activities and materials. a) Cementing and fluids materials b) Cementing and drilling fluids Engineers c) Casing and tubing d) Testing and logging e) Completion cost Petroleum Company shall perform cost analysis and determine, categorized the causes of increasing costs objectively and find out the appropriate resolutions to reduce such costs. For example, if the higher costs is due to human errors, Company may need to train current staff or find replacing current technical staff with higher experienced skilled staff. And if they are refer to inefficient and effective contractor, Company may updating evaluation criteria to stop dealing with such Contractor. 9.2) Petroleum Services Petroleum services may represents about 20% of total well costs, Petroleum services cover, mud, cementing, mud and testing. Cementing and Mud, logging is depth-based drilling costs. 9.2.1) Cementing Cementing is used during drilling operations to support casing and stop moving fluid outside the casing, and to protect casing from corrosion. To determine the required total sacks of lead or trail cements, we need to know how many sacks are required in annulus and in casing or yield quantities of lead cement. Number of sacks of lead cement required = Feet to be cemented * annular capacity ft3 /ft * excess ÷ yield ft3 /sk lead cement.
- 3. Cost Management and analysis for performance evaluation Hamdy Rashed; CMA, CAPM 3 Number of sacks of Trail cement required = Sacks required in annulus + sacks required in casing. Sacks required in annulus = ft to be cemented * annular capacity ft3 /ft * excess ÷ yield, ft3 /sk Tail cement Sacks required casing = no. of feet between float collar & shoe * casing capacity ft3 /ft ÷ yield ft3 /sk Tail cement Casing Capacity, bbl = Casing capacity, bbl/ft * feet of casing to float collar. Cements are should be used with slurry and other additives. The additives should be added in specific percentages to enable the cements to be binded fast. The more lost circulation is, the faster binding particles is needed for cementing materials. Per the above formula the volume in casing is measured in sacks and additives can be measured in bbl, where 1 bbl equal 42 US gallon. Company can estimate the cost of cementing and additives costs by multiplying the quantities in sack, bbl or gallon by unit price. 9.2.2) Volume of Mud To determine the volume of mud to fill up the inner of the cylindrical objects, it can be computed by the following equation. Inner Volume, bbl = Inner Capacity, bbl/ft x Length, ft Drilling Engineer can compute the volume of mud, cementing any many drilling costs that is supposed to be occurred in specific well based on the several well information that is obtained from contractors and company’s representative in the field. The project cost system should segregate the duties between the Company’s representative in the field site and drilling engineer in the office to verify the information that is obtained from Company’s representative in the field site to drilling logs readings. Project Cost System or Cost accounting System need to be designed to ensure the existence, accuracy and completeness of vendor’s billings with the technical information and Report any exceptions noted to be adjusted or solved manually for flexibility characteristic of the system. 9.2.3) Well planning, Site Construction/Civil Works and Rig Move . Mobilization/Demobilization, Rig move, site construction and well planning represents about 10% of total well costs and they are considered as fixed costs regardless the depth of well or days lasts for drilling. But they are varied from well to another except for mobilization and demobilization they are fixed in total but they can be varied in average based on the number of wells that are drilled. Rig move is fixed in total and average regardless the number of wells drilled. For well planning, the Company can reduce drilling costs by appropriately design well plan and considering the mistakes that were made in the past to predict the future. Also, Company should properly determine the proper labor needs of skill and experience. Well Planning costs might be high if the Company prepare well study for new basin that it does not have adequate technical information but when the Company purchase several data, make and process seismic, consider the information of previous wells drilled, the well planning does
- 4. Cost Management and analysis for performance evaluation Hamdy Rashed; CMA, CAPM 4 not take time to be completed and get more accurate information. Civil work costs can be high if the Company does not plan for it feasibly, oil companies may spend a lot of money for asset protection and civil works that are unnecessary and inappropriate ways e.g. pay much money in cash to local community people that can be questionable for type of fraud or illegal acts. Also, such practice of paying cash money to local community people make the Company to carry high costs, and this cash money can be misused by local community people which threatens the interests of Company and host government instead of obtaining benefit. The more civilian activities (e.g. building school, clinic, drilling water well, and others) that are performed by Company, the more benefit the Company will take from local community by reducing the future community affairs and security costs in long-term. However, Site construction costs can be high too based on the ecological features of the location, Company can reduce the site construction costs by awarding the contracts to the best vendor and by transparent tender invitation and by eliminating the duplicated or unnecessary civil activities but locating one civil camp in near all the sites to serve all wells and the entire property efficiently. 9.2.4) Testing and Long-term Production Tests Testing costs can be the major part of well costs. And the well test is made by well logs and drill stem test that will be explained below in brief. Litholigical Log is sampling and coring test that helps engineer to lists the depth by geological rocks and describe the rock to note the rock textures, color, grain size, cementation, porosity, microfossil. The source of such information is from samples of rock cuttings that are flow out to the surface during the drilling Mud Log is chemical analysis of drilling mud and well cuttings that determine the rocks which bear oil or gas. The abnormal expected information in this log is called “show” Wireline Well Logs are a readings obtain either during drilling well or after drilling well but after cleaning well by circulating drilling mud and pulling drilling equipment. For knowing the main purpose or advantages of such logs. Please see the below table. In drill stem test (DST), drillstring of perforated drillpipe which can be less than 5” run into the target formation in the well. Two packers are installed between the upper and lower level of probable productive formation to enable the oil gas to flow into the well and if the oil or gas is adequate to be flowed up to surface the pressure gauge and valves measure the flow. The valve is opened and closed on several times to record the pressure and to calculate the formation permeability and reservoir pressure. The longer test is, the more accurate information is and more costs occurred. The hydrocarbons that are located in porous formation can be tested within 30 days and get accurate information of gas or oil but for the hydrocarbons that located in the fractures of basements take more than 30 days and might be reach to two years for adequate testing. In this case the testing is called Long- term production testing. The questions are whose is the title of production tests? And how the costs and revenue of long-term production testing is accounted for? The title of the production tests is depend on the host government and PSCs. If the PSCs or host government’s regulations gives the Company right to share the specific percentage of long- term production tests. The revenue of sold production testing petroleum should be offset against development costs in accordance IAS 16.17.e. For entering long-term production
- 5. Cost Management and analysis for performance evaluation Hamdy Rashed; CMA, CAPM 5 testing phase, Company should determine the costs and benefits of taking such decision and ensure that the revenue from production test will exceed the incremental costs of obtaining such decision. Development and drilling department and exploration program manager needs to reduce testing costs to the minimum level. Drilling manager needs to not request tests in formation that does not show good show during mud log or in formation location which hydrocarbon may be migrated from since very long time ago. Also, Drilling manager should not request different well logs that gives almost the same results, or asking for running a well log that its result might not be used or considered. Not merely, Drilling or exploration manager should not request equipment for specific well log and using different log which lead company to pay standby rate of unnecessary well log or the formation or type of drilling may not need such type of logging. And extending the period of tests for less potential formation can lead to increase unnecessary costs too. All the above points need to be considered and the drilling manager or exploration manager should think and plan appropriately before determining the well log, period of test and target formation that will be tested. Also, Engineers should to detect their seismic processing mistakes and interpreting the seismic processing based on their readings of well logs and revise their seismic mapping based on the well logs and to have more comprehensive and deep knowledge of the geological formations in basin to reduce the probability of dry wells and reduce the costs, or reduce the probability of facing lost circulation or stuck pipe during the next drilling wells 9.3) Management and Supervision Studies, drilling management and supervision may represents about 5% of total well costs but such costs could be more than 10% for less efficient supervision and management if the company does not have effective performance measurements method. 9.4) Casing, tubing & Wellhead Wells costs contains the cost of wellhead, casing and tubing and several accessories costs. Casing costs is determined based on the following formula. Casing/tubing cost = cost per meter * meter of casing/tubing required for drilling well. The technical engineers should determine the depth that needs to be cased in their well plan and based on their understanding and experience of the formations. Procurement management shall buy casing and wellheads via tender process, obtain the supplier that can provide good price and good characteristics of materials and with good terms delivery and payment and in good time. The procurement management should procure the suitable quantities of casing, tubing and wellhead based on drilling plans and should consider variance between plan and actual. Drilling and exploration manager should know preparing plan on early time enable procurement department to contract with third party to provide the casing, tubing and wellhead on proper time before drilling start. Procurement department and exploration management should not exaggerate in purchasing bulk of casing, tubing and wellhead for not facing rigid capital due to surplus in drilling materials and selling those equipments and materials at price less than original costs later on. Also, Drilling and exploration management should coordinate with higher management and treasury department for availability of funds, because unrealistic drilling plan can cause huge of unnecessary purchases.
- 6. Cost Management and analysis for performance evaluation Hamdy Rashed; CMA, CAPM 6 Casing Hanger, Oil and gas companies could use casing hanger to assemble to different sizes of casing lines instead of running casing from the surface to the bottom hole and to reduce the costs but casing hanger might be used or not depend on the drilling method, characteristics of rocks of formation and experience of engineers. 9.5) Drilling Problem 8.5.1) Lost Circulation and Kick Drilling problem can increase the well costs rapidly within days or weeks. It can exceed the actual drilling costs if there is lack of knowledge and experience among technical management. Lost Circulation is a reduction or absence of fluid flow up the annulus when it is travelled through drillstring. Lost circulation consume time and costs without drilling the well that is either due to mechanical malfunction of formation or lack of experience and knowledge of personnel. Losses divided into two categories. 1) Minor Loss which it is less than 500 barrels (80m3) or can be controlled within two days by increasing viscosity of fluid such as Bentonite or Polymers with additives 2) Severe loss that is more than 500 barrels (80m3) or takes more than two days to be controlled. And this type may lead the Company to stop drilling the well and try to move few kilometers to drill near the first well. The main causes of lost circulation are as follow: There are several causes of kick (Wellbore Influx) that can be listed below 1- Lack of Knowledge and Experience of personnel who has no ideas what can causes well control problem e.g. personnel may pump lighter fluid into wellbore which reserves pressure may overcome hydrostatic pressure. 2- Light density fluid in wellbore a. Light pills, sweep, spacer in hole b. Gas cut mud 3- High abnormal Pressure of zone that is over current mud weight in the well can cause kick. 4- Unable to keep the hole full all the time while drilling and tripping. 9.5.2) Stuck Pipe Stuck pipe is more common problem in Oil and Gas Industry that causes serious drilling problems and cost Company by loss of drillstring and complete loss of well and can be caused by mechanical malfunction or lack of
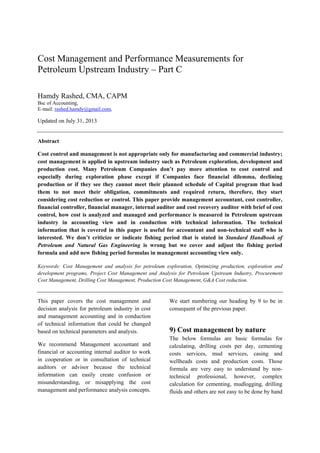
- 7. Cost Management and analysis for performance evaluation Hamdy Rashed; CMA, CAPM 7 knowledge and experience of personnel. The causes of stuck pipe that we can stated them are: 1) Mechnical sticking that is caused by physical obstructed or restriction such as a. Settled Cuttings b. Cementing sticking or Junk in the hole c. Mobile formation d. Casing failures e. Hole packoff and bridges 2) Differential sticking that is caused by differential pressure forces from overbalanced mud column acting on drillstring against filter cake deposited on permeable formation, such as a. High overbalance pressure b. Thick Filter cake c. High-solids or density of muds Those causes of stuck pipe has warning signals and preventive actions which the Drilling Department should be aware of them. 9.5.3) Fishing Junk or stuck pipe The consequent of stuck pipe and stuck junk can cost the company a lot. The costs of consequent of stuck pipe and junk may include the costs of unproductive drilling time during fishing and fishing costs, close well, sidetrack or restart well. The number of days that allows for fishing before taking decision to sidetrack drilling/ restarting the well or milling of junk tools. Number of days = Where: Cs: is the estimated cost of drilling sidetrack, milling of junk tool or restart well R: is the replacement value of fished equipment F: is the cost per day of fishing equipments and services Cd: is the cost per day of drilling rig The formula has been taken from the below reference (Standard Handbook of Petroleum and Natural Gas Engineering. By William C. Lyons, Ph.D., P.E., Gary J Plisga, BS. 2005. Elsevier Inc. UK. Page 4-378) but it has been revised by us by subtracting the replacement value of fished equipments from the estimated costs of drilling sidetrack, milling of junk tool or restart well. Our revision in the formula does not indicate that the formula was not correct, but as per our analysis in the below Figure 1: Fishing Cost shows the replacement value needs to be subtracted to get the costs of fishing that equal to the costs of sidetracking. If we add the replacement costs of fished equipment the number of days will exceed the feasible period of fishing. Also, the above formula can calculate the maximum period of fishing that management must not exceeds because the cost of fishing will equal the costs of the alternative decision of sidetrack. If the management decide to continue fishing after the maximum period, it will give very strong indication of the poor financial knowledge of management, more optimistic decision than it should be or will draw forensic accountant’s attention to something wrong. In addition to the above formula, we like to add the financial formula that compute the maximum, minimum and optimal number of days for fishing. We assumed that initial costs of fishing and sidetracking can be determined, and daily costs of alternative decision can be determined too. The minimum number of days for fishing Minimum number of days = ∆ ∆ Where:
- 8. Cost Management and analysis for performance evaluation Hamdy Rashed; CMA, CAPM 8 ∆ Initial costs is incremental costs for sidetrack, start well or milling of junk tool e.g. cementing and cementing plugin costs and replacement value of fishing equipment ∆ Daily Costs is the incremental daily costs for side track, start well or milling of tools. The minimum period of fishing enable technical management to take the decision when the cumulative daily fishing costs exceeds the expected cumulative daily sidetracking costs. As long as the marginal costs of fishing is less than marginal costs of sidetracking, the fishing decision is in the safe margin and fishing process is still valid and management hope to get the junk out to save costs that could be occurred by sidetrack activity. This period is very pessimistic. Period of fishing can be optimum if the management consider the cost of risk that could be carried. Means, management will accept specific amount of cumulative marginal fishing that exceeds the expected cumulative sidetrack costs or to be in compliance with fishing budget that management should not exceed it. The optimal number of days for fishing Optimum period of fishing = Or ∆ ∆ Where: RT is the risk tolerance or the positive cumulative marginal costs between fishing and sidetracking/restart well costs The reasons of junk or stuck pipe has been briefly discussed previously under stuck pipe and due to careless during drilling operations and other reasons that drilling engineer can take preventive action before it happens. 9.6) Facility Cost Facility cost includes tanks, storage, treaters, heater, meter run, separators, flow-line pipes, Vapor recovery, circulating pump, Injection pump. All those items have specifications and capacity. The procurement department and development management can manage costs by reducing the procurement costs via good negotiation and not trapping themselves unknowingly with unnecessary specifications. For example, Company should consider the capacity of the well, initial formation pressure and formation pressure decline over period of time, the power that is supplied by electrical motor to select the appropriate centrifugal pumps because the capacity of Horizontal Centrifugal End Suction Pumps is wide range from about 2100 barrels per day to 100,000 barrels per day and it is not logically to select pump that can produce 50,000 bpd for well that its maximum production is 3000 bpd. Not merely, even the specification of heating and treating equipments and piplelines should be properly determined. Even purchasing vehicle hires and building camps, Company should consider the requirement of the production sharing contracts and applicable laws that may require to buy such materials for building camps from local market. Procurement department and development manager should consider the price and specification of materials that can be obtained from local market and international market. Many Oil and gas Companies may prefer to buy from international market with very high costs of such materials and equipments that can exceed three times of local price and with few difference in quality which can be tolerated. Not merely, Company should take care of buying any equipments and materials that might not be used. However, Company might find itself compelled to hire vehicle from locals for mitigating security risks or hire unnecessary
- 9. Cost Management and analysis for performance evaluation Hamdy Rashed; CMA, CAPM 9 building or vehicle at high price specially in the countries that has high Corruption Perceptions Index (CPI) that is published by Transparency International (TI). In this case, Company management should consider their country’s anti-corruption law and not try to violate terms of FCPA, criminal code or any anti-corruption regulations. Also, it should consult legal advisor for any suspicious transactions. 9.7) Overhead and Joint Cost Overhead and common costs are a disputed expense item and draws attention of joint venture and cost recovery auditors. 9.7.1) Facility Cost Often support equipment and facilities equipments are not tied to one single field or license. If they support one field or license, the costs of such equipments will be directly charged to the license costs, but in practice such equipments can serve several fields such as oil plants, pipelines, vehicles and in country offices. Paragraph 26 and 36 of SFAS 19 are specifically addressed the depreciation of support equipment and facilities that are not tied to a particular field. As we indicate above, the support equipment and facilities that support production operations frequently serve more than one cost center or multiple activities or multiple licenses that are owned by different partners often results disputes in charging such costs to the cost center or license that are in tied to the same equipment and facilities. Therefore, Such costs and the costs that are associated in operating facilities equipments should be allocated to several cost category, multiple license based on the appropriate and fair allocation method of fee base. We will discuss few of such support equipments and facilities as below. - For example, well testing equipment and rig may be used on one location that is in the exploration phase and also on another location that is in the development phase. In these situations, the equipment or rig is being used in both exploration and development activities. And fee base should be used that include the depreciation cost of rig or testing equipments, idle costs of such equipment, and associated direct costs and overhead to compute the daily fee or rental in condition of not including any elements of profit. - The pipelines can serve multiple licenses that each are owned by different partners, the costs of usage of pipelines are allocated to appropriate license based on fee base that is organized by Facility Agreements. - truck, for example, is being used for multiple activities and in multiple cost centers, The depreciation of vehicle should be allocated based on kilometers driven or some other method. The depreciation and operating costs would then be allocated to the activities being served in the different cost centers. The portion allocated to production activities would be written off as operating expense. The portion allocated to development costs would be ultimately capitalized to the wells and related equipment and facilities accounts in each cost center that the support equipment serves. That cost would then be amortized along with the other capitalized costs for the cost center using the unit-of-production method. The portion allocated to the exploration would either be expensed as G&G expense or capitalized to drilling-in- progress. The drilling in-progress accounts would subsequently be cleared to dry hole expense if the associated well is dry hole expense if the associated well is dry, or
- 10. Cost Management and analysis for performance evaluation Hamdy Rashed; CMA, CAPM 10 wells and related equipment and facilities if the associated well is successful. Theoretically, the portion of depreciation relating to the support equipment and facilities and the operating cost of the support equipment and facilities should be allocated to exploration and appraisal, development or production as appropriate given usage of the support equipment and facilities or production as appropriate given the usage of the support equipment and facilities 9.7.2) Field or Host country office costs Field or host country office that supports operations covering a large area serves multiple licenses and activities of operations, exploration development. Since some of the costs attributed to each of these activities or phases may be capitalized while other costs are expenses, it is necessary to allocate a portion of offices costs to the particular activities being served. This treatment is also required in many operations governed by Production Sharing Contracts (PSCs) and Joint Operating Contracts (JOCs) where the licenses needs to be charged by the cost of such offices equally or using appropriate General and Administrative allocation. It is appropriate to group the same office activities into cost pool then allocate the costs pools to multiple licenses or activities based on level of appropriate usage method. 9.7.4) Joint costs Joint products or by-products in petroleum upstream Industry are, crude oil, natural gas and condensate. The criteria that differentiates the joint product and by-product are ; - The value sales to the total sales of all products or profit of specific product to total profit. The sales value or profit of joint product represents at least 10% of total sales or total profits of all products which is presented in the financial statements as business segment (IFRS 8), whereas, the by-product’s represents less than 10% - The business and marketing purpose. Company does not intend to produce and generate profit the by-product as the same as main product and by-product are produced in very limited quantity. How to allocate joint costs to several petroleum upstream products? Allocating the joint costs is necessary to compute the cost petroleum, tax and sharing profit petroleum and it is useful for determining the cost of sales by product segment. There are many allocation method for allocating the joint costs between crude oil, natural gas and condensate, and we can list and explain them in brief as follow: 1- Allocation based on physical measure. After unifying the physical measure of different commodity (crude oil and gas) either to convert oil to cf or convert cf to equivalent oil barrel, and the net realizable value of products are most likely to be the same. 2- Allocation based on Sales Value/net realizable value at split-off point, is computing by deducting the separable costs from sales value The accounting that is used for by-product depends on ‐ There is market for by-product ‐ The by-product can be used as an energy source ‐ The by product can be used for reinjection The accounting treatment of by-product can be either of the following:
- 11. Cost Management and analysis for performance evaluation Hamdy Rashed; CMA, CAPM 11 1- Income generated from by-product is reported as “Other Income” 2- Income generated from by-product is credited the joint costs. If the by-product is used internally as energy source or for reinjection to produce main product, it needs to be valued at net realizable value of replacement cost at split-off point and the joint costs of main product can be reduced by the value of by-product. 9.7.3) Corporate overhead Corporate personnel and equipments support multiple licenses and the costs should be allocated fairly among the licenses. Corporate overhead may not wholly be recovered from cost oil, Most of international PSCs allow the contractor to recover part of it only. Also, international JOCs allow operator to recover part of its corporate overhead. But how the Corporate overhead is allocated between license. Some Companies may prefer to allocate it equally or based on profit, sales or total costs of each license such allocation it is not fair enough but it might be accepted by PSC or JOC in condition of not exceeding the allowed amount. The each costs pool may require different allocation base. The below Table shows the cost pool and allocation base as follow: Table: Examples of Cost Pool and allocation Base Cost Pool/Dept Allocation Sequence Allocation Base Payroll Costs Level 2 Hours spent or amount of salaries Purchase Dept Level 2 Number of Shipments or amount of purchases Accounts Payable Dept Level 2 Number of Invoices paid to license payables Accounts Receivables Dept Level 2 Number of invoices raised for license customers General Ledger Dept Level 2 Number of Transactions line HR Dept Level 2 Number of employees Cost Pool/Dept Allocation Sequence Allocation Base Admin Dept Level 2 Number of orders Internal Audit Dept Level 2 Time spent for each assignment of each license Fixed Assets assigned for each dept Level 1 Depreciation is charged to department based on assets assigned to dept Rent Level 1 Rent is charged to department based on square meter Maintenance and repairs in office Level 1 Maintenance and repairs is charged to department based on square meter Electricity Level 1 Electricity is charged to Dept based on total watt of equipments of each dept 10) Cost Analysis for Petroleum decisions Not all costs and revenue are useful in Cost analysis for petroleum decisions, only relevant costs and revenue that should be considered in petroleum decision analysis. The Petroleum decision has the following steps 1- Gather all costs and revenue of each alternative 2- Take the sunk costs or revenue off (Sunk costs are the past or historical costs) 3- Select the best alternative that maximize the revenue and profit or minimize the costs 10.1) Buy against Lease (Cars, rig, building) For selecting the best decision of buy or lease vehicle, rig, equipments, materials or building, the present value of both alternative of buy and lease should be computed, and select the lowest present value of alternative costs.
- 12. Cost Management and analysis for performance evaluation Hamdy Rashed; CMA, CAPM 12 10.2) Further Processing (Natural gas or LNG) or (selling from wellhead or export port) The company that may take a decision for further processing or selling from wellhead or export port needs to compute the preliminary incremental earnings of further processing and get the preliminary approval for making investment analysis. A company may need to make decision analysis for process natural gas to produce Liquefied Natural Gas (LNG) that is more marketable and profitable than selling natural gas. To prepare the decision analysis for such case, Company needs to do the following steps 1- Compute the sales value and costs at split-off of natural gas 2- Compute the sales and costs of further processing for LNG 3- Compute the incremental revenue and costs by obtaining the difference of step 1 and 2 above 4- Obtain the incremental earnings by subtracting the incremental costs from incremental revenue. If the incremental revenue is greater than incremental costs, the further processing is preliminary feasible. If not, the Company should not take a decision of further processing. We intend to say preliminary feasible because Company still needs to prepare more detailed feasible study and investment analysis for further processing to get the expected net present value of further processing. 10.3) Selling below Normal or International Market Price If Company likes to sign sell and purchase agreement for natural sources that is under the normal market price or sell commodity at significant discount and idle capacity of assets exists, Company needs to compare the contribution margin for the special order, if the contribution margin is positive after providing the lower price or significant discount because it is still increase Company’s profitability and vice versa. If there is no idle capacity, it is not prefer to sell the commodity at lower price than market price. 10.4) Acquiring or Relinquishing Acreage For acquiring new license or not or relinquishing existent license or not depends on investment analysis for petroleum exploration that is covered by our paper. The Company should select the license that has higher expected monetary value and continue maintaining the license as long as the contribution margin exceed the direct fixed costs of license even if it is less than total fixed costs (direct fixed costs + allocated fixed costs). If the direct fixed costs exceeds the contribution margin, relinquishing license will be necessary if there is no potential profit in the license. 10.5) Determine the maximum costs of running seismic acquisition. Determining how much the maximum amount of seismic acquisition that Company should pay depends on computing the expected value of perfect information (EVOPI). The expected value of perfect information is obtained by subtracting the maximum amount of expected monetary value of alternative strategies from the expected payoff with perfect information that equal maximum amount of expected monetary value of successful strategies. The Seismic acquisition, processing and interpretation costs may equal the expected value of perfect information and +/-10% in most likely cases. 10.6) Drilling or not For taking decisions to drill or not, Company should take the probability of different cases as follow: Dry hole as probability of lose and different probabilities of success for different oil or gas commodity and different size of reserves, small, medium and large. And each case has
- 13. Cost Management and analysis for performance evaluation Hamdy Rashed; CMA, CAPM 13 present value and should be multiplied by the probability to obtain the expected monetary value of each scenario than summing all the results to get the expected monetary value (EMV) of drilling a well. The higher EMV of planned well, is the well that will be drilled first and the less EMV will not be drilled. 10.7) Optimizing Production Production optimization in petroleum upstream industry is more appropriate to be analyzed by petroleum production engineers because it uses complicated technical formula of optimizing the production and equipments which some of them are mentioned in the below link http://www.elsevierdirect.com/v2/companion.jsp ?ISBN=9780750682701 But the production optimization concepts are the same in any industry and we can cover it in accounting or economical view. The production is optimized by the following method - Liner programming and decision rule can be used as optimization technique - Theory of Constraint is one of the most famous and common technique, it focuses on the following steps 1- Identify production process system constraint 2- Decide how to use the constraints by getting the most out of the constraint 3- Subordinate everything else to the decision taken in step 2 above by aligning whole system to support decision made above. 4- Elevate system’s constraint by making significant changes needed to increase the capacity of constraint. 5- If a constraint is broken, engineer should go to step 1 but should not allow to cause new constraint. Constraints that we mentioned above are anything prevent the production process system from achieving the goals or from obtaining the optimum point of production. Constraints can be either internal or external to the system; a. Internal constraints are categorizes as follow: i. Limits of equipments, hours and ability to produce ii. Limits of people in skills, experience, hours iii. Written or unwritten policy that prevent to get more production b. External constraints when the system can produce more than the market demand. And when there is legislation or contractual terms that limit production. 10.8) Support Facilities Utilization and Throughput accounting In the presence of the constraints, Company can maximize the profit by obtaining highest or increasing the contribution margin per unit of constraints measurement. Company should focus on commodity that its contribution margin per constraint measurement unit is higher than other. We can use the throughput ratio instead of contribution margin. Throughput is calculated as the following formula: Throughput = (Sales – Direct Materials cost) Throughput accounting ration = Return per constraint measurement unit ÷ Cost per constraint measurement unit. To optimize the production company should seek to increase the throughput, decrease the investment and reduce operating expense, and then consequently the net profit, return on investment and productivity will be increased. Net profit = Throughput – operating expense Return on investment = net profit / investment Productivity = Throughput / operating expense
- 14. Cost Management and analysis for performance evaluation Hamdy Rashed; CMA, CAPM 14 Table 2: Drilling practices and Cost effect and management Drilling Techniques Characteristics of drilling tools Penetration rate Formation Total Cost trend Potential Risks Select Proper bit HTC Low Increase PDC High Decrease Heavy weight High Hardstone Decrease Light weight Low Sandstone Increase Rotary speed High with heavy bit High Hardstone Decrease Poor Hole Cleanings and stuck pipe Tooling wears out faster Slow with light bit Low Sandstone Increase Will not hurt except if the in case of very small drill bits that very slower than recommended RPM that will be difficult to know the resistance from formation and very difficult to penetrate it. Mud Heavy weight Low Pressure in Borehole is greater than the pressure onto the bottom. Increase Fails to lift rock cuttings to surface, resulting stuck pipe Excessive high mud pressure can factures the formation and cause lost circulation or kill the well Light weight High Pressure in Borehole is less than the pressure onto the bottom. Decrease Fails to lift rock cuttings to surface, resulting stuck pipe Fails to keep high-pressure formations under controls and results in gas kicks or blowouts Viscosity High Low Increase - Fluid which is too viscous will wear out the mud pump Low High Decrease
- 15. Cost Management and analysis for performance evaluation Hamdy Rashed; CMA, CAPM 15 Drilling Techniques Characteristics of drilling tools Penetration rate Formation Total Cost trend Potential Risks - If the mud is very less viscous, cuttings will not be brought to the surface and the stuck pipe can be caused in the borehole Trip time Short N/A N/A Decrease Increase safety risk but this risk could be at the minimum acceptable level if it is done with trained, high experienced and efficient team. Long N/A N/A Increase Increase Non-productive time Table 3: Drilling Problems, risks, causes, signs, results and preventive control Drilling Problem Causes Results Signs/Indicators Prevention Remedial Practices Lost Circulation - High Formation Permeability - Low Formation Pore Pressure - Poor Drilling Fluid Characteristics - Costly Mud usage - Loss of Production - Unproductive drill time - Flow out < Flow in - Drop in mud Return Rate - Drop in Mud Pit Volume -Crew Education -Good Mud Program -Study Wells in Area -Decrease Mud Weight -Use Lost Circulation Material as Mud Additive Stuck Pipe -Cave -Keyseat - Crooked Hole -Differential Pressure Sticking -Filter Cake -Fishing Operations -Loss of Hole -Cannot Pick Up Pipe -Use Minimum Mud Weight Required to Control Formation Pressures. -Use Special Drill Collars -Use Centralizers on -Erode Mud Filter Cake - at High Fluid Velocity (speed up pumps) -Spot Special Fluid; Oil, Acid -Reduce Mud Weight as Far as Possible
- 16. Cost Management and analysis for performance evaluation Hamdy Rashed; CMA, CAPM 16 Drilling Problem Causes Results Signs/Indicators Prevention Remedial Practices Casing -Rotate Pipe - Keep Moving Pipe -Cut Pipe or Unscrew Joint- and Fish Junk-In -Negligence of Crew -Fishing Operation -Crew Education -Run Junk Basket - Run Basket with Collapsible Teeth - Run Magnet Blow out -Loss of Hydrostatic Head due to Lost Circulation -Poor drilling Fluid -Swabbing Effect while Pulling Drillpipe -Insufficient Mud Weight -Possible Loss of Life and Property -Legal and Financial Problems -Returns to Surface after Circulation is Stopped (KICK!) -Well Out of Control - Big Problem -Lost Circulation - If on Bottom: -Use proper Mud Weight -Add Lost Circulation Materials - In Extreme Case of Blowout: -May Have to Directionally Drill a Relief Well -Crew Education - Be Alert -Blowout Control Equipment on RIG including Pit Volume Indicators Crooked Hole -Too much Weight on Bit -Dipping Formation -Anisotropic Formation -Too Small Drill Collars -No Stabilizers -Uneven Spacing (on bottom) -Legal Problems -Production Problems -Cementing Problems -Periodic Directional Surveys -Stuck Drill String -Casing Problems -Avoid Buckling of Drill Pipe by using sufficient number of drill collars -Use “Oversize” Drill Collars -Use Reamers and Stabilizers -Start the Hole Vertically -Plug Back and Sidetrack -Use Whipstock -Use Reamers in 3 Locations Table 4: Types of Test logging and purposes
- 17. Cost Management and analysis for performance evaluation Hamdy Rashed; CMA, CAPM 17 Test and Logging Purposes/Advantage Electrical & Induction Log 1- Determine elevation of formations 2- Identify pore fluid Gamma Ray Log 1- Measure natural radioactivity 2- Identify potential reservoir rocks 3- Correlate formations 4- Determine elevation of formations 5- Determine shale content of rock Neutron Porosity Log 1- Determine formation porosity Formation Density or Gamma-Gamma Log 1- Determine formation density and porosity Sonic or Acoustic Log 1- Determine sound velocity 2- Calculate porosity 3- Determine Lithology Caliper Log 1- Measure diameter of wellbore 2- Calculate wellbore volume Figure 1: Fishing Cost Analysis
- 18. Cost Management and analysis for performance evaluation Hamdy Rashed; CMA, CAPM 18 References ‐ The Purchasing and Supply Manager’s Guide to the C.P.M Exam, Fred Sollish and John Semanik, Publisher: Neil Edde, 2005. ‐ Basic Drilling Technology, Developed by WCS-Well Control School, 1998 ‐ Drilling Formula. Available at Website: http://www.drillingformulas.com/ ‐ Definition and characteristics of Lost Circulation is available at the Website:http://en.wikipedia.org/wiki/Lost_circul ation ‐ Website: http://www.elsevierdirect.com/v2/companion .jsp?ISBN=9780750682701 ‐ Standard Handbook of Petroleum and Natural Gas Engineering. By William C. Lyons, Ph.D., P.E., Gary J Plisga, BS. 2005. Elsevier Inc. UK