Flexible packaging factsheet
•
2 j'aime•1,418 vues

Factsheet with basic information about Flexible packaging industry in Vietnam

Recommandé
Contenu connexe
Tendances
Tendances (20)
Similaire à Flexible packaging factsheet
Similaire à Flexible packaging factsheet (20)
Plus de Hieu Nguyen
Plus de Hieu Nguyen (12)
Dernier
Dernier (20)
Flexible packaging factsheet
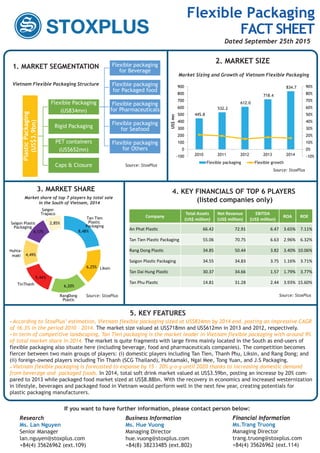
- 1. 5. KEY FEATURES 2. MARKET SIZE 1. MARKET SEGMENTATION Source: StoxPlus Source: StoxPlus PlasticPackaging (US$3.9bn) Flexible Packaging (US834mn) Flexible packaging for Beverage Flexible packaging for Packaged food Flexible packaging for Pharmaceuticals Flexible packaging for Seafood Flexible packaging for Others Rigid Packaging PET containers (US$652mn) Caps & Closure Vietnam Flexible Packaging Structure 445.8 532.2 612.0 718.4 834.7 -10% 0% 10% 20% 30% 40% 50% 60% 70% 80% 90% -100 0 100 200 300 400 500 600 700 800 900 2010 2011 2012 2013 2014 US$mn Flexible packaging Flexible growth Market Sizing and Growth of Vietnam Flexible Packaging According to StoxPlus’ estimation, Vietnam flexible packaging sized at US$834mn by 2014 end, posting an impressive CAGR of 16.3% in the period 2010 – 2014. The market size valued at US$718mn and US$612mn in 2013 and 2012, respectively. In term of competitive landscaping, Tan Tien packaging is the market leader in Vietnam flexible packaging with around 9% of total market share in 2014. The market is quite fragments with large firms mainly located in the South as end-users of flexible packaging also situate here (including beverage, food and pharmaceuticals companies). The competition becomes fiercer between two main groups of players: (i) domestic players including Tan Tien, Thanh Phu, Liksin, and Rang Dong; and (ii) foreign-owned players including Tin Thanh (SCG Thailand), Huhtamaki, Ngai Mee, Tong Yuan, and J.S Packaging. Vietnam flexible packaging is forecasted to expanse by 15 – 20% y-o-y until 2020 thanks to increasing domestic demand from beverage and packaged foods. In 2014, total soft drink market valued at US$3.59bn, posting an increase by 20% com- pared to 2013 while packaged food market sized at US$8.88bn. With the recovery in economics and increased westernization in lifestyle, beverages and packaged food in Vietnam would perform well in the next few year, creating potentials for plastic packaging manufacturers. Source: StoxPlus Tan Tien Plastic Packaging 8,48% Liksin6,25% gnoDgnaR Plastic 6,20%TinThanh 5,44% Huhta- maki 4,49% Saigon Plastic Packaging 4,17% Saigon Trapaco 2,85% Source: StoxPlus 3. MARKET SHARE 4. KEY FINANCIALS OF TOP 6 PLAYERS (listed companies only)Market share of top 7 players by total sale in the South of Vietnam, 2014 Company Total Assets (US$ million) Net Revenue (US$ million) EBITDA (US$ million) ROA ROE An Phat Plas c 66.42 72.91 6.47 3.65% 7.11% Tan Tien Plas c Packaging 55.06 70.75 6.63 2.96% 6.32% Rang Dong Plas c 34.85 50.44 3.82 3.40% 10.06% Saigon Plas c Packaging 34.55 34.83 3.75 1.16% 3.71% Tan Dai Hung Plas c 30.37 34.66 1.57 1.79% 3.77% Tan Phu Plas c 14.81 31.28 2.44 3.93% 15.60% If you want to have further information, please contact person below: Research Ms. Lan Nguyen Senior Manager lan.nguyen@stoxplus.com +84(4) 35626962 (ext.109) Business Information Ms. Hue Vuong Managing Director hue.vuong@stoxplus.com +84(8) 38233485 (ext.802) Financial Information Ms.Trang Truong Managing Director trang.truong@stoxplus.com +84(4) 35626962 (ext.114) Research Business Information Financial InformationResearch Business Information Financial Information Flexible Packaging FACT SHEET Dated September 25th 2015