1. Page 1 of 15
AN INTEGRATED APPROACH TO WATER QUALITY MANAGEMENT
R. C. Trivedi, M. Villars and S. P. Chakrabarti*
ABSTRACT
Most of the Indian rivers starve for water during the non-monsoon period, which
extends at a stretch for almost nine months. Groundwater as a source is also dwindling
due to over-exploitation of this resource for increased agricultural use, to support an
exploding population and industrial growth. A situation of fresh water sharing from
surface water to groundwater reserves below aquifers is virtually non-existent during the
non-monsoon period due to non-availability of water in rivers. Thus, the rivers quench
their thirst with whatever discharge they receive in the form of polluted waste waters
from households and effluents from industries (seldom treated) as point sources. A
recent survey of CPCB indicated that only about 22% of the total sewage generated in
the country are treated before it is discharged to water bodies and the rest 78% receives
no treatment. Discharge of untreated or inadequately treated industrial wastewaters,
which could be more lethal, make the situation worse. The rivers thus can no longer
serve fresh water to humanity as their self-assimilative capacities are exhausted. As a
result, water famine, especially during summer months, has become a non - news item
in this vast sub-continent.
To add to the miseries, untreated polluted wastewaters are discharged on land without
any rationale, which increases their potential to percolate and contaminate groundwater,
which would be beyond any contention for remediation at a later stage.
Water quality is being monitored since decades by several premier organisations, like
the Central Water Commission, the Central Ground Water Board, the State Water
Resources Development Agencies and the Central & State Pollution Control Boards
through their extensive and also expensive networks of monitoring stations, with no
virtual co-ordination among these organisations to initiate a concerted effort in
improving the quality of life through supply of potable water.
Being seized with the problem, the Ministry of Water Resources, Government of India,
has taken up the Hydrology Project in collaboration with the Government of the
Netherlands to develop a national Hydrological Information System (HIS) with user-
friendly software for the benefit of concerned agencies, and to evolve an integrated
approach for water (quality) management.
The present paper attempts to bring to the fore the need for such an approach and how to
make such a scheme successful.
----------------------------------------------------------------------------------------------------------
* Consultants, Hydrology Project, Ministry of Water Resources, Government of India,
CSMRS- Building, 4th
Floor, Olof Palme Marg, Hauz Khas, New Delhi-110 016(Fax
No.686 1685)
2. Page 2 of 15
1. Introduction
Fresh water, which is so essential for our life, is only a small portion of the total water
available on this earth. According to the global hydrological cycle, 97 percent of water
always remains in the sea. Of the left-over 3 percent, nearly 1.998 percent is locked in
the masses of ice caps and glaciers in the Poles and mountains and in the clouds, 0.85
percent falls directly on the sea as rainfall and 0.152 percent is available to humanity as
utilisable water in the form of precipitation on land. However, out of the 0.152 percent,
0.15 percent flows through the rivers back to the sea as surface run-off, and only 0.002
percent of water is available as surface water in lakes / rivers and groundwater reserves,
which could be harnessed to meet the demand for various designated best uses. Thus,
for every 250 litres of global water, only one teaspoonful of fresh water (5 cc) is
available to mankind, rendering it a scarce and precious resource.
2. Water Resources of India
The annual rainfall over India, based on the daily data from more than 3,000 rainfall
recording stations for a period of 50 years (1901-1950), is computed as 105 centimetres.
It is the largest anywhere in the world for a country of a comparable size. From
precipitation alone, India receives 4,000 km3
, including snowfall. Of this, 75 percent
occurs only during three monsoon months. A good part of it is lost through the process
of evaporation and plant transpiration, leaving only half of it on the land for use. After
allowing for evapo-transpiration losses, the country's surface flow is estimated as 1,880
km3
. Due to topographical, hydrological and other constraints, it is assessed that only
about 700 km3
of surface water can be put to beneficial use by conventional methods of
development. The annual replenishable groundwater resource is assessed to be about
600 km3
, of which the annual usable resource is estimated at 420 km3
. The distribution
of water resources in various compartments is shown in Table 1.
3. Page 3 of 15
Table 1 Estimated distribution of water resources of India
Compartment Quantity (km3
)
Total precipitation
• Immediate evaporation
• percolation in soil
- Soil moisture
- Groundwater
Surface water
4,000
700
2,150
1,650
500
1,150
Almost the entire country is criss-crossed by rivers. There are fourteen major river basins
in the country, which occupy 83 percent of total drainage basins, contribute 85 percent of
the total surface flow and house eighty percent of the country's population. They are
Brahmaputra, Ganga, Indus, Godavari, Krishna, Mahanadi, Narmada, Cauvery,
Brahmani, Tapi, Mahi, Subarnarekha, Pennar and Sabarmati rivers. These rivers have
been grouped into three categories based on drainage basin area as shown in Table 2.
Table 2 River basins of India
Category Basin
Area
(km2
)
Number
of
Basins
Percentage
of Total
Drainage
Area
Percentage
of Flow
Contribution
Percentage
of
Population
living in
the basin
Major More than
20,000
14 83 85 80
Medium Between
2,000 and
20,000
44 8 7
Minor Less than
2,000
55 9 8
20
There are also several non-basin coastal rivers, the lengths of which are small, besides a
few rivers, which originate and get lost in the deserts after traversing some distance.
4. Page 4 of 15
3. The Problem
Going by the number of rivers in the country, there is no dearth of it. But the problem of
water availability/scarcity is serious on account of diversity in geo-climatic conditions,
limited rainy season and inadequate water-holding capacity in terms of dams/reservoirs
to store excessive run-off during the monsoon. This has resulted in the country’s
hanging between two natural calamities—the drought and the flood. Under both
situations, the quality of the water resources is threatened from contamination. During
dry months, most of the rivers carry mainly untreated wastewater from human
habitation/industries. The status of waste water generation, collection and treatment in
class I cities and class II towns, as studied by the CPCB, revealed that only about 22%
of the total sewage generated in the country is treated before it is discharged to water
bodies, as shown in Table 3. During this lean period, also there is neither any flow in the
river nor there is any regenerated water from groundwater reserves, due to depleted
groundwater table on account of over - exploitation, to dilute or assimilate the waste
load. During this period, there is also wide scale use of untreated / partially treated
wastewater for irrigation increasing the potential for ground water contamination during
this period. In case of flood, the problems of surface and ground water contamination
pronounce as the floodwaters recede, on account of decomposed human bodies and
carcasses and other organic matters lying almost everywhere awaiting safe disposal.
The municipal solid wastes are disposed in low-lying areas in all the cities and towns
without any precaution against percolation of leachates contaminating groundwater.
Several such instances have come to light where the groundwater has shown
degradation in quality due to such casual method of disposal of garbage in unlined
pits/low-lying areas.
With the growth of agriculture, there is also large-scale use of organic and inorganic
fertilisers, which have potential for groundwater contamination.
Under such a scenario, there is a need for a strong mechanism for monitoring of the
quality of groundwater and surface water, for the benefit of the user agencies
participating in the environmental protection programmes.
5. Page 5 of 15
Table 3 Status of water supply and wastewater generation &
treatment in class I cities and class II towns of India
Parameters Status
Number of class I cities 299
Population ( million) 128.1
Distribution of population of class I cities
according to catchment area (million)
• Major river basins
• Non-basin coastal
• Non-basin, non-coastal
97.4
23.3
7.4
Water supply (million litres/day, mld) 20,545
Per capita water supply (litres/day) 182
Wastewater generated (mld) 15,772
Wastewater treated (mld) 3,740
Number of Class II towns 245
Population (million) 22.4
Distribution of population of class-II
towns according to catchment area
(million)
• Major river basin
• Non-basin coastal
• Non-basin, non-coastal
17.2
1.0
4.2
Water supply (mld) 1,936
Per capita water supply (litre/day) 103
Wastewater generated (mld) 1,650
Wastewater treated (mld) 61.5
4. Strategy for Protection of Water Resources
In its wisdom, the Indian Parliament enacted ‘The Water (Prevention and Control of
Pollution) Act’ in 1974 with the sole objective of ‘maintaining and restoring
wholesomeness of water bodies’, and Pollution Control Boards (PCB) were constituted
at the Central and State levels to perform the functions delineated in the Act. Water
being a State subject, the Central Pollution Control Board (CPCB) has inter alia been
given the mandate of an advisory role (1) to evolve water quality standards for inter-
State rivers and to solve inter-State disputes on pollution matters, (2) to develop
guidelines and manuals for prevention and control of pollution arising out of any
municipal/domestic or industrial discharge into water bodies, for implementation by the
State Pollution Control Boards (SPCB), and (3) to plan and cause to be executed nation-
6. Page 6 of 15
wide programmes for pollution control. CPCB has also been empowered to perform
functions of the State Pollution Control Boards on the directions of the Central
Government in case of development of a grave situation on account of pollution at any
location in the country at the cost of the State Government. However, CPCB and SPCBs
being autonomous bodies under the Central and State Governments respectively, there is
no direct institutional/organic linkage among the Pollution Control Boards to perform in
an integrated manner to solve the pollution problems through a holistic approach.
The PCBs have adopted the following strategies for prevention and containment of
pollution:
• control of pollution at source with due regard to techno-economic feasibility;
• utilisation of assimilative capacity of water bodies in allocating waste discharge
loads in stead of aiming at preserving pristine quality;
• proper siting of industries;
• recycling and reuse of treated waste water for agricultural purposes;
• introducing discipline in water abstraction and waste water discharge to effect water
conservation; and
• regulation in river flow/discharge
The above strategies have not only been drawn to tackle the problem of water scarcity
and preservation of quality of the available water resources, but also aims at promotion
of a co-ordinated effort among the concerned agencies at the Central and State levels.
5. Mechanism for Control of Pollution of Water Bodies
The mechanism for prevention and control of water pollution, as adopted by PCBs on
the basis of afore-mentioned strategies, approaches the problem from the following
angles:
• Control at source; and
• River basin-wise control
7. Page 7 of 15
5.1 Control at source
This mechanism is applied by means of ‘Granting of Consent’ to polluting sources after
they comply with the standards notified by the PCBs by providing adequate treatment to
their effluents before discharging into water bodies. These ‘Consents’ are renewable at
regular intervals, to be decided by PCBs, subject to compliance with the standards and
any other condition imposed by the Board.
For specific large industries, with capital investment above Rs. 50 crore, there is a
provision under ‘The Environment (Protection) Act, 1986’ for submission of the
‘Environmental Impact Assessment (EIA)’ report and ‘Environment Management Plan
(EMP)’ to the Ministry of Environment & Forests for obtaining environmental
clearance.
This approach requires frequent surveillance monitoring by PCBs at the final outlet of
industries to ensure compliance with the effluent discharge standards and its impact on
the river water quality.
5.2 River basin-wise pollution control
In case of multiple sources of pollution, even if the individual compliance with the
standards is ensured, the total quantum of the pollution load generated may exceed the
assimilative capacity of the water body warranting imposition of location-specific
stricter standards. For this purpose, the following procedure has been adopted by the
CPCB:
• The rivers including their tributaries are classified stretch by stretch into five
categories according to their designated-best-uses. A river stretch may be subjected
to a number of simultaneous uses. The stretch will be designated by that particular
use which demands the highest quality. Accordingly, the ‘Water Use’ map is
prepared to project the desired quality to sustain various uses.
• Water quality criteria for different designated-best-uses are defined for sustenance
of the quality (Table 4).
8. Page 8 of 15
Table 4 Designated-best-use Classification of fresh water
Designated-best-use Quality Class Primary Quality Criteria *
Drinking water source
without conventional
treatment, but with
chlorination
A 6.5 to 8.5 (1); 6 or more (2); 2 or less
(3); 50, 5%-200. and 20%-50 (4); Nil
(5 - 8)
Outdoor bathing
(organised)
B 6.5 to 8.5 (1); 5 or more(2); 3 or less
(3); 500, 5%-2000, and 20%-500(4);
Nil (5 - 8)
Drinking water source with
conventional treatment
C 6.5 to 8.5 (1); 4 or more (2); 3 or less
(3); 5000, 5%-20000, and 20%-5000
(4); Nil (5 - 8)
Propagation of wildlife and
fisheries
D 6.5 to 8.5 (1); 4 or more (2); Nil (3 -
4); 1.2 (5); Nil (6 - 8)
Irrigation, industrial
cooling, and controlled
waste disposal
E 60 to 8.5 (1); Nil (2 - 5); 2250 (6); 26
(7); 2 (8)
*Note: (1) pH, (2) dissolved oxygen in mg/l, (3) BOD20 C
5 day in mg/l, (4) total coliform (MPN/100 ml),
(5) free ammonia in mg/l, (6) electrical conductivity in µmho/cm, (7) sodium adsorption ratio, and
(8) boron in mg/l.
• A network of ‘Monitoring Stations’ is established to ascertain the actual quality of
water through sampling and analysis.
• The ‘Water Quality’ map is prepared based on the water quality data.
• The ‘Water Quality’ map is superimposed over the ‘Water Use’ map to identify
river stretches under stress in terms of quality requiring measures to be taken
upstream for improving the situation.
The above-mentioned approach is universally accepted. However, it needs
establishment of an efficient network of stations for reliable monitoring of the quality
of water for pollution-related parameters with accuracy at a regular frequency.
9. Page 9 of 15
6. Present Monitoring System and the Water Quality Database
Several agencies in the country viz. the Central Water Commission (CWC), the Central
Pollution Control Board (CPCB), the Central Ground Water Board (CGWB) etc., are
monitoring the quality of surface and ground waters, through their Regional Offices or
their counterpart agencies in the States according to their requirements/concern and
store their data for departmental use, observing secrecy at times. Sometimes data are
compiled and published as ‘Data Year Book’ with limited copies for their own use. The
type of data collected by the agencies and their usefulness are shown in Table 5.
Table 5 Water Quality Data and their Usefulness
S.No. Monitoring
Agency
Type of Data Usefulness/Purpose/
Limitations
1. CWC/State
Agency
Rainfall, Evaporation,
Humidity, Temp., Wind,
River flow, W.L., Flood
& Sediment character-
istics, Water quality
(except pollution para-
meters)
Water resources
development, Water sharing
among States, Flood
forecasting, Sediment
transport, Suitability
For irrigation etc.
2. CPCB/SPCB River water quality Limited network for
pollution trend monitoring
for enforcement of pollution
control regulations etc.
3. CGWB/State
Agency
Hydrogeology, Aquifer
characteristics,
Groundwater level, yield
and quality etc.
Groundwater potential
evaluation and resource
development, suitability for
irrigation etc.
4. India
Meteorology-
cal
Dept.(IMD)
Diurnal temperature,
wind direction and
velocity, rainfall intensity
and duration
Weather forecasting,
climatic trends and
behaviour
5. National
Informatics
Centre (NIC)
National economic
growth, industrial and
agricultural production
Easy flow of information to
users in different parts of the
country through a network
10. Page 10 of 15
The Central Water Commission (CWC) and its State counterpart Agencies are
monitoring water quality mostly at the river gauging stations, which are situated on
major rivers, and the focus of attention is to observe ionic balances and suitability of
water for use in irrigation. The monitoring network is not extensive and the laboratories
are not well equipped.
The Central Ground Water Board (CGWB) and its State counterparts on the contrary
have huge networks, so much so that they do not have adequate infrastructure to analyse
the samples within a reasonable time.
The Central Pollution Control Board (CPCB), on the other hand, have a very nominal
network of 480 water quality monitoring stations under the Global Environmental
Monitoring System (GEMS) of the World Health Organisation (WHO) and the
Monitoring of Indian National Aquatic Resources System (MINARS). Under these
systems, the respective State Pollution Control Boards (SPCBs) monitor water quality in
respect of their State at the locations identified by CPCB. Most of these Boards have
state-of-the-art laboratories with infrastructure facilities and trained manpower to
analyse water quality parameters including toxic substances, like heavy metals and
pesticides. However, with the rising pollution level, their thrust area is industrial
pollution control with respect to management of solid & liquid wastes and gaseous
emissions.
Each of the afore-said agencies has historic databases at their possession in files, and
some of them have already developed computerised databases and user-friendly soft-
wares. However, there is lack of co-ordination among the concerned agencies in data
sharing, and the agencies are working in a mutually exclusive manner in the absence of
a national database.
It is evident from the above analysis that there is an imminent need for an integrated
system for water quality management.
11. Page 11 of 15
7. The Hydrology Project
Realising the problems and constraints of the agencies involved in water (quality)
management and the need for integration of efforts being made by them, the Ministry of
Water Resources, Government of India has taken up the Hydrology Project (HP). The
project is being implemented with an International Development Association Credit
(No. 2774 –IN) for US $ 142.0 million. The primary objective of the project is to
improve the facilities and staff capabilities of the Central and State agencies involved in
surface and groundwater hydrology, for the collection and management of hydrometric
and water quality data, and use of such data for evaluation of water resources. The
project, therefore, involves network rationalisation of surface water gauging stations,
climatological stations and groundwater observation sites. Furthermore, it introduces
standard procedures for data collection, processing, validation and management
including the development and use of software for water resources evaluation.
The project area covers almost the entire Southern Indian peninsula. It comprises the
States of Andhra Pradesh, Tamil Nadu, Karnataka, Kerala, Maharashtra, Gujarat,
Madhya Pradesh and Orissa. The Government of The Netherlands finances Technical
Assistance, under the Indo-Dutch Bilateral Programme, for the required consultancy
services and overseas training amounting to US $ 17.4 million.
The Hydrology Project aims at developing comprehensive, easily accessible and user-
friendly databases covering all aspects of the hydrological cycle, including surface water
and groundwater in terms of quantity and quality and climatological measurements,
particularly of rainfall. Each database will be embedded in a Hydrological Information
System (HIS) which covers the hydrometeorological infrastructure and comprises
resources for the recording of the parameters and the required data validation,
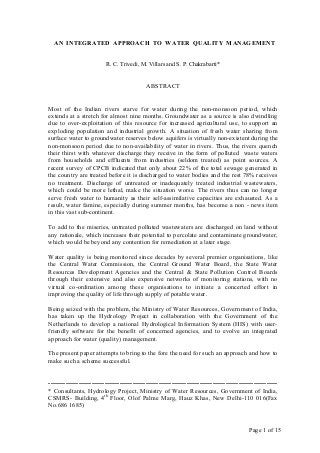
processing, storage, dissemination and presentation. The HIS structure at the
State/Regional level is shown in Fig.1. While the immediate goals for the Hydrology
Project are better quality of data and a user-friendly HIS, there is also support for
demand-driven research in water resources development and hydrology. This will assist
in the development of more reliable and spatially intensive data on water resources. The
project further aims at making the hydrological information available for planning and
management of water resources and other legitimate uses, and promoting its utilisation
12. Page 12 of 15
for the same. These goals are to be achieved by improvement of institutional and
organisational arrangements, technical capability and physical facilities available for
collection, processing and dissemination of hydrological and hydrometeorological data.
Hence, the ultimate objective of the project is to deliver a functional HIS and improve
the institutional capacity of implementing agencies to build, operate and utilise the HIS,
to the benefit of the different user groups, and to support major elements of the
country’s Water Policy.
8. Water Quality Management under HP-Programme
The water quality management programme, as conceived under the Hydrology Project,
is based on the premise that although there are multiple agencies involved at the Central
and State levels in the programme, the data generated are reliable. To achieve such an
objective, it is essential that (1) the sampling locations for water quality are
representative, (2) samples are preserved before transportation to laboratory to avoid
deterioration in quality, (3) samples are analysed for designed parameters at pre-decided
frequency following unified standard laboratory procedure by all the participating
agencies, (4) scientists/chemists are trained in operating state-of-the-art instruments
being procured for analysing pollution- related parameters, (5) analytical laboratory data
are validated before storage following unified data entry system, (6) within-laboratory
Analytical Quality Control (AQC) exercises are conducted in each laboratory as a
routine, and inter-laboratory AQC exercises are conducted at least once a year to
improve the reliability of data and to develop confidence level of the laboratory
analysts, and (7) interpretation of data is done in association/co-ordination with the
pollution control agencies for initiating action programmes, if needed.
With the above objectives in view, the following activities have been taken up to
integrate the water quality monitoring systems so that efforts made by various
concerned agencies are unified for a concerted action programme for mitigate measures:
• A rationale has been evolved for designing surface and groundwater monitoring
networks to locate baseline, trend and trend-cum-surveillance stations.
13. Page 13 of 15
• Monitoring locations have been finalised and indicated on maps of suitable scale for
the preparation of digitised maps to facilitate the application of a Geographic
Information System (GIS) in data interpretation.
• A ‘protocol for water quality monitoring’ has been documented, which streamlines
the procedure for selecting the parameters and the monitoring frequency based on
the type of stations, parameters to be analysed at site, preservation and
transportation of samples to the laboratory for analysis of remaining parameters,
data validation and reporting.
• Guidelines for standard analytical procedures have been evolved.
• Training modules have been prepared for each parameter.
• Hands-on-training is imparted for sampling and analyses of field parameters at site.
• AQC exercises are being conducted among the laboratories in association with the
Central Pollution Control Board.
• Computer softwares are developed for data entry and interpretation systems.
• To promote co-ordination among the agencies participating in HP and the agencies,
like the Central and the State Pollution Control Boards, municipalities etc., which
would be the ultimate users of the data generated under the HP, in planning their
programmes for pollution prevention and control to protect the national water
resources or deciding about conjuctive use of available water resources, interactions
are being made with the afore-said agencies, individually and also collectively, to
develop a good working relationship in mutual exchange of information available
with the respective agencies. This is being effected through constitution of State
Level Review Committees comprising members from all the HP- agencies and the
State Pollution Control Board in respect of the concerned State.
14. Page 14 of 15
9. Concluding Remarks
The Hydrology Project (HP), taken up by the Ministry of Water Resources, Government
of India, with the technical collaboration of the Government of The Netherlands and
financial assistance from the World Bank, is the first of its kind in the country to
promote interaction and co-ordination among various Central and State Government
agencies involved in monitoring of hydrological parameters, to avoid duplication of
efforts, and develop a national database, i.e. a ‘HIS’, and to facilitate sharing of
information for the benefit of user agencies. A schematic diagram of the integrated
approach for water quality management is shown in Fig. 1.
The Hydrology Project interacts with the Central and State agencies concerned with the
monitoring of water quality, individually and also collectively, to design the monitoring
network (avoiding duplication) and group the monitoring stations into background,
trend or surveillance stations according to quality requirements. Parameters and
frequency of monitoring for each category of stations have also been specified. To
ensure a unified procedure for monitoring and analysis, HP has also developed a
‘protocol for water quality monitoring’ and ‘guidelines for standard analytical
procedures’ to be observed by all the concerned agencies.
Efforts are being made for analytical quality control so that the water quality data
generated are of acceptable quality for the interpretation and subsequent utilisation by
user agencies through the software developed. This will strengthen the understanding of
water quality, both for surface and groundwater, as a basis for deriving action
programmes for maintaining/restoring water quality for sustainable use and protection
of aquatic resources in an integrated manner. This will also help in fulfilling the prime
objective of the Water (Prevention and Control of Pollution) Act-1974 in maintaining
and restoring the quality of the national water resources through concerted efforts
towards integrated water quality management.
Acknowledgement: The authors are thankful to Dr. J. G. Grijsen, Team Leader, Hydrology Project, for
his guidance and encouragement in preparing the manuscript of this paper.
15. Page 15 of 15
Fig. 1 Schematic Diagram of Integrated Approach for Water Quality Management
CWC - Central Water Commission
CGWB - Central Ground Water Board
IMD - India Meteorological Department
NIC – National Informatics Centre
Feedback
Feedback
Hydrology Project
CWC CGWB IMDState SW Department State GW Department
HIS (Institutional)
National Data Bank (NIC)
User Agency
Ministry of Environment and Forests, Central Pollution Control Board, State Pollution Control
Boards, Universities, State Departments of Environment, Non-government organisations
Ministry of Water Resources