HIV US Maps 2010
•Télécharger en tant que PPT, PDF•
0 j'aime•663 vues

Was your Sex Ed lacking? Find the missing chapter with iPROVIBE.com. "Let the Vibe be with you." -proVibe Promoting Self-Love - Sex Ed - Dating Prerequisites - Wellness http://iprovibe.com/ http://gplus.to/iprovibe http://www.facebook.com/iprovibe https://twitter.com/iproVibe http://pinterest.com/iprovibe/

Recommandé
Recommandé
Contenu connexe
Similaire à HIV US Maps 2010
Similaire à HIV US Maps 2010 (20)
Plus de iPROVIBE
Plus de iPROVIBE (20)
Dernier
Dernier (20)
HIV US Maps 2010
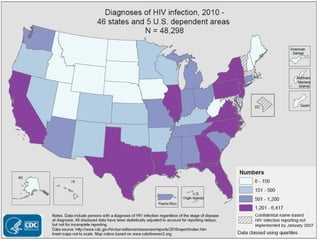
- 1. Slide 1: Diagnoses of HIV Infection, 2010 - 46 States and 5 U.S. Dependent Areas In 2010, in the 46 states and 5 U.S. dependent areas with confidential name-based HIV infection reporting since at least January 2007, the estimated number of diagnoses of HIV infection was 48,298. The estimated number of diagnoses of HIV infection ranged from zero in American Samoa and the Northern Mariana Islands to 6,417 in California.
- 2. Slide 2: Rates of Diagnoses of HIV Infection, 2010 - 46 States and 5 U.S. Dependent Areas In 2010, in the 46 states and 5 U.S. dependent areas with confidential name-based HIV infection reporting since at least January 2007, the estimated rate of diagnoses of HIV infection was 16.3 per 100,000 population. The estimated rates of diagnoses of HIV infection ranged from 0.0 per 100,000 in American Samoa and the Northern Mariana Islands to 42.8 per 100,000 in the U.S. Virgin Islands.
- 3. Slide 3: AIDS Diagnoses, 2010 - U.S. and 5 U.S. Dependent Areas In 2010, in the U.S. and 5 U.S. dependent areas, the estimated number of AIDS diagnoses was 33,630. The estimated number of AIDS diagnoses ranged from zero in American Samoa and the Northern Mariana Islands to 4,243 in California.
- 4. Slide 4: Rates of AIDS Diagnoses, 2010 - U.S. and 5 U.S. Dependent Areas In 2010, in the U.S. and 5 U.S. dependent areas, the estimated rate of AIDS diagnoses was 10.8 per 100,000 population. The estimated rates of AIDS diagnoses ranged from 0.0 per 100,000 in American Samoa and the Northern Mariana Islands to 112.5 per 100,000 in the District of Columbia. The District of Columbia is a metropolitan area; use caution when comparing the AIDS diagnosis rate in D.C. to state AIDS rates.
- 5. Slide 5: Cumulative AIDS Diagnoses, through 2010, adults and adolescents - United States and 5 U.S. Dependent Areas In 2010, in the U.S. and 5 U.S. dependent areas, the estimated cumulative number of AIDS diagnoses among adults and adolescents was 1,153,674. The estimated cumulative number of AIDS diagnoses ranged from two in American Samoa to 199,176 in New York.
- 6. Slide 6: Cumulative AIDS Diagnoses, through 2010, children aged <13 years - United States and 5 U.S. Dependent Areas In 2010, in the U.S. and 5 U.S. dependent areas, the estimated cumulative number of AIDS diagnoses among children <13 years was 9,898. The estimated cumulative number of AIDS diagnoses ranged from zero in American Samoa and the Northern Mariana Islands to 2,437 in New York.
- 7. Slide 7: Cumulative AIDS Diagnoses, through 2010 - United States and 5 U.S. Dependent Areas In 2010, in the U.S. and 5 U.S. dependent areas, the estimated cumulative number of AIDS diagnoses was 1,163,575. The estimated cumulative number of AIDS diagnoses ranged from two in American Samoa to 201,613 in New York.
- 8. Slide 8: Adults and Adolescents Living with a Diagnosis of HIV Infection, Year-end 2009 - 46 States and 5 U.S. Dependent Areas At the end of 2009, in the 46 states and 5 U.S. dependent areas with confidential name-based HIV infection reporting since at least January 2007, the estimated number of adults and adolescents living with a diagnosis of HIV infection was 800,784. The estimated number of adults and adolescents living with a diagnosis of HIV infection ranged from two in American Samoa to 130,608 in New York.
- 9. Slide 9: Rates of Adults and Adolescents Living with a Diagnosis of HIV Infection, Year-end 2009 - 46 States and 5 U.S. Dependent Areas At the end of 2009, in the 46 states and 5 U.S. dependent areas with confidential name-based HIV infection reporting since at least January 2007, the estimated rate of adults and adolescents living with a diagnosis of HIV infection was 327.6 per 100,000 population. The estimated rates of adults and adolescents living with a diagnosis of HIV infection ranged from 4.4 per 100,000 in American Samoa to 795.9 per 100,000 in New York.
- 10. Slide 10: Adult and Adolescent American Indians/Alaska Natives (AI/AN) Living with a Diagnosis of HIV Infection, Year-end 2009 - 46 States and 5 U.S. Dependent Areas At the end of 2009, in the 46 states and 5 U.S. dependent areas with confidential name-based HIV infection reporting since at least January 2007, the estimated number of adult and adolescent American Indians/Alaska Natives (AI/AN) living with a diagnosis of HIV infection was 3,031. The estimated number of adult and adolescent AI/AN living with a diagnosis of HIV infection ranged from zero in American Samoa, Guam, the Northern Mariana Islands, and the U.S. Virgin Islands to 463 in California.
- 11. Slide 11: Rates of Adult and Adolescent American Indians/Alaska Natives (AI/AN) Living with a Diagnosis of HIV Infection, Year-end 2009 - 46 States * At the end of 2009, in the 46 states with confidential name-based HIV infection reporting since at least January 2007, the estimated rate of adult and adolescent American Indians/Alaska Natives (AI/AN) living with a diagnosis of HIV infection was 163.6 per 100,000 AI/AN. The estimated rates of adult and adolescent AI/AN living with a diagnosis of HIV infection ranged from 36.6 per 100,000 in New Hampshire to 281.4 per 100,000 AI/AN in California. * Rates by race/ethnicity for the 5 U.S. dependent areas are not provided because the U.S. Census Bureau does not collect information on race/ethnicity from all U.S. dependent areas.
- 12. Slide 12: Adult and Adolescent Asians Living with a Diagnosis of HIV Infection, Year-end 2009 - 46 States and 5 U.S. Dependent Areas At the end of 2009, in the 46 states and 5 U.S. dependent areas with confidential name-based HIV infection reporting since at least January 2007, the estimated number of adult and adolescent Asians living with a diagnosis of HIV infection was 8,378. The estimated number of adult and adolescent Asians living with a diagnosis of HIV infection ranged from zero in Montana, the U.S. Virgin Islands, and Wyoming to 3,451 in California.
- 13. Slide 13: Rates of Adult and Adolescent Asians Living with a Diagnosis of HIV Infection, Year-end 2009 - 46 States * At the end of 2009, in the 46 states with confidential name-based HIV infection reporting since at least January 2007, the estimated rate of adult and adolescent Asians living with a diagnosis of HIV infection was 80.4 per 100,000 Asians. The estimated rates of adult and adolescent Asians living with a diagnosis of HIV infection ranged from 0.0 per 100,000 in Montana and Wyoming to 134.1 per 100,000 Asians in New York. * Rates by race/ethnicity for the 5 U.S. dependent areas are not provided because the U.S. Census Bureau does not collect information on race/ethnicity from all U.S. dependent areas.
- 14. Slide 14: Adult and Adolescent Blacks/African Americans Living with a Diagnosis of HIV Infection, Year-end 2009 - 46 States and 5 U.S. Dependent Areas At the end of 2009, in the 46 states and 5 U.S. dependent areas with confidential name-based HIV infection reporting since at least January 2007, the estimated number of adult and adolescent blacks/African Americans living with a diagnosis of HIV infection was 334,185. The estimated number of adult and adolescent blacks/African Americans living with a diagnosis of HIV infection ranged from zero in American Samoa and the Northern Mariana Islands to 56,223 in New York.
- 15. Slide 15: Rates of Adult and Adolescent Blacks/African Americans Living with a Diagnosis of HIV Infection, Year-end 2009 - 46 States * At the end of 2009, in the 46 states with confidential name-based HIV infection reporting since at least January 2007, the estimated rate of adult and adolescent blacks/African Americans living with a diagnosis of HIV infection was 1,178.6 per 100,000 blacks/African Americans. The estimated rates of adult and adolescent blacks/African Americans living with a diagnosis of HIV infection ranged from 289.6 per 100,000 in Montana to 2,376.0 per 100,000 blacks/African Americans in New York. * Rates by race/ethnicity for the 5 U.S. dependent areas are not provided because the U.S. Census Bureau does not collect information on race/ethnicity from all U.S. dependent areas.
- 16. Slide 16: Adult and Adolescent Hispanics/Latinos Living with a Diagnosis of HIV Infection, Year- end 2009 - 46 States and 5 U.S. Dependent Areas At the end of 2009, in the 46 states and 5 U.S. dependent areas with confidential name-based HIV infection reporting since at least January 2007, the estimated number of adult and adolescent Hispanics/Latinos living with a diagnosis of HIV infection was 169,089. The estimated number of adult and adolescent Hispanics/Latinos living with a diagnosis of HIV infection ranged from zero in American Samoa and the Northern Mariana Islands to 41,165 in New York.
- 17. Slide 17: Rates of Adult and Adolescent Hispanics/Latinos Living with a Diagnosis of HIV Infection, Year-end 2009 - 46 States * At the end of 2009, in the 46 states with confidential name-based HIV infection reporting since at least January 2007, the estimated rate of adult and adolescent Hispanics/Latinos living with a diagnosis of HIV infection was 432.3 per 100,000 Hispanics/Latinos. The estimated rates of adult and adolescent Hispanics/Latinos living with a diagnosis of HIV infection ranged from 37.2 per 100,000 in North Dakota to 1,604.7 per 100,000 Hispanics/Latinos in New York. * Rates by race/ethnicity for the 5 U.S. dependent areas are not provided because the U.S. Census Bureau does not collect information on race/ethnicity from all U.S. dependent areas.
- 18. Slide 18: Adult and Adolescent Native Hawaiians/Other Pacific Islanders (NHOPI) Living with a Diagnosis of HIV Infection, Year-end 2009 - 46 States and 5 U.S. Dependent Areas At the end of 2009, in the 46 states and 5 U.S. dependent areas with confidential name-based HIV infection reporting since at least January 2007, the estimated number of adult and adolescent Native Hawaiians/other Pacific Islanders (NHOPI) living with a diagnosis of HIV infection was 619. The estimated number of adult and adolescent NHOPI living with a diagnosis of HIV infection ranged from zero in 13 areas to 247 in California.
- 19. Slide 19: Rates of Adult and Adolescent Native Hawaiians/Other Pacific Islanders (NHOPI) Living with a Diagnosis of HIV Infection, Year-end 2009 - 46 States * At the end of 2009, in the 46 states with confidential name-based HIV infection reporting since at least January 2007, the estimated rate of adult and adolescent Native Hawaiians/other Pacific Islanders (NHOPI) living with a diagnosis of HIV infection was 233.1 per 100,000 NHOPI. The estimated rates of adult and adolescent NHOPI living with a diagnosis of HIV infection ranged from 0 per 100,000 in eleven states to 882.0 per 100,000 NHOPI in Illinois. * Rates by race/ethnicity for the 5 U.S. dependent areas are not provided because the U.S. Census Bureau does not collect information on race/ethnicity from all U.S. dependent areas.
- 20. Slide 20: Adult and Adolescent Whites Living with a Diagnosis of HIV Infection, Year-end 2009 - 46 States and 5 U.S. Dependent Areas At the end of 2009, in the 46 states and 5 U.S. dependent areas with confidential name-based HIV infection reporting since at least January 2007, the estimated number of adult and adolescent whites living with a diagnosis of HIV infection was 273,563. The estimated number of adult and adolescent whites living with a diagnosis of HIV infection ranged from zero in American Samoa and the Northern Mariana Islands to 48,555 in California.
- 21. Slide 21: Rates of Adult and Adolescent Whites Living with a Diagnosis of HIV Infection, Year-end 2009 - 46 States * At the end of 2009, in the 46 states with confidential name-based HIV infection reporting since at least January 2007, the estimated rate of adult and adolescent whites living with a diagnosis of HIV infection was 168.3 per 100,000 whites. The estimated rates of adult and adolescent whites living with a diagnosis of HIV infection ranged from 25.8 per 100,000 in North Dakota to 360.0 per 100,000 whites in California. * Rates by race/ethnicity for the 5 U.S. dependent areas are not provided because the U.S. Census Bureau does not collect information on race/ethnicity from all U.S. dependent areas.
- 22. Slide 22: Adults and Adolescents of Multiple Races Living with a Diagnosis of HIV Infection, Year- end 2009 - 46 States and 5 U.S. Dependent Areas At the end of 2009, in the 46 states and 5 U.S. dependent areas with confidential name-based HIV infection reporting since at least January 2007, the estimated number of adult and adolescent persons of multiple races living with a diagnosis of HIV infection was 11,149. The estimated number of adult and adolescent persons of multiple races living with a diagnosis of HIV infection ranged from zero in five areas to 3,659 in New York.
- 23. Slide 23: Rates of Adults and Adolescents of Multiple Races Living with a Diagnosis of HIV Infection, Year-end 2009 - 46 States * At the end of 2009, in the 46 states with confidential name-based HIV infection reporting since at least January 2007, the estimated rate of adults and adolescents of multiple races living with a diagnosis of HIV infection was 420.0 per 100,000 persons of multiple races. The estimated rates of adults and adolescents of multiple races living with a diagnosis of HIV infection ranged from 0.0 per 100,000 in North Dakota to 2,306.0 per 100,000 persons of multiple races in New York. * Rates by race/ethnicity for the 5 U.S. dependent areas are not provided because the U.S. Census Bureau does not collect information on race/ethnicity from all U.S. dependent areas.
- 24. Slide 24: Adults and Adolescents Living with an AIDS Diagnosis, Year-end 2009 – United States and 5 U.S. Dependent Areas At the end of 2009, the estimated number of adults and adolescents living with an AIDS diagnosis was 487,414. The estimated number of adults and adolescents living with an AIDS diagnosis ranged from two in American Samoa to 80,106 in New York.
- 25. Slide 25: Rates of Adults and Adolescents Living with an AIDS Diagnosis, Year-end 2009 – United States and 5 U.S. Dependent Areas At the end of 2009, the estimated rate of adults and adolescents living with an AIDS diagnosis was 189.7 per 100,000 population. The estimated rates of adults and adolescents living with an AIDS diagnosis ranged from 4.4 per 100,000 in American Samoa to 1,704.7 per 100,000 in the District of Columbia. The District of Columbia is a metropolitan area; use caution when comparing the AIDS prevalence rates in D.C. to state AIDS rates.
- 26. Slide 26: Adult and Adolescent American Indians/Alaska Natives (AI/AN) Living with an AIDS Diagnosis, Year-end 2009 – United States and 5 U.S. Dependent Areas At the end of 2009, the estimated number of adult and adolescent American Indians/Alaska Natives (AI/AN) living with an AIDS diagnosis was 1,657. The estimated number of adult and adolescent AI/AN living with an AIDS diagnosis ranged from zero in six areas to 284 in California.
- 27. Slide 27: Rates of Adult and Adolescent American Indians/Alaska Natives (AI/AN) Living with an AIDS Diagnosis, Year-end 2009 – United States* At the end of 2009, the estimated rate of adult and adolescent American Indians/Alaska Natives (AI/AN) living with an AIDS diagnosis was 87.9 per 100,000 AI/AN. The estimated rates of adult and adolescent AI/AN living with an AIDS diagnosis ranged from 0.0 per 100,000 in Iowa and New Hampshire to 427.5 per 100,000 AI/AN in the District of Columbia. The District of Columbia is a metropolitan area; use caution when comparing the AIDS prevalence rate in D.C. to state AIDS rates. * Rates by race/ethnicity for the 5 U.S. dependent areas are not provided because the U.S. Census Bureau does not collect information on race/ethnicity from all U.S. dependent areas.
- 28. Slide 28: Adult and Adolescent Asians Living with an AIDS Diagnosis, Year-end 2009 – United States and 5 U.S. Dependent Areas At the end of 2009, the estimated number of adult and adolescent Asians living with an AIDS diagnosis infection was 5,105. The estimated number of adult and adolescent Asians living with an AIDS diagnosis ranged from zero in six areas to 2,162 in California.
- 29. Slide 29: Rates of Adult and Adolescent Asians Living with an AIDS Diagnosis, Year-end 2009 – United States* At the end of 2009, the estimated rate of adult and adolescent Asians living with an AIDS diagnosis was 44.9 per 100,000 Asians. The estimated rates of adult and adolescent Asians living with an AIDS diagnosis ranged from 0.0 per 100,000 in Idaho, Montana, Vermont, and Wyoming to 147.4 per 100,000 Asians in the District of Columbia. The District of Columbia is a metropolitan area; use caution when comparing the AIDS prevalence rates in D.C. to state AIDS rates. * Rates by race/ethnicity for the 5 U.S. dependent areas are not provided because the U.S. Census Bureau does not collect information on race/ethnicity from all U.S. dependent areas.
- 30. Slide 30: Adult and Adolescent Blacks/African Americans Living with an AIDS Diagnosis, Year-end 2009 – United States and 5 U.S. Dependent Areas At the end of 2009, the estimated number of adult and adolescent blacks/African Americans living with an AIDS diagnosis was 206,116. The estimated number of adult and adolescent blacks/African Americans living with an AIDS diagnosis ranged from zero in American Samoa and the Northern Mariana Islands to 34,830 in New York.
- 31. Slide 31: Rates of Adult and Adolescent Blacks/African Americans Living with an AIDS Diagnosis, Year-end 2009 – United States* At the end of 2009, the estimated rate of adult and adolescent blacks/African Americans living with an AIDS diagnosis was 679.7 per 100,000 blacks/African Americans. The estimated rates of adult and adolescent blacks/African Americans living with an AIDS diagnosis ranged from 149.0 per 100,000 in Wyoming to 2,589.9 per 100,000 blacks/African Americans in the District of Columbia. The District of Columbia is a metropolitan area; use caution when comparing the AIDS prevalence rates in D.C. to state AIDS rates. * Rates by race/ethnicity for the 5 U.S. dependent areas are not provided because the U.S. Census Bureau does not collect information on race/ethnicity from all U.S. dependent areas.
- 32. Slide 32: Adult and Adolescent Hispanics/Latinos Living with an AIDS Diagnosis, Year-end 2009 – United States and 5 U.S. Dependent Areas At the end of 2009, the estimated number of adult and adolescent Hispanics/Latinos living with an AIDS diagnosis was 106,291. The estimated number of adult and adolescent Hispanics/Latinos living with an AIDS diagnosis ranged from zero in American Samoa, Guam, and the Northern Mariana Islands to 26,463 in New York.
- 33. Slide 33: Rates of Adult and Adolescent Hispanics/Latinos Living with an AIDS Diagnosis, Year- end 2009 – United States* At the end of 2009, the estimated rate of adult and adolescent Hispanics/Latinos living with an AIDS diagnosis was 267.1 per 100,000 Hispanics/Latinos. The estimated rates of adult and adolescent Hispanics/Latinos living with an AIDS diagnosis ranged from 24.8 per 100,000 in South Dakota to 1,168.3 per 100,000 Hispanics/Latinos in the District of Columbia. The District of Columbia is a metropolitan area; use caution when comparing the AIDS prevalence rates in D.C. to state AIDS rates. * Rates by race/ethnicity for the 5 U.S. dependent areas are not provided because the U.S. Census Bureau does not collect information on race/ethnicity from all U.S. dependent areas.
- 34. Slide 34: Adult and Adolescent Native Hawaiians/Other Pacific Islanders (NHOPI) Living with an AIDS Diagnosis, Year-end 2009 – United States and 5 U.S. Dependent Areas At the end of 2009, the estimated number of adult and adolescent Native Hawaiians/other Pacific Islanders (NHOPI) living with an AIDS diagnosis was 478. The estimated number of adult and adolescent NHOPI living with an AIDS diagnosis ranged from zero in 16 areas to 144 in California.
- 35. Slide 35: Rates of Adult and Adolescent Native Hawaiians/Other Pacific Islanders (NHOPI) Living with an AIDS Diagnosis, Year-end 2009 – United States* At the end of 2009, the estimated rate of adult and adolescent Native Hawaiians/other Pacific Islanders (NHOPI) living with an AIDS diagnosis was 131.4 per 100,000 NHOPI. The estimated rates of adult and adolescent NHOPI living with an AIDS diagnosis ranged from 0.0 per 100,000 in 13 states to 1,534.6 per 100,000 NHOPI in the District of Columbia. The District of Columbia is a metropolitan area; use caution when comparing the AIDS prevalence rates in D.C. to state AIDS rates. * Rates by race/ethnicity for the 5 U.S. dependent areas are not provided because the U.S. Census Bureau does not collect information on race/ethnicity from all U.S. dependent areas.
- 36. Slide 36: Adult and Adolescent Whites Living with an AIDS Diagnosis, Year-end 2009 – United States and 5 U.S. Dependent Areas At the end of 2009, the estimated number of adult and adolescent whites living with an AIDS diagnosis was 160,346. The estimated number of adult and adolescent whites living with an AIDS diagnosis ranged from zero in American Samoa and the Northern Mariana Islands to 30,644 in California.
- 37. Slide 37: Rates of Adult and Adolescent Whites Living with an AIDS Diagnosis, Year-end 2009 – United States* At the end of 2009, the estimated rate of adult and adolescent whites living with an AIDS diagnosis was 93.9 per 100,000 whites. The estimated rates of adult and adolescent whites living with an AIDS diagnosis ranged from 12.0 per 100,000 in North Dakota to 683.2 per 100,000 whites in the District of Columbia. The District of Columbia is a metropolitan area; use caution when comparing the AIDS prevalence rates in D.C. to state AIDS rates. * Rates by race/ethnicity for the 5 U.S. dependent areas are not provided because the U.S. Census Bureau does not collect information on race/ethnicity from all U.S. dependent areas.
- 38. Slide 38: Adults and Adolescents of Multiple Races Living with an AIDS Diagnosis, Year-end 2009 – United States and 5 U.S. Dependent Areas At the end of 2009, the estimated number of adults and adolescents of multiple races living with an AIDS diagnosis was 7,323. The estimated number of adults and adolescents of multiple races living with an AIDS diagnosis ranged from zero in North Dakota and South Dakota to 2,389 in New York.
- 39. Slide 39: Rates of Adults and Adolescents of Multiple Races Living with an AIDS Diagnosis, Year- end 2009 – United States* At the end of 2009, the estimated rate of adults and adolescents of multiple races living with an AIDS diagnosis was 250.4 per 100,000 persons of multiple races. The estimated rates of adults and adolescents of multiple races living with an AIDS diagnosis ranged from 0.0 per 100,000 in North Dakota and South Dakota to 1,505.3 per 100,000 persons of multiple races in New York. * Rates by race/ethnicity for the 5 U.S. dependent areas are not provided because the U.S. Census Bureau does not collect information on race/ethnicity from all U.S. dependent areas.
- 40. Slide 40: Diagnoses of HIV infection by Metropolitan Statistical Area (MSA) of residence, 2010 - 46 states and Puerto Rico In 2010, in the 46 states and Puerto Rico with confidential name-based HIV infection reporting since at least January 2007, the estimated number of diagnoses of HIV infection in MSAs with over 500,000 population was 38,079. The estimated numbers of diagnoses of HIV infection ranged from 8 in the Provo-Orem, UT MSA to 6,160 in the New York, NY-NJ-PA MSA.
- 41. Slide 41: Rates of diagnoses of HIV infection by Metropolitan Statistical Area (MSA) of residence, 2010 - 46 states and Puerto Rico In 2010, in the 46 states and Puerto Rico with confidential name-based HIV infection reporting since at least January 2007, the estimated rate of diagnoses of HIV infection in MSAs with over 500,000 population was 20.2 per 100,000 population. The estimated rates of diagnoses of HIV infection ranged from 1.4 per 100,000 population in the Provo-Orem, UT MSA to 49.7 per 100,000 population in the Miami, FL MSA.
- 42. Slide 42: Persons living with a diagnosis of HIV infection, by Metropolitan Statistical Area (MSA) of residence, year-end 2009 - 46 states and Puerto Rico At the end of 2009, in the 46 states and Puerto Rico with confidential name-based HIV infection reporting since at least January 2007, the estimated number of persons living with a diagnosis of HIV infection in MSAs with over 500,000 population was 647,021. The estimated numbers of persons living with a diagnosis of HIV infection ranged from 124 in the Provo-Orem, UT MSA to 140,988 in the New York, NY- NJ-PA MSA.
- 43. Slide 43: Rates of persons living with a diagnosis of HIV infection, by Metropolitan Statistical Area (MSA) of residence, year-end 2009 - 46 states and Puerto Rico At the end of 2009, in the 46 states and Puerto Rico with confidential name-based HIV infection reporting since at least January 2007, the estimated rate of persons living with a diagnosis of HIV infection in MSAs with over 500,000 population was 342.8 per 100,000 population. The estimated rates of persons living with a diagnosis of HIV infection ranged from 22.4 per 100,000 population in the Provo-Orem, UT MSA to 868.5 per 100,000 population in the Miami, FL MSA.
- 44. 5: Slide 44: AIDS diagnoses by Metropolitan Statistical Area (MSA) of residence, 2010 - United States and Puerto Rico In 2010, in the US and Puerto Rico, the estimated number of AIDS diagnoses in MSAs with over 500,000 population was 27,429. The estimated numbers of AIDS diagnoses ranged from 4 in the Provo-Orem, UT MSA to 4,318 in the New York, NY-NJ-PA MSA.
- 45. Slide 45: Rates of AIDS diagnoses, by Metropolitan Statistical Area (MSA) of residence, 2010 - United States and Puerto Rico In 2010, in the US and Puerto Rico, the estimated rate of AIDS diagnoses in MSAs with over 500,000 population was 13.4 per 100,000 population. The estimated rates of AIDS diagnoses ranged from 0.7 per 100,000 population in the Provo-Orem, UT MSA to 33.7 per 100,000 population in the Baton Rouge, LA MSA.
- 46. Slide 46: Persons living with an AIDS diagnosis, by Metropolitan Statistical Area (MSA) of residence, year-end 2009 - United States and Puerto Rico At the end of 2009, in the US and Puerto Rico, the estimated number of persons living with an AIDS diagnosis in MSAs with over 500,000 population was 407,727. The estimated numbers of persons living with an AIDS diagnosis ranged from 73 in the Provo-Orem, UT MSA to 84,703 in the New York, NY-NJ- PA MSA.
- 47. Slide 47: Rates of persons living with an AIDS diagnosis, by Metropolitan Statistical Area (MSA) of residence, year-end 2009 - United States and Puerto Rico At the end of 2009, in the US and Puerto Rico, the estimated rate of persons living with an AIDS diagnosis in MSAs with over 500,000 population was 198.7 per 100,000 population. The estimated rates of persons living with an AIDS diagnosis ranged from 13.1 per 100,000 population in the Provo-Orem, UT MSA to 473.0 per 100,000 population in the Miami, FL MSA.
- 48. Slide 48: Cumulative AIDS diagnoses, through 2010, among children aged <13 years, by Metropolitan Statistical Area (MSA) of residence - United States and Puerto Rico At the end of 2010, in the US and Puerto Rico, the estimated cumulative number of AIDS diagnoses among children aged < 13 years was 8,528. The estimated cumulative numbers of AIDS diagnoses among children ranged from zero in the Boise City–Nampa, ID MSA and the Youngstown–Warren– Boardman, OH–PA MSA to 3,008 in the New York, NY-NJ-PA MSA.
- 49. Slide 49: Cumulative AIDS diagnoses, through 2010, among adults and adolescents, by Metropolitan Statistical Area (MSA) of residence - United States and Puerto Rico At the end of 2010, in the US and Puerto Rico, the estimated cumulative number of AIDS diagnoses among adolescents and adults (aged 13 years or older) was 973,372. The estimated cumulative numbers of AIDS diagnoses among adolescents and adults ranged from 137 in the Provo-Orem, UT MSA to 221,281 in the New York, NY-NJ-PA MSA.
- 50. Slide 50: Cumulative AIDS diagnoses, through 2010, by Metropolitan Statistical Area (MSA) of residence - United States and Puerto Rico At the end of 2010, in the US and Puerto Rico, the estimated cumulative number of AIDS diagnoses was 981,899. The estimated cumulative numbers of AIDS diagnoses ranged from 140 in the Provo-Orem, UT MSA to 224,289 in the New York, NY-NJ-PA MSA.
- 51. Was your Sex Ed lacking? Find the missing chapter with Username: iPROVIBE
Notes de l'éditeur
- Slide 1: Diagnoses of HIV Infection, 2010 - 46 States and 5 U.S. Dependent Areas In 2010, in the 46 states and 5 U.S. dependent areas with confidential name-based HIV infection reporting since at least January 2007, the estimated number of diagnoses of HIV infection was 48,298. The estimated number of diagnoses of HIV infection ranged from zero in American Samoa and the Northern Mariana Islands to 6,417 in California.
- Slide 2: Rates of Diagnoses of HIV Infection, 2010 - 46 States and 5 U.S. Dependent Areas In 2010, in the 46 states and 5 U.S. dependent areas with confidential name-based HIV infection reporting since at least January 2007, the estimated rate of diagnoses of HIV infection was 16.3 per 100,000 population. The estimated rates of diagnoses of HIV infection ranged from 0.0 per 100,000 in American Samoa and the Northern Mariana Islands to 42.8 per 100,000 in the U.S. Virgin Islands.
- Slide 3: AIDS Diagnoses, 2010 - U.S. and 5 U.S. Dependent Areas In 2010, in the U.S. and 5 U.S. dependent areas, the estimated number of AIDS diagnoses was 33,630. The estimated number of AIDS diagnoses ranged from zero in American Samoa and the Northern Mariana Islands to 4,243 in California.
- Slide 4: Rates of AIDS Diagnoses, 2010 - U.S. and 5 U.S. Dependent Areas In 2010, in the U.S. and 5 U.S. dependent areas, the estimated rate of AIDS diagnoses was 10.8 per 100,000 population. The estimated rates of AIDS diagnoses ranged from 0.0 per 100,000 in American Samoa and the Northern Mariana Islands to 112.5 per 100,000 in the District of Columbia. The District of Columbia is a metropolitan area; use caution when comparing the AIDS diagnosis rate in D.C. to state AIDS rates.
- Slide 5: Cumulative AIDS Diagnoses, through 2010, adults and adolescents - United States and 5 U.S. Dependent Areas In 2010, in the U.S. and 5 U.S. dependent areas, the estimated cumulative number of AIDS diagnoses among adults and adolescents was 1,153,674. The estimated cumulative number of AIDS diagnoses ranged from two in American Samoa to 199,176 in New York.
- Slide 6: Cumulative AIDS Diagnoses, through 2010, children aged <13 years - United States and 5 U.S. Dependent Areas In 2010, in the U.S. and 5 U.S. dependent areas, the estimated cumulative number of AIDS diagnoses among children <13 years was 9,898. The estimated cumulative number of AIDS diagnoses ranged from zero in American Samoa and the Northern Mariana Islands to 2,437 in New York.
- Slide 7: Cumulative AIDS Diagnoses, through 2010 - United States and 5 U.S. Dependent Areas In 2010, in the U.S. and 5 U.S. dependent areas, the estimated cumulative number of AIDS diagnoses was 1,163,575. The estimated cumulative number of AIDS diagnoses ranged from two in American Samoa to 201,613 in New York.
- Slide 8: Adults and Adolescents Living with a Diagnosis of HIV Infection, Year-end 2009 - 46 States and 5 U.S. Dependent Areas At the end of 2009, in the 46 states and 5 U.S. dependent areas with confidential name-based HIV infection reporting since at least January 2007, the estimated number of adults and adolescents living with a diagnosis of HIV infection was 800,784. The estimated number of adults and adolescents living with a diagnosis of HIV infection ranged from two in American Samoa to 130,608 in New York.
- Slide 9: Rates of Adults and Adolescents Living with a Diagnosis of HIV Infection, Year-end 2009 - 46 States and 5 U.S. Dependent Areas At the end of 2009, in the 46 states and 5 U.S. dependent areas with confidential name-based HIV infection reporting since at least January 2007, the estimated rate of adults and adolescents living with a diagnosis of HIV infection was 327.6 per 100,000 population. The estimated rates of adults and adolescents living with a diagnosis of HIV infection ranged from 4.4 per 100,000 in American Samoa to 795.9 per 100,000 in New York.
- Slide 10: Adult and Adolescent American Indians/Alaska Natives (AI/AN) Living with a Diagnosis of HIV Infection, Year-end 2009 - 46 States and 5 U.S. Dependent Areas At the end of 2009, in the 46 states and 5 U.S. dependent areas with confidential name-based HIV infection reporting since at least January 2007, the estimated number of adult and adolescent American Indians/Alaska Natives (AI/AN) living with a diagnosis of HIV infection was 3,031. The estimated number of adult and adolescent AI/AN living with a diagnosis of HIV infection ranged from zero in American Samoa, Guam, the Northern Mariana Islands, and the U.S. Virgin Islands to 463 in California.
- Slide 11: Rates of Adult and Adolescent American Indians/Alaska Natives (AI/AN) Living with a Diagnosis of HIV Infection, Year-end 2009 - 46 States * At the end of 2009, in the 46 states with confidential name-based HIV infection reporting since at least January 2007, the estimated rate of adult and adolescent American Indians/Alaska Natives (AI/AN) living with a diagnosis of HIV infection was 163.6 per 100,000 AI/AN. The estimated rates of adult and adolescent AI/AN living with a diagnosis of HIV infection ranged from 36.6 per 100,000 in New Hampshire to 281.4 per 100,000 AI/AN in California. * Rates by race/ethnicity for the 5 U.S. dependent areas are not provided because the U.S. Census Bureau does not collect information on race/ethnicity from all U.S. dependent areas.
- Slide 12: Adult and Adolescent Asians Living with a Diagnosis of HIV Infection, Year-end 2009 - 46 States and 5 U.S. Dependent Areas At the end of 2009, in the 46 states and 5 U.S. dependent areas with confidential name-based HIV infection reporting since at least January 2007, the estimated number of adult and adolescent Asians living with a diagnosis of HIV infection was 8,378. The estimated number of adult and adolescent Asians living with a diagnosis of HIV infection ranged from zero in Montana, the U.S. Virgin Islands, and Wyoming to 3,451 in California.
- Slide 13: Rates of Adult and Adolescent Asians Living with a Diagnosis of HIV Infection, Year-end 2009 - 46 States * At the end of 2009, in the 46 states with confidential name-based HIV infection reporting since at least January 2007, the estimated rate of adult and adolescent Asians living with a diagnosis of HIV infection was 80.4 per 100,000 Asians. The estimated rates of adult and adolescent Asians living with a diagnosis of HIV infection ranged from 0.0 per 100,000 in Montana and Wyoming to 134.1 per 100,000 Asians in New York. * Rates by race/ethnicity for the 5 U.S. dependent areas are not provided because the U.S. Census Bureau does not collect information on race/ethnicity from all U.S. dependent areas.
- Slide 14: Adult and Adolescent Blacks/African Americans Living with a Diagnosis of HIV Infection, Year-end 2009 - 46 States and 5 U.S. Dependent Areas At the end of 2009, in the 46 states and 5 U.S. dependent areas with confidential name-based HIV infection reporting since at least January 2007, the estimated number of adult and adolescent blacks/African Americans living with a diagnosis of HIV infection was 334,185. The estimated number of adult and adolescent blacks/African Americans living with a diagnosis of HIV infection ranged from zero in American Samoa and the Northern Mariana Islands to 56,223 in New York.
- Slide 15: Rates of Adult and Adolescent Blacks/African Americans Living with a Diagnosis of HIV Infection, Year-end 2009 - 46 States * At the end of 2009, in the 46 states with confidential name-based HIV infection reporting since at least January 2007, the estimated rate of adult and adolescent blacks/African Americans living with a diagnosis of HIV infection was 1,178.6 per 100,000 blacks/African Americans. The estimated rates of adult and adolescent blacks/African Americans living with a diagnosis of HIV infection ranged from 289.6 per 100,000 in Montana to 2,376.0 per 100,000 blacks/African Americans in New York. * Rates by race/ethnicity for the 5 U.S. dependent areas are not provided because the U.S. Census Bureau does not collect information on race/ethnicity from all U.S. dependent areas.
- Slide 16: Adult and Adolescent Hispanics/Latinos Living with a Diagnosis of HIV Infection, Year-end 2009 - 46 States and 5 U.S. Dependent Areas At the end of 2009, in the 46 states and 5 U.S. dependent areas with confidential name-based HIV infection reporting since at least January 2007, the estimated number of adult and adolescent Hispanics/Latinos living with a diagnosis of HIV infection was 169,089. The estimated number of adult and adolescent Hispanics/Latinos living with a diagnosis of HIV infection ranged from zero in American Samoa and the Northern Mariana Islands to 41,165 in New York.
- Slide 17: Rates of Adult and Adolescent Hispanics/Latinos Living with a Diagnosis of HIV Infection, Year-end 2009 - 46 States * At the end of 2009, in the 46 states with confidential name-based HIV infection reporting since at least January 2007, the estimated rate of adult and adolescent Hispanics/Latinos living with a diagnosis of HIV infection was 432.3 per 100,000 Hispanics/Latinos. The estimated rates of adult and adolescent Hispanics/Latinos living with a diagnosis of HIV infection ranged from 37.2 per 100,000 in North Dakota to 1,604.7 per 100,000 Hispanics/Latinos in New York. * Rates by race/ethnicity for the 5 U.S. dependent areas are not provided because the U.S. Census Bureau does not collect information on race/ethnicity from all U.S. dependent areas.
- Slide 18: Adult and Adolescent Native Hawaiians/Other Pacific Islanders (NHOPI) Living with a Diagnosis of HIV Infection, Year-end 2009 - 46 States and 5 U.S. Dependent Areas At the end of 2009, in the 46 states and 5 U.S. dependent areas with confidential name-based HIV infection reporting since at least January 2007, the estimated number of adult and adolescent Native Hawaiians/other Pacific Islanders (NHOPI) living with a diagnosis of HIV infection was 619. The estimated number of adult and adolescent NHOPI living with a diagnosis of HIV infection ranged from zero in 13 areas to 247 in California.
- Slide 19: Rates of Adult and Adolescent Native Hawaiians/Other Pacific Islanders (NHOPI) Living with a Diagnosis of HIV Infection, Year-end 2009 - 46 States * At the end of 2009, in the 46 states with confidential name-based HIV infection reporting since at least January 2007, the estimated rate of adult and adolescent Native Hawaiians/other Pacific Islanders (NHOPI) living with a diagnosis of HIV infection was 233.1 per 100,000 NHOPI. The estimated rates of adult and adolescent NHOPI living with a diagnosis of HIV infection ranged from 0 per 100,000 in eleven states to 882.0 per 100,000 NHOPI in Illinois. * Rates by race/ethnicity for the 5 U.S. dependent areas are not provided because the U.S. Census Bureau does not collect information on race/ethnicity from all U.S. dependent areas.
- Slide 20: Adult and Adolescent Whites Living with a Diagnosis of HIV Infection, Year-end 2009 - 46 States and 5 U.S. Dependent Areas At the end of 2009, in the 46 states and 5 U.S. dependent areas with confidential name-based HIV infection reporting since at least January 2007, the estimated number of adult and adolescent whites living with a diagnosis of HIV infection was 273,563. The estimated number of adult and adolescent whites living with a diagnosis of HIV infection ranged from zero in American Samoa and the Northern Mariana Islands to 48,555 in California.
- Slide 21: Rates of Adult and Adolescent Whites Living with a Diagnosis of HIV Infection, Year-end 2009 - 46 States * At the end of 2009, in the 46 states with confidential name-based HIV infection reporting since at least January 2007, the estimated rate of adult and adolescent whites living with a diagnosis of HIV infection was 168.3 per 100,000 whites. The estimated rates of adult and adolescent whites living with a diagnosis of HIV infection ranged from 25.8 per 100,000 in North Dakota to 360.0 per 100,000 whites in California. * Rates by race/ethnicity for the 5 U.S. dependent areas are not provided because the U.S. Census Bureau does not collect information on race/ethnicity from all U.S. dependent areas.
- Slide 22: Adults and Adolescents of Multiple Races Living with a Diagnosis of HIV Infection, Year-end 2009 - 46 States and 5 U.S. Dependent Areas At the end of 2009, in the 46 states and 5 U.S. dependent areas with confidential name-based HIV infection reporting since at least January 2007, the estimated number of adult and adolescent persons of multiple races living with a diagnosis of HIV infection was 11,149. The estimated number of adult and adolescent persons of multiple races living with a diagnosis of HIV infection ranged from zero in five areas to 3,659 in New York.
- Slide 23: Rates of Adults and Adolescents of Multiple Races Living with a Diagnosis of HIV Infection, Year-end 2009 - 46 States * At the end of 2009, in the 46 states with confidential name-based HIV infection reporting since at least January 2007, the estimated rate of adults and adolescents of multiple races living with a diagnosis of HIV infection was 420.0 per 100,000 persons of multiple races. The estimated rates of adults and adolescents of multiple races living with a diagnosis of HIV infection ranged from 0.0 per 100,000 in North Dakota to 2,306.0 per 100,000 persons of multiple races in New York. * Rates by race/ethnicity for the 5 U.S. dependent areas are not provided because the U.S. Census Bureau does not collect information on race/ethnicity from all U.S. dependent areas.
- Slide 24: Adults and Adolescents Living with an AIDS Diagnosis, Year-end 2009 – United States and 5 U.S. Dependent Areas At the end of 2009, the estimated number of adults and adolescents living with an AIDS diagnosis was 487,414. The estimated number of adults and adolescents living with an AIDS diagnosis ranged from two in American Samoa to 80,106 in New York.
- Slide 25: Rates of Adults and Adolescents Living with an AIDS Diagnosis, Year-end 2009 – United States and 5 U.S. Dependent Areas At the end of 2009, the estimated rate of adults and adolescents living with an AIDS diagnosis was 189.7 per 100,000 population. The estimated rates of adults and adolescents living with an AIDS diagnosis ranged from 4.4 per 100,000 in American Samoa to 1,704.7 per 100,000 in the District of Columbia. The District of Columbia is a metropolitan area; use caution when comparing the AIDS prevalence rates in D.C. to state AIDS rates.
- Slide 26: Adult and Adolescent American Indians/Alaska Natives (AI/AN) Living with an AIDS Diagnosis, Year-end 2009 – United States and 5 U.S. Dependent Areas At the end of 2009, the estimated number of adult and adolescent American Indians/Alaska Natives (AI/AN) living with an AIDS diagnosis was 1,657. The estimated number of adult and adolescent AI/AN living with an AIDS diagnosis ranged from zero in six areas to 284 in California.
- Slide 27: Rates of Adult and Adolescent American Indians/Alaska Natives (AI/AN) Living with an AIDS Diagnosis, Year-end 2009 – United States* At the end of 2009, the estimated rate of adult and adolescent American Indians/Alaska Natives (AI/AN) living with an AIDS diagnosis was 87.9 per 100,000 AI/AN. The estimated rates of adult and adolescent AI/AN living with an AIDS diagnosis ranged from 0.0 per 100,000 in Iowa and New Hampshire to 427.5 per 100,000 AI/AN in the District of Columbia. The District of Columbia is a metropolitan area; use caution when comparing the AIDS prevalence rate in D.C. to state AIDS rates. * Rates by race/ethnicity for the 5 U.S. dependent areas are not provided because the U.S. Census Bureau does not collect information on race/ethnicity from all U.S. dependent areas.
- Slide 28: Adult and Adolescent Asians Living with an AIDS Diagnosis, Year-end 2009 – United States and 5 U.S. Dependent Areas At the end of 2009, the estimated number of adult and adolescent Asians living with an AIDS diagnosis infection was 5,105. The estimated number of adult and adolescent Asians living with an AIDS diagnosis ranged from zero in six areas to 2,162 in California.
- Slide 29: Rates of Adult and Adolescent Asians Living with an AIDS Diagnosis, Year-end 2009 – United States* At the end of 2009, the estimated rate of adult and adolescent Asians living with an AIDS diagnosis was 44.9 per 100,000 Asians. The estimated rates of adult and adolescent Asians living with an AIDS diagnosis ranged from 0.0 per 100,000 in Idaho, Montana, Vermont, and Wyoming to 147.4 per 100,000 Asians in the District of Columbia. The District of Columbia is a metropolitan area; use caution when comparing the AIDS prevalence rates in D.C. to state AIDS rates. * Rates by race/ethnicity for the 5 U.S. dependent areas are not provided because the U.S. Census Bureau does not collect information on race/ethnicity from all U.S. dependent areas.
- Slide 30: Adult and Adolescent Blacks/African Americans Living with an AIDS Diagnosis, Year-end 2009 – United States and 5 U.S. Dependent Areas At the end of 2009, the estimated number of adult and adolescent blacks/African Americans living with an AIDS diagnosis was 206,116. The estimated number of adult and adolescent blacks/African Americans living with an AIDS diagnosis ranged from zero in American Samoa and the Northern Mariana Islands to 34,830 in New York.
- Slide 31: Rates of Adult and Adolescent Blacks/African Americans Living with an AIDS Diagnosis, Year-end 2009 – United States* At the end of 2009, the estimated rate of adult and adolescent blacks/African Americans living with an AIDS diagnosis was 679.7 per 100,000 blacks/African Americans. The estimated rates of adult and adolescent blacks/African Americans living with an AIDS diagnosis ranged from 149.0 per 100,000 in Wyoming to 2,589.9 per 100,000 blacks/African Americans in the District of Columbia. The District of Columbia is a metropolitan area; use caution when comparing the AIDS prevalence rates in D.C. to state AIDS rates. * Rates by race/ethnicity for the 5 U.S. dependent areas are not provided because the U.S. Census Bureau does not collect information on race/ethnicity from all U.S. dependent areas.
- Slide 32: Adult and Adolescent Hispanics/Latinos Living with an AIDS Diagnosis, Year-end 2009 – United States and 5 U.S. Dependent Areas At the end of 2009, the estimated number of adult and adolescent Hispanics/Latinos living with an AIDS diagnosis was 106,291. The estimated number of adult and adolescent Hispanics/Latinos living with an AIDS diagnosis ranged from zero in American Samoa, Guam, and the Northern Mariana Islands to 26,463 in New York.
- Slide 33: Rates of Adult and Adolescent Hispanics/Latinos Living with an AIDS Diagnosis, Year-end 2009 – United States* At the end of 2009, the estimated rate of adult and adolescent Hispanics/Latinos living with an AIDS diagnosis was 267.1 per 100,000 Hispanics/Latinos. The estimated rates of adult and adolescent Hispanics/Latinos living with an AIDS diagnosis ranged from 24.8 per 100,000 in South Dakota to 1,168.3 per 100,000 Hispanics/Latinos in the District of Columbia. The District of Columbia is a metropolitan area; use caution when comparing the AIDS prevalence rates in D.C. to state AIDS rates. * Rates by race/ethnicity for the 5 U.S. dependent areas are not provided because the U.S. Census Bureau does not collect information on race/ethnicity from all U.S. dependent areas.
- Slide 34: Adult and Adolescent Native Hawaiians/Other Pacific Islanders (NHOPI) Living with an AIDS Diagnosis, Year-end 2009 – United States and 5 U.S. Dependent Areas At the end of 2009, the estimated number of adult and adolescent Native Hawaiians/other Pacific Islanders (NHOPI) living with an AIDS diagnosis was 478. The estimated number of adult and adolescent NHOPI living with an AIDS diagnosis ranged from zero in 16 areas to 144 in California.
- Slide 35: Rates of Adult and Adolescent Native Hawaiians/Other Pacific Islanders (NHOPI) Living with an AIDS Diagnosis, Year-end 2009 – United States* At the end of 2009, the estimated rate of adult and adolescent Native Hawaiians/other Pacific Islanders (NHOPI) living with an AIDS diagnosis was 131.4 per 100,000 NHOPI. The estimated rates of adult and adolescent NHOPI living with an AIDS diagnosis ranged from 0.0 per 100,000 in 13 states to 1,534.6 per 100,000 NHOPI in the District of Columbia. The District of Columbia is a metropolitan area; use caution when comparing the AIDS prevalence rates in D.C. to state AIDS rates. * Rates by race/ethnicity for the 5 U.S. dependent areas are not provided because the U.S. Census Bureau does not collect information on race/ethnicity from all U.S. dependent areas.
- Slide 36: Adult and Adolescent Whites Living with an AIDS Diagnosis, Year-end 2009 – United States and 5 U.S. Dependent Areas At the end of 2009, the estimated number of adult and adolescent whites living with an AIDS diagnosis was 160,346. The estimated number of adult and adolescent whites living with an AIDS diagnosis ranged from zero in American Samoa and the Northern Mariana Islands to 30,644 in California.
- Slide 37: Rates of Adult and Adolescent Whites Living with an AIDS Diagnosis, Year-end 2009 – United States* At the end of 2009, the estimated rate of adult and adolescent whites living with an AIDS diagnosis was 93.9 per 100,000 whites. The estimated rates of adult and adolescent whites living with an AIDS diagnosis ranged from 12.0 per 100,000 in North Dakota to 683.2 per 100,000 whites in the District of Columbia. The District of Columbia is a metropolitan area; use caution when comparing the AIDS prevalence rates in D.C. to state AIDS rates. * Rates by race/ethnicity for the 5 U.S. dependent areas are not provided because the U.S. Census Bureau does not collect information on race/ethnicity from all U.S. dependent areas.
- Slide 38: Adults and Adolescents of Multiple Races Living with an AIDS Diagnosis, Year-end 2009 – United States and 5 U.S. Dependent Areas At the end of 2009, the estimated number of adults and adolescents of multiple races living with an AIDS diagnosis was 7,323. The estimated number of adults and adolescents of multiple races living with an AIDS diagnosis ranged from zero in North Dakota and South Dakota to 2,389 in New York.
- Slide 39: Rates of Adults and Adolescents of Multiple Races Living with an AIDS Diagnosis, Year-end 2009 – United States* At the end of 2009, the estimated rate of adults and adolescents of multiple races living with an AIDS diagnosis was 250.4 per 100,000 persons of multiple races. The estimated rates of adults and adolescents of multiple races living with an AIDS diagnosis ranged from 0.0 per 100,000 in North Dakota and South Dakota to 1,505.3 per 100,000 persons of multiple races in New York. * Rates by race/ethnicity for the 5 U.S. dependent areas are not provided because the U.S. Census Bureau does not collect information on race/ethnicity from all U.S. dependent areas.
- Slide 40: Diagnoses of HIV infection by Metropolitan Statistical Area (MSA) of residence, 2010 - 46 states and Puerto Rico In 2010, in the 46 states and Puerto Rico with confidential name-based HIV infection reporting since at least January 2007, the estimated number of diagnoses of HIV infection in MSAs with over 500,000 population was 38,079. The estimated numbers of diagnoses of HIV infection ranged from 8 in the Provo-Orem, UT MSA to 6,160 in the New York, NY-NJ-PA MSA.
- Slide 41: Rates of diagnoses of HIV infection by Metropolitan Statistical Area (MSA) of residence, 2010 - 46 states and Puerto Rico In 2010, in the 46 states and Puerto Rico with confidential name-based HIV infection reporting since at least January 2007, the estimated rate of diagnoses of HIV infection in MSAs with over 500,000 population was 20.2 per 100,000 population. The estimated rates of diagnoses of HIV infection ranged from 1.4 per 100,000 population in the Provo-Orem, UT MSA to 49.7 per 100,000 population in the Miami, FL MSA.
- Slide 42: Persons living with a diagnosis of HIV infection, by Metropolitan Statistical Area (MSA) of residence, year-end 2009 - 46 states and Puerto Rico At the end of 2009, in the 46 states and Puerto Rico with confidential name-based HIV infection reporting since at least January 2007, the estimated number of persons living with a diagnosis of HIV infection in MSAs with over 500,000 population was 647,021. The estimated numbers of persons living with a diagnosis of HIV infection ranged from 124 in the Provo-Orem, UT MSA to 140,988 in the New York, NY-NJ-PA MSA.
- Slide 43: Rates of persons living with a diagnosis of HIV infection, by Metropolitan Statistical Area (MSA) of residence, year-end 2009 - 46 states and Puerto Rico At the end of 2009, in the 46 states and Puerto Rico with confidential name-based HIV infection reporting since at least January 2007, the estimated rate of persons living with a diagnosis of HIV infection in MSAs with over 500,000 population was 342.8 per 100,000 population. The estimated rates of persons living with a diagnosis of HIV infection ranged from 22.4 per 100,000 population in the Provo-Orem, UT MSA to 868.5 per 100,000 population in the Miami, FL MSA.
- 5: Slide 44: AIDS diagnoses by Metropolitan Statistical Area (MSA) of residence, 2010 - United States and Puerto Rico In 2010, in the US and Puerto Rico, the estimated number of AIDS diagnoses in MSAs with over 500,000 population was 27,429. The estimated numbers of AIDS diagnoses ranged from 4 in the Provo-Orem, UT MSA to 4,318 in the New York, NY-NJ-PA MSA.
- Slide 45: Rates of AIDS diagnoses, by Metropolitan Statistical Area (MSA) of residence, 2010 - United States and Puerto Rico In 2010, in the US and Puerto Rico, the estimated rate of AIDS diagnoses in MSAs with over 500,000 population was 13.4 per 100,000 population. The estimated rates of AIDS diagnoses ranged from 0.7 per 100,000 population in the Provo-Orem, UT MSA to 33.7 per 100,000 population in the Baton Rouge, LA MSA.
- Slide 46: Persons living with an AIDS diagnosis, by Metropolitan Statistical Area (MSA) of residence, year-end 2009 - United States and Puerto Rico At the end of 2009, in the US and Puerto Rico, the estimated number of persons living with an AIDS diagnosis in MSAs with over 500,000 population was 407,727. The estimated numbers of persons living with an AIDS diagnosis ranged from 73 in the Provo-Orem, UT MSA to 84,703 in the New York, NY-NJ-PA MSA.
- Slide 47: Rates of persons living with an AIDS diagnosis, by Metropolitan Statistical Area (MSA) of residence, year-end 2009 - United States and Puerto Rico At the end of 2009, in the US and Puerto Rico, the estimated rate of persons living with an AIDS diagnosis in MSAs with over 500,000 population was 198.7 per 100,000 population. The estimated rates of persons living with an AIDS diagnosis ranged from 13.1 per 100,000 population in the Provo-Orem, UT MSA to 473.0 per 100,000 population in the Miami, FL MSA.
- Slide 48: Cumulative AIDS diagnoses, through 2010, among children aged <13 years, by Metropolitan Statistical Area (MSA) of residence - United States and Puerto Rico At the end of 2010, in the US and Puerto Rico, the estimated cumulative number of AIDS diagnoses among children aged < 13 years was 8,528. The estimated cumulative numbers of AIDS diagnoses among children ranged from zero in the Boise City–Nampa, ID MSA and the Youngstown–Warren–Boardman, OH–PA MSA to 3,008 in the New York, NY-NJ-PA MSA.
- Slide 49: Cumulative AIDS diagnoses, through 2010, among adults and adolescents, by Metropolitan Statistical Area (MSA) of residence - United States and Puerto Rico At the end of 2010, in the US and Puerto Rico, the estimated cumulative number of AIDS diagnoses among adolescents and adults (aged 13 years or older) was 973,372. The estimated cumulative numbers of AIDS diagnoses among adolescents and adults ranged from 137 in the Provo-Orem, UT MSA to 221,281 in the New York, NY-NJ-PA MSA.
- Slide 50: Cumulative AIDS diagnoses, through 2010, by Metropolitan Statistical Area (MSA) of residence - United States and Puerto Rico At the end of 2010, in the US and Puerto Rico, the estimated cumulative number of AIDS diagnoses was 981,899. The estimated cumulative numbers of AIDS diagnoses ranged from 140 in the Provo-Orem, UT MSA to 224,289 in the New York, NY-NJ-PA MSA.