Equity Valuations Perspective | ICICI Prudential Mutual Fund
•
0 j'aime•108 vues

Get a bird's eye view on Equity Markets through our Equity Valuations Perspective that highlights the degree of attractiveness of markets based on our VCTS framework.

Recommandé
Recommandé
Contenu connexe
Tendances
Tendances (18)
Similaire à Equity Valuations Perspective | ICICI Prudential Mutual Fund
Similaire à Equity Valuations Perspective | ICICI Prudential Mutual Fund (20)
Plus de iciciprumf
Plus de iciciprumf (20)
Dernier
Dernier (20)
Equity Valuations Perspective | ICICI Prudential Mutual Fund
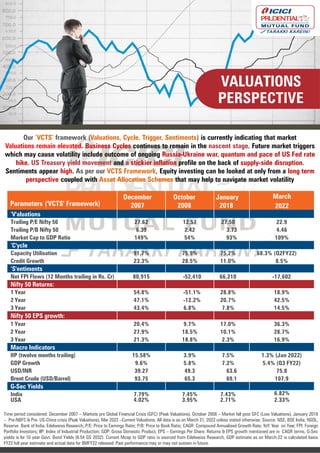
- 1. VALUATIONS PERSPECTIVE Our ‘VCTS’ framework (Valuations, Cycle, Trigger, Sentiments) is currently indicating that market Valuations remain elevated. Business Cycles continues to remain in the nascent stage. Future market triggers which may cause volatility include outcome of ongoing Russia-Ukraine war, quantum and pace of US Fed rate hike, US Treasury yield movement and a stickier inflation profile on the back of supply-side disruption. Sentiments appear high. As per our VCTS Framework, Equity investing can be looked at only from a long term perspective coupled with Asset Allocation Schemes that may help to navigate market volatility Time period considered: December 2007 – Markets pre Global Financial Crisis (GFC) (Peak Valuations), October 2008 – Market fall post GFC (Low Valuations), January 2018 – Pre-NBFC & Pre- US-China crisis (Peak Valuations), Mar 2022 –Current Valuations. All data is as on March 31, 2022 unless stated otherwise. Source: NSE, BSE India, NSDL, Reserve Bank of India, Edelweiss Research,.P/E: Price to Earnings Ratio; P/B: Price to Book Ratio; CAGR: Compound Annualised Growth Rate; YoY: Year on Year; FPI: Foreign Portfolio Investors; IIP: Index of Industrial Production; GDP: Gross Domestic Product, EPS – Earnings Per Share. Returns & EPS growth mentioned are in CAGR terms. G-Sec yields is for 10 year Govt. Bond Yields (6.54 GS 2032). Current Mcap to GDP ratio is sourced from Edelweiss Research, GDP estimate as on March-22 is calculated basis FY22 full year estimate and actual data for 9MFY22 released. Past performance may or may not sustain in future. Parameters ('VCTS' Framework) December 2007 October 2008 January 2018 March 2022 ‘V'aluations Trailing P/E Nifty 50 27.62 12.57 27.50 22.9 Trailing P/B Nifty 50 6.39 2.42 3.73 4.46 Market Cap to GDP Ratio 149% 54% 93% 109% ‘C'ycle Capacity Utilisation 91.7% 75.9% 75.2% 68.3% (Q2FY22) Credit Growth 23.3% 28.5% 11.0% 8.5% ‘S'entiments Net FPI Flows (12 Months trailing in Rs. Cr) 80,915 -52,410 66,210 -17,602 Nifty 50 Returns: 1 Year 54.8% -51.1% 28.8% 18.9% 2 Year 47.1% -12.2% 20.7% 42.5% 3 Year 43.4% 6.8% 7.8% 14.5% Nifty 50 EPS growth: 1 Year 20.4% 9.7% 17.0% 36.3% 2 Year 27.9% 18.5% 10.1% 28.7% 3 Year 21.3% 18.8% 2.3% 16.9% Macro Indicators IIP (twelve months trailing) 15.58% 3.9% 7.5% 1.3% (Jan 2022) GDP Growth 9.6% 5.8% 7.2% 5.4% (Q3 FY22) USD/INR 39.27 49.3 63.6 75.8 Brent Crude (USD/Barrel) 93.75 65.3 69.1 107.9 G-Sec Yields India 7.79% 7.45% 7.43% 6.82% USA 4.02% 3.95% 2.71% 2.33%
- 2. The ‘VCTS’ (Valuations, Cycle, Trigger, Sentiments) framework is a market checklist which can be used to determine market valuations/conditions for investment at any given point in time. The framework can find application across asset classes. It aims to navigate markets efficiently by reflecting on various data points used in the framework. PE – Price-to-Earnings; PBV – Price to Book Value Ratio; COVID-19 is Coronavirus disease 2019. The information contained herein is only for the purpose of information and not for distribution and do not constitute an offer to buy or sell or solicitation of any offer to buy or sell any securities or financial instruments in the United States of America (“US”) and/or Canada or for the benefit of US persons (being persons falling within the definition of the term “US Person” under the US Securities Act, 1933, as amended) or persons residing in Canada. MUTUAL FUND INVESTMENTS ARE SUBJECT TO MARKET RISKS, READ ALL SCHEME RELATED DOCUMENTS CAREFULLY Parameters ('VCTS' Framework) Market V aluations P/E or PBV helps in ascertaining whether the market is expensive or cheap Business C ycle Indicators like capacity utilization or credit growth help in understanding the strength of business cycle T riggers Triggers are events which can have impact on the overall equity market S entiments Sentiments helps in understanding investors affinity towards the equity market Buy - Valuations Cheap Sell - Valuations Expensive Buy - Cycle is weak Sell - Cycle is Strong Triggers - Unpredictable event like COVID-19, Geo- Political Tensions Buy - Negative Sentiments Sell - Positive Sentiments