Geo-spatial analysis for effective technology targeting
•Télécharger en tant que PPTX, PDF•
1 j'aime•355 vues

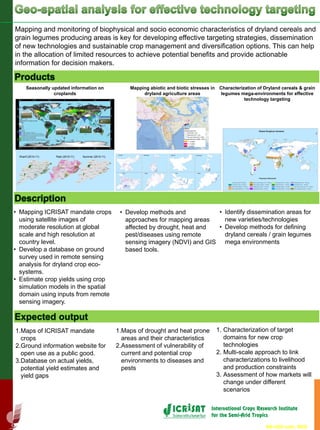
Mapping and monitoring of biophysical and socio economic characteristics of dryland cereals and grain legumes producing areas is key for developing effective targeting strategies, dissemination of new technologies and sustainable crop management and diversification options. This can help in the allocation of limited resources to achieve potential benefits and provide actionable information for decision makers.

Recommandé
Recommandé
Contenu connexe
Tendances
Tendances (20)
Similaire à Geo-spatial analysis for effective technology targeting
Similaire à Geo-spatial analysis for effective technology targeting (20)
Plus de ICRISAT
Plus de ICRISAT (20)
Dernier
Dernier (20)
Geo-spatial analysis for effective technology targeting
- 1. Mapping and monitoring of biophysical and socio economic characteristics of dryland cereals and grain legumes producing areas is key for developing effective targeting strategies, dissemination of new technologies and sustainable crop management and diversification options. This can help in the allocation of limited resources to achieve potential benefits and provide actionable information for decision makers. 1.Maps of ICRISAT mandate crops 2.Ground information website for open use as a public good. 3.Database on actual yields, potential yield estimates and yield gaps • Develop methods and approaches for mapping areas affected by drought, heat and pest/diseases using remote sensing imagery (NDVI) and GIS based tools. Seasonally updated information on croplands Mapping abiotic and biotic stresses in dryland agriculture areas • Mapping ICRISAT mandate crops using satellite images of moderate resolution at global scale and high resolution at country level. • Develop a database on ground survey used in remote sensing analysis for dryland crop eco- systems. • Estimate crop yields using crop simulation models in the spatial domain using inputs from remote sensing imagery. 1.Maps of drought and heat prone areas and their characteristics 2.Assessment of vulnerability of current and potential crop environments to diseases and pests 1. Characterization of target domains for new crop technologies 2. Multi-scale approach to link characterizations to livelihood and production constraints 3. Assessment of how markets will change under different scenarios • Identify dissemination areas for new varieties/technologies • Develop methods for defining dryland cereals / grain legumes mega environments Kharif (2010-11) Rabi (2010-11) Summer (2010-11) Characterization of Dryland cereals & grain legumes mega-environments for effective technology targeting RS-GIS unit, RDS
- 2. Despite growing demands for food production because of an increasing population, in South Asia there are vast areas of land left fallow. When there is insufficient irrigation for year-round cropping, lands are left fallow after the cultivation of rainfed rice, and even after irrigated rice. After the rice harvest there is often adequate stored soil moisture, along with any subsequent rainfall, to support a following crop, at least one of short duration. Legume yields are often poor and, as a result large areas with the potential for cultivating a post-rice crop are left fallow. The main reasons for this are the suite of agronomic difficulties in establishing and growing a crop after rice, where a hard plough-pan is deliberately created to retain water for rice culture. However, there are now proven technologies available (e.g., short-duration legume varieties, seed treatments, mechanization) that would make it feasible and profitable to increase the area of land to grow post-rice crops. Successful demonstration and extension of these technologies would open the way for greater income generation by the economically disadvantaged rice cultivators of South Asia, who presently have few options for enterprise diversification. Mapping post-rice fallows and rabi fallows using remote sensing imagery will help identify areas for demonstration and dissemination of this technology which are potential areas. Cropping pattern changesLand use change dynamics 1. Land use changes are a regular phenomenon due to agro-ecological, socio-economic and policy decisions. Some changes are so significant that they make a large difference in the agro-economic scenario of the place, specifically when water availability affects critically the decision making of the small holder farmers. Chickpea expansion in some districts of Andhra Pradesh is a good example of such change. Chickpea growing areas expanded in these districts gradually replacing another crop since there was a good economic gain in growing it. Less farm operations and mechanization also promoted this crop. 2. Remotely sensed imagery can be effectively used to monitor cropland changes and identify the niches for present changes in cropping pattern and its impact. 2000-01 2012-13 Land use / land cover Groundnut / sorghum / fallows Maize / mixed crops Cotton-chilli Orchards / mixed crops Rice-mixed crops Other LULC Chickpea RS-GIS unit, RDS Tracking of crop expansion / yield estimations and impact Andhra Pradesh
- 3. The use of remote sensing, GPS and GIS as tools to understand tracking the adoption of NRM technologies such as RHS, provides a spatial dimension to the method. Remotely sensed imagery provides temporal spatial information on the change dynamics of LULC an important characteristic variable which depends on the adoption of RHS. A ground information collection mission for LULC mapping provides first-hand information of the cropping pattern and also facilitates interaction with the village level extension officers and farmers. Global Positioning System (GPS) instrument is used to collect the location coordinates of the RHS which is the most economical when compared to using remote sensing imagery. It is also constrained by the spatial resolution of the remote sensing imagery and cloud cover during the rainy season when it is the ideal time. Whereas the very high resolution imagery (GeoEye) becomes very costly to identify a RHS and can also be contaminated by cloud cover, it yields similar information on LULC for higher cost than the normal resolution imagery (LANDSAT, IRS LISS IV etc) which is very economical. An integration of two sources of information from the ground using GPS and farmer interviews along with spatial information on LULC using remote sensing imagery will not only track the adoption of RHS but also provides the impact of adoption of this technology. It can also be said that this method of using spatial information along with ground information will make it easier to scale up and scale out such methods over larger domains. Base maps (Drainage, watershed and settlements) Monitoring rainwater harvesting structures • Use of open datasets such as SRTM DEM (90m) to delineate and do basic morphometric analysis • Use of IRS-LISS IV, Landsat imagery and MODIS were used to prepare Land use/ Landover (LULC) maps and changes in LULC during selected years. • Data on source of irrigation before and after adoption of RHS identifies the relationship between RHS adoption and availability of groundwater for irrigation. • Analyze and understand the reasons for adoption and inturn impact of adoption as a result of LULC changes. Impact of rainwater harvesting structures RS-GIS unit, RDS
- 4. Where should we disseminate short duration chickpea varieties and where could we possibly expand chickpea cultivation? An accurate and up-to-date chickpea area map is essential for supporting dryland agriculture. To answer these questions as part of the CRP-grain legumes, the ICRISAT RS-GIS lab has developed a methodology to (i) accurately map major cropland areas in Andhra Pradesh, (ii) classify these areas as either rainfed or irrigated, and (iii) identify the cropping patterns. • Satellite data: MODIS 16-day composites (MOD13Q1 product) were used to calculate two indices—the Normalized Difference Vegetation Indices (NDVI) and the NDVI Monthly Maximum Value Composites (NDVI-MVC)—using surface reflectance values from the red (620–670 nm) and NIR1 (841–875 nm) bands. The NDVI-MVC was used for classification and the NDVI 16-day dataset was used for identifying and labeling seasonal rice classes. • Extensive ground survey data: Ground-survey information was collected between 12 to 22 January 2012 (during the rabi season) for 449 sample sites covering the major crop-growing areas (which includes groundwater, irrigated surface water, and rainfed areas) across Andhra Pradesh. In addition, field crop observations were made extensively while driving, by capturing other locations for additional information at 365 locations for accuracy assessment. • Agriculture census data. • Secondary data (e.g., Google Earth, rainfall data, etc.). MODIS 16-day 250-m composites of surface reflectance product (MOD13Q1) Unsupervised classification (NDVI-MVC) Class spectra Ideal spectra using Ground survey data Grouping of similar classes by decision tree algorithms and spectral matching techniques (SMTs) Class identification and labeling process Class spectra (NDVI-MVC) Is class identified?Chickpea crop extent No Mixed class Accuracy assessment Mask mixed over NDVI-MVC NDVI-MVC and NDVI 16-day composites Class spectra (NDVI 8-day) Ground survey data Google Earth data Yes Area calculations and comparisons A comprehensive methodology for mapping seasonal rice areas using MODIS 16-day 250m data was developed (Fig. 1). Fig. 1. Methodology flowchart. Land use / land cover Groundnut / sorghum / fallows Maize / mixed crops Cotton-chilli Orchards / mixed crops Rice-mixed crops Other LULC Chickpea Year 2012-13 We observed and mapped the distinct NDVI phenological signatures in Andhra Pradesh for Irrigated rice-rice, irrigated rice-fallow, Rainfed fallow-chickpea (rabi chickpea) and other major crops. We developed a 6-major crop dominance classes (Fig. 2) for 2012-13. The chickpea areas were compared against the official chickpea areas provided by the Andhra Pradesh Bureau of Statistics for each of the districts in the state. There was a very strong correspondence between the MODIS-derived area and the reported area—R2 values of 84%. A quantitative accuracy assessment across the 6 major crop classes estimated an overall accuracy of 86%, but this varied from 54% to 100% across classes. Almost all of the intermixing or misclassification was between various rainfed classes. This is the most recent and accurate map of the crop dominance in Andhra Pradesh. Mapping major cropland areas is the first step in characterizing important chickpea-growing environments for sustainable grain-legumes development and livelihoods. Detailed and up-to-date maps are important inputs for assessing the impact of droughts, heat stress and yield predictions which regularly affect the region. Fig. 2. Spatial distribution of major crops cultivation for 2012-13. RS-GIS unit, RDS Crop identification and mapping using moderate resolution imagery is usually not possible, unless the temporal resolution is high or spectral resolution is very high. The growing season of a short duration chickpea typically fits in a temporal window where NDVI signatures are used to identify the crop easily. Similarly crops can be identified using different methods depending on their growing period, growth habits and biomass.