Generating three dimensional photo-realistic model of
•
1 j'aime•602 vues

IJRET : International Journal of Research in Engineering and Technology is an international peer reviewed, online journal published by eSAT Publishing House for the enhancement of research in various disciplines of Engineering and Technology. The aim and scope of the journal is to provide an academic medium and an important reference for the advancement and dissemination of research results that support high-level learning, teaching and research in the fields of Engineering and Technology. We bring together Scientists, Academician, Field Engineers, Scholars and Students of related fields of Engineering and Technology.

Recommandé
Recommandé
Contenu connexe
Tendances
Tendances (17)
En vedette
En vedette (20)
Similaire à Generating three dimensional photo-realistic model of
Similaire à Generating three dimensional photo-realistic model of (20)
Plus de eSAT Publishing House
Plus de eSAT Publishing House (20)
Dernier
Dernier (20)
Generating three dimensional photo-realistic model of
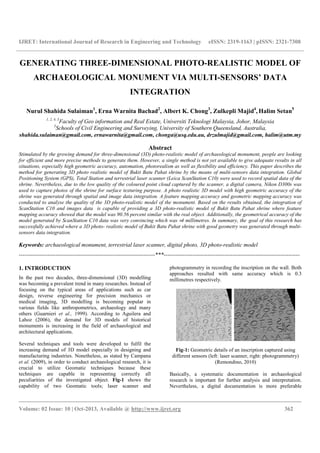
- 1. IJRET: International Journal of Research in Engineering and Technology eISSN: 2319-1163 | pISSN: 2321-7308 __________________________________________________________________________________________ Volume: 02 Issue: 10 | Oct-2013, Available @ http://www.ijret.org 362 GENERATING THREE-DIMENSIONAL PHOTO-REALISTIC MODEL OF ARCHAEOLOGICAL MONUMENT VIA MULTI-SENSORS’ DATA INTEGRATION Nurul Shahida Sulaiman1 , Erna Warnita Bachad2 , Albert K. Chong3 , Zulkepli Majid4 , Halim Setan5 1, 2, 4, 5 Faculty of Geo information and Real Estate, Universiti Teknologi Malaysia, Johor, Malaysia 3 Schools of Civil Engineering and Surveying, University of Southern Queensland, Australia, shahida.sulaiman@gmail.com, ernawarnita@gmail.com, chonga@usq.edu.au, drzulmajid@gmail.com, halim@utm.my Abstract Stimulated by the growing demand for three-dimensional (3D) photo-realistic model of archaeological monument, people are looking for efficient and more precise methods to generate them. However, a single method is not yet available to give adequate results in all situations, especially high geometric accuracy, automation, photorealism as well as flexibility and efficiency. This paper describes the method for generating 3D photo realistic model of Bukit Batu Pahat shrine by the means of multi-sensors data integration. Global Positioning System (GPS), Total Station and terrestrial laser scanner (Leica ScanStation C10) were used to record spatial data of the shrine. Nevertheless, due to the low quality of the coloured point cloud captured by the scanner, a digital camera, Nikon D300s was used to capture photos of the shrine for surface texturing purpose. A photo realistic 3D model with high geometric accuracy of the shrine was generated through spatial and image data integration. A feature mapping accuracy and geometric mapping accuracy was conducted to analyse the quality of the 3D photo-realistic model of the monument. Based on the results obtained, the integration of ScanStation C10 and images data is capable of providing a 3D photo-realistic model of Bukit Batu Pahat shrine where feature mapping accuracy showed that the model was 90.56 percent similar with the real object. Additionally, the geometrical accuracy of the model generated by ScanStation C10 data was very convincing which was ±4 millimetres. In summary, the goal of this research has successfully achieved where a 3D photo- realistic model of Bukit Batu Pahat shrine with good geometry was generated through multi- sensors data integration. Keywords: archaeological monument, terrestrial laser scanner, digital photo, 3D photo-realistic model -----------------------------------------------------------------------***----------------------------------------------------------------------- 1. INTRODUCTION In the past two decades, three-dimensional (3D) modelling was becoming a prevalent trend in many researches. Instead of focusing on the typical areas of applications such as car design, reverse engineering for precision mechanics or medical imaging, 3D modelling is becoming popular in various fields like anthropometrics, archaeology and many others (Guarnieri et al., 1999). According to Aguilera and Lahoz (2006), the demand for 3D models of historical monuments is increasing in the field of archaeological and architectural applications. Several techniques and tools were developed to fulfil the increasing demand of 3D model especially in designing and manufacturing industries. Nonetheless, as stated by Campana et al. (2009), in order to conduct archaeological research, it is crucial to utilize Geomatic techniques because these techniques are capable in representing correctly all peculiarities of the investigated object. Fig-1 shows the capability of two Geomatic tools; laser scanner and photogrammetry in recording the inscription on the wall. Both approaches resulted with same accuracy which is 0.3 millimetres respectively. Fig-1: Geometric details of an inscription captured using different sensors (left: laser scanner, right: photogrammetry) (Remondino, 2010) Basically, a systematic documentation in archaeological research is important for further analysis and interpretation. Nevertheless, a digital documentation is more preferable
- 2. IJRET: International Journal of Research in Engineering and Technology eISSN: 2319-1163 | pISSN: 2321-7308 __________________________________________________________________________________________ Volume: 02 Issue: 10 | Oct-2013, Available @ http://www.ijret.org 363 because analysis and interpretation can be done virtually without worrying about access limitation or physical damage of the remains. Hence, image-based method (i.e. photogrammetry), range-based method (i.e. laser scanning) and integration between the two methods are suitable approaches to be used as they are non-contact methods that prevent handling damage of archaeological remains, applicable in various scales and yet the sensors, processing software and analysis tools have become available in recent years (Lambers and Remondino, 2007). In this research, the archaeological area is approximately 48 x 40 metres which contains hundreds of religious artefacts and a temple or shrine. In order to generate highly accurate geometric and photo-realistic model, several Geomatic tools were used to record spatial and texture data of the shrine. Terrestrial laser scanner, Leica ScanStation C10, was used to collect spatial information of the structure while Nikon D300s digital camera was used to capture high resolution images. Network control for georeferencing purpose was established around the area by using Global Positioning System (GPS) and total station. A modelling methodology was carried out by integrating data from all the sensors. 2. RELATED WORKS In archaeology, a systematic and well-judged use of Geomatic techniques for documentation and digital conservation purposes is relatively a recent innovation, not yet applied on a regular basis for a variety of reasons; the perceived ‘high cost’ of capturing 3D, the difficulties in achieving good 3D models, the difficulty of integrating 3D worlds with other 2D data and traditional documentations and the perception that 3D is only an additional ‘aesthetic’ factor (Campana et al., 2008). However, the available technologies and methodologies for digital recording of archaeological sites and objects are really promising and the whole heritage community is trying to adapt these approaches for fastest, detailed and easy 3D documentation (Campana and Remondino, 2009). Methods and techniques chosen for archaeological monument documentation should be the most effective, least destructive, most efficient and economical means of obtaining the needed information. In the beginning, there was only a short range laser scanner and mainly used in the automotive and industrial design process to facilitate the data capture for Computer Aided Design (CAD) process. Nevertheless, since technology keeps evolving, other potential fields were exploited. Due to outstanding advantages of laser scanning; non contact measurement, high accuracy, long range, fast data acquisition, etc., other disciplines like cultural heritage, architecture, urban development, forensics, and the entertainment industry were starting to adopt this technology (Heine, 2004). When dealing with archaeological structure documentation, end user normally require a geometric documentation of the monument as a final product. Primarily, geometric documentation of archaeology monument is very important because it consists of a series of measurements, from which visual products such as vector drawings, raster images, 3D visualizations etc. may be produced (Georgopoulos and Ioannidis, 2004). Georgopoulos and Ioannidis (2004) also stressed that the products’ scale, purpose and accuracy requirement must be defined first before starting the documentation process (Table-1). This is because the scale of the final product implies the level of detail yield eventually. Table-1: The mapping scale requirement for geometric documentation (Georgopoulos and Ioannidis, 2004) A geometric documentation of a monument contains measurement of the objects which will be used for restoration or reconstruction work of the monument. The selection of recording type will be based on the accuracy demanded by the client. More accurate geometric documentation of the monument will require lots of effort and the process of collecting and producing the output will be more complicated. Table-2 shows the accuracy requirement needed in archaeological site recording. Table-2: Accuracy requirement in archaeological site recording (Georgopoulos and Ioannidis, 2004) Terrestrial laser scanning technology is becoming increasingly popular recently as the scanning devices become more reliable, cheaper, faster and more portable (Fang et al., 2009). By taking into consideration about the size of the objects, the distance between object and scanner, the surface of the object Geometric Documentation Scale Purpose 1:100 – 1:250 General surveys, in order to relate the monument to its immediate surroundings 1:20 – 1:50 Geometric recording cases providing a highly detailed product for practically any sort of study less than 1:20 Drawings of special details of interest Type of Recording Purpose Accuracy Requirement Normal Recording Structural / Building / Others ± 2cm Plans / Elevation / Cross Section ± 10cm Detailed Recording Building / monument ±2mm to ±5mm Building Plans / Elevation / Cross Section ± 10mm to ±25mm
- 3. IJRET: International Journal of Research in Engineering and Technology eISSN: 2319-1163 | pISSN: 2321-7308 __________________________________________________________________________________________ Volume: 02 Issue: 10 | Oct-2013, Available @ http://www.ijret.org 364 and the accuracy requirement, a suitable type of range scanner is chosen. Lambers and Remondino (2007) stated that there are three scales of archaeological research where Geomatic techniques and methodologies can be applied. Table-3 shows the detail on the scale of archaeological site and the suitable Geomatic tool to be implemented (Lambers and Remondino, 2007), (Guidi et al., 2008), (Abdullah, 2005). Table-3: Size of archaeology site versus suitable Geomatic tools (modified from Lambers and Remondino, 2007) During conventional recordings, different people often have to draw the features and the results are non-homogeneous drawings. Basically, the accuracy for manual drawing is 25 millimetres which required a lot of time, focus and skills in the documentation process. However, the accuracy requirement for geometric documentation of archaeology monument is 70 millimetres to few millimetres (Georgopoulos and Ioannidis, 2004). Additionally, a laser scanner can achieve up to 2.00 millimetres accuracy when the measuring range is less than 120 metres with 50000 points per second. The need of combining multiple techniques, like terrestrial laser scanning, photogrammetry and digital surveying is the result of the complexity of some structures and by the lack of a single technique capable of giving satisfactory results in all measuring conditions (Gonzo et al., 2007). There is no single method that is applicable of recording every subject of cultural heritage and hence there is a strong demand for a hybrid method that exploits several technologies (Kadobayashi et al., 2004). The advantage of using laser scanning is that it can produce a very dense 3D point cloud data which is a crucial requirement for creating high-resolution geometric models (Fig-2). On the other hand, digital photogrammetry can produce high-resolution texture if the original images have sufficient resolution (Fig-2). Thus, the integration of these two technologies is indeed a key to create high quality 3D recordings and presentations. Fig-2: Porta' de Santiago; Image (left). 3D textured model (Ong et al., 2010) 3. SITE DESCRIPTION AND CURRENT DOCUMENTATION IN BUJANG VALLEY Being situated at the southern tip of Asian mainland, Peninsular Malaysia which is also located between the major trades centres of China in the East and India and Arab world in the west seems to contribute enormously in the maritime trade. Thus, it possesses some remarkable archaeology sites that are significant and require preservation such as in Lenggong Valley and Bujang Valley. Bujang Valleys is the home of an impressive, well-preserved historical complex that is capable of eliciting awe and wonderment for those who come to visit the ancient site. To date, more than 80 archaeology sites have been discovered in the valley (New Straits Times, 2008). According to Nik Hassan Shuhami (2004), among of all excavated sites, 60 sites were thought to have been religious shrines. The most prominent shrines discovered in the valley are Bukit Batu Pahat shrine (Site 8), Bukit Choras shrine (Site 1), Bendang Dalam shrine (Site 50) and Pengkalan Bujang shrine (Site 21). Nevertheless, archaeological activities in Malaysia are progressing slowly due to the lack of expertise in archaeological field, the use of conservative technique for documentation purpose (Fig-3) and less awareness among Malaysian on the important of preserving the remains. Archaeology and conservation activity in Malaysia has started in early 1990s and it is far left behind compared to other develop countries which have started these activities since 1960s (Nik Hassan Shuhaimi, 2006). Size of Archaeo logy Site Object of Interest Available Geomatic Approaches Geometric Resolution (per pixel) Regional Landscape Topograph y Sites / Monument -Middle and high- resolution satellite imagery -Small scale aerial images -Airborne LiDAR IKONOS: 1 m QUICKBIRD: 0.6m 0.50 m - 0.75 m 0.75 m - 3.0 m Local Sites / Monument Architectur es Excavation Layers -Large scale aerial images -Terrestrial laser scanner -Terrestrial images. -10 cm- 25 cm -5 mm - 20 mm -0.5 mm - 10.0 mm Object Excavated artefacts Museum objects -Terrestrial images. -Close-range laser scanner -0.5 mm - 10.0 mm -0.3 mm
- 4. IJRET: International Journal of Research in Engineering and Technology eISSN: 2319-1163 | pISSN: 2321-7308 __________________________________________________________________________________________ Volume: 02 Issue: 10 | Oct-2013, Available @ http://www.ijret.org 365 Fig-3: Conventional methods used in Malaysia archaeological research (Patel, 2009) An analogue filing system is used by the administration which seems to be impractical due to the increasing excavation activities, require bigger storage space, redundancy of information forms for artefacts and misinterpretation of handwriting. Hence, it is a crucial requirement for researches to develop a digital documentation system to improve the existing documentation method in Malaysia. Thus, this research is a pilot project in implementing new method for providing digital data of archaeological site in Bujang Valley. An archaeological site, Bukit Batu Pahat shrine (Fig-4) which has been excavated was chosen as a study area where the shrine is modelled into 3D photo-realistic model. Fig-4: Location of the study area; Bujang Valley and Bukit Batu Pahat shrine 4. METHODOLOGY Numerous methods were developed to generate 3D model of archaeological monument. Unfortunately, most contributions were focusing either on a single sensor i.e. camera or integration between range sensor and image sensor. Conversely, this paper attempts to reveal the integration process involving various sensors with different spatial resolution and types of data. Multiple sensors were used in site survey and archaeological monument mapping phase. Site survey provides coordinate information of the monument with respect to the real terrain world while archaeological monument mapping provides information such as geometrical characteristic and texture of the structure. Based on Fig-5, this research focused with two activities that involved in documenting archaeological monument; site survey and monument mapping. Site survey is a task where control points with known mapping coordinates are established around the archaeological site. GPS static observation was conducted where two points were observed. As to the production of a precise model, a control network was established by using a total station. Coordinate yield from site survey task is used to georeference the model. In monument mapping phase, two sensors were used to collect spatial and texture data of the shrine. Leica ScanStation C10 (terrestrial laser scanner) was used to collect spatial data of the shrine. The data collected were in the form of 3D point cloud. In the mean time, the scanner also captured images using a built-in camera inside the scanner itself. It has been proven in many researches that images captured from a built-in camera in a scanner provide only low quality of images and thus affecting the result for photo-realistic model especially for an outdoor task. Hence, a high resolution digital camera was used to capture images of the shrine. The images were then fused with the laser scanner data to get a 3D photo-realistic model of the monument with good geometrical accuracy.
- 5. IJRET: International Journal of Research in Engineering and Technology eISSN: 2319-1163 | pISSN: 2321-7308 __________________________________________________________________________________________ Volume: 02 Issue: 10 | Oct-2013, Available @ http://www.ijret.org 366 Site Survey Global Positioning System (GPS) Archaeological Site Monument Monument Mapping Total Station Terrestrial Laser Scanner Digital Camera Coordinate data (.txt) Traverse data Point Cloud data (.bin) Digital images(.jpg) Point Cloud Processing (Leica Cyclone) Point cloudregistration and alignment using Cyclone Giving GPScoordinates toall traversing points 3DMesh Model (.rsh) Texturing the Mesh (3D Reshaper 7.1) 3DPhoto-realistic Model (.rsh) Photo-realistic Model Evaluation (FeatureMapping Accuracy) 3DModels Visualization in 3DReshaper Viewer DataCollection RawDataProcessingand3D Modelling 3DModelEvaluationand Visualization Creating 3DMesh (3DReshaper 7.1) 3DPoint Cloud Model (.xyz) Georeferencing Selected Digital Images (.jpg) Mesh Model Evaluation (Geometric Mapping Accuracy) Combinepoint cloud data from Faro scanner (.fls) Fig-5: Workflow to generate 3D photo-realistic model of Bukit Batu Pahat shrine 4.1 Data Acquisition 4.1.1 Site Survey Site survey at Bukit Batu Pahat shrine was conducted using GPS and a Total Station. Two points were observed using GPS with static mode within an hour (Fig-6). The coordinates of the two points were referred to Malaysian Cassini State Plane coordinate. The same points were then used during traversing process. Four points were established during traversing around the shrine. The points were marked permanently because the same points are needed to locate the scanner during scanning process. Fig-6: Location of GPS points, traverse points and respective coordinates for each point 4.1.2 Scanning the Monument The second phase in recording archaeological monument is to map spatial information and features of the monument. Therefore, the monument mapping phase is divided into two parts; spatial data acquisition using terrestrial laser scanner and features data acquisition using high-resolution digital camera. Fundamentally, before a structure is scanned, the area must be observed first to plan the location of scanning stations and to decide suitable places to put the target. If the targets are not enough, user may also used checkerboard target that can be directly printed from Cyclone software. Before scanning is conducted, all the targets were placed covering the object where at least three targets can be seen from two consecutive stations. Direct georeferencing method was used where the scanner was setup at the exact points established during the traversing process. This is because; the points have coordinates observed using GPS. Hence, traversing and scanning using terrestrial laser scanner can be carried out using the same reference frame. The requirement for spatial information of the monument is that the data is in the form of digital information. Thus, the data can be used for various purposes such as analysis by archaeologists, study by researches, archive by preservation and conservation department and used in tourism activities. Consequently, the manipulation of the data can be carried out while the existing monument in the site is preserved. A terrestrial laser scanner, Leica ScanStation C10 was used to record 3D spatial information of Bukit Batu Pahat shrine. Initially, a survey planning is made by defining the purpose of mapping the monument, accuracy demanded and determining the deliverables as required by the clients. This was followed by a site observation task to know the complexity of the structure, number of scanning station and target location. After defining the requirement and complexity of the structure, the method or equipment to be used in the data acquisition is
- 6. IJRET: International Journal of Research in Engineering and Technology eISSN: 2319-1163 | pISSN: 2321-7308 __________________________________________________________________________________________ Volume: 02 Issue: 10 | Oct-2013, Available @ http://www.ijret.org 367 confirmed. In this research, the required deliverable is a 3D photo-realistic model of Bukit Batu Pahat shrine with accurate geometric model. The project name, resolution of scanning, mode of scanning either scan with image or just scan, space available in the storage and method of scanning (traverse and scanning, scanning only) must be verified first. For Bukit Batu Pahat shrine, the resolution used was high resolution (0.05 meter of point spacing), method of scanning was traverse and scan and mode of scanning was scan with image. Scanning with high resolution would take about forty five minutes for each scan station. Each HDS target was scanned before scanning the whole site. Even though it seems difficult, but this step could reduce the processing time later. Images were captured by a built-in camera (4 megapixels) inside the scanner after each scanning finished. Scanning process was continued until the area of the shrine was fully covered. Fig-7 illustrates the position of scanning stations and targets distribution around Bukit Batu Pahat shrine. Fig-7: Target distribution and location of scanning stations 4.1.3 Capturing High-Resolution Images Museums are keen on presenting their collection in a more appealing and exciting manner using the digital media to attract visitors to view virtually and visit the physical museum site. According to White et al. (2004), current surveys show that about 35% of museums have already started developments with some form of 3D presentation of objects. Development of 3D laser scanner has brought a whole new landscape to the recording and study of historical and cultural heritage. Nevertheless, the drawback of laser scanner is that colour images of an object cannot be obtained or even it is possible, the quality of the colour images are worst than that of the photographs (Kodabayashi et al., 2004). Fig-8 shows coloured point cloud generated by Leica Scan Station C10. Hence, digital photographs were taken by using Nikon DSLR D300s with 10.2 megapixels. Fig-8: Coloured point cloud of Bukit Batu Pahat shrine provided by Lieca Scan Station C10 Instead of providing colour information for the scanning points, digital images have also been used to extract information on edges and linear surface features in order to bridge gaps in the laser scanner data and to add new details to improve the realistic perception of the scene (Alshawabkeh and Haala, 2004). If a direct photo-shots texture mapping is used for texturing the 3D point clouds, the photographs must have been captured by a high resolution camera located perpendicular with the object (Al – Hanbali and Awamleh, 2010). The high-resolution images were used for texturing the 3D model to get a better photo-realistic 3D model. 4.2 Data Processing The main goal of this research was to integrate data from various sensors in order to generate 3D photo-realistic model of Bukit Batu Pahat shrine. Nevertheless, data from each sensor must be processed first before they can be integrated. Thus, there were three data processing tasks involved in this research; point cloud registration, point cloud modelling and texturing the 3D model. 4.2.1 Point Cloud Registration Registration is the process of merging every ScanWorld contained in a project into a single registered ScanWorld. The process of registering the ScanWorlds was carried out by systematically merges two contiguous ScanWorlds via corresponding constraints or corresponding point cloud appeared in both ScanWorlds. There were two methods of registration provided by Cyclone 7.3; (1) combining the ScanWorlds via corresponding target or constraint such as HDS target or black and white target, (2) combining the ScanWorlds via cloud-to-cloud method where at least three corresponding points from each ScanWorlds was chosen as common points to merge two ScanWorlds. Eventually, all the ScanWorlds were merged together to form a complete 3D point cloud model of Bukit Batu Pahat shrine.
- 7. IJRET: International Journal of Research in Engineering and Technology eISSN: 2319-1163 | pISSN: 2321-7308 __________________________________________________________________________________________ Volume: 02 Issue: 10 | Oct-2013, Available @ http://www.ijret.org 368 Generally, more constraints or corresponding points marked could give better result. However, Cyclone requires only three corresponding points to merge two ScanWorlds. Once the points were selected, Constraint menu was chosen from the Cloud Constraint wizard to add the constraints into the database. Error might occur whereby the constraint was not accepted. In this issue, any bad point was removed and other point is selected. In the Optimize Constraint stage the constraints were analyzed whether they could be used for the registration or vice versa. Fig-9 shows the scanning data sets that acquired from different scanning points before and after the registration process. Before registration After registration Fig-9: Bukit Batu Pahat shrine; before and after registration 4.2.2 Point Cloud Modelling A point-based representation of an object can give satisfactory result only when the object is viewed in a small scale. But when viewing in a large scale, the point cloud model started to deteriorate and what can be seen is just points scattered randomly. Therefore, the point clouds are modelled into a surface mesh, which best represent the reality. A mesh model is a collection of contiguous polygons that combine along their edges. In this research, a mesh model of Bukit Batu Pahat monument is indeed the basis for various 3D model generations such as 3D photo-realistic and 3D geometric model of the structure. The process of meshing the point cloud model was carried out using 3D Reshaper 7.1 software. Once a mesh model of the shrine was produced, the results were analyzed based on the triangles that covered holes in the model, the existing of anomalous points and the edges of the structure. If the result was poor, the point cloud model was re- processed by changing the parameters value. Two critical parameters were considered when creating a mesh using 3D Reshaper 7.1; average distance between points and triangle sizes. Smaller value for average distance between points could produce a surface like the real surface because the points were denser and more triangles were created. In addition, for any small holes detected, the software automatically detected and filled the holes with triangles. Thus, smaller triangles could increase the sharpness of edges. 4.2.3 Texturing the 3D Mesh Model Although the most important aspect in documenting an archaeological monument is the geometry of the structure, preserving its texture is also essential because a photorealistic model can be used for virtual advertising and further conservation purpose (Aries et al., 2005). Concern on the arising demand in archaeological documentation, this research was carried out to find a method to deliver both metric and textured 3D model of archaeological monument. Moreover, instead of providing method to generate 3D photo-realistic model of archaeological remains, this research was also intended to find an alternative for better digital visualization, preservation method and documentation of archaeological remains. By having a quality 3D textured model, it could improve the effectiveness of data dissemination among archaeologists, researchers, historians, students and tourists. In this research, Reference point’s method was chosen to map digital images onto the 3D mesh model. It is suggested to mark at least four pairs of corresponding points if the image has perspective projection (Fig-10). Nevertheless, higher number of points is essential for image that has distortions. When all the points defined and marked correctly, the image can be applied onto the 3D mesh model. Fig-11 shows the result before and after applying digital image onto 3D mesh model.
- 8. IJRET: International Journal of Research in Engineering and Technology eISSN: 2319-1163 | pISSN: 2321-7308 __________________________________________________________________________________________ Volume: 02 Issue: 10 | Oct-2013, Available @ http://www.ijret.org 369 Fig-10: Corresponding points are marked on the 3D mesh model and images Fig-11: Mesh model and image integration 5. RESULTS AND ANALYSIS 5.1 Mesh Model and Geometric Mapping Analysis In this research, a third party software, 3D Reshaper 7.1 was used to texture Bukit Batu Pahat shrine with external digital images. Nevertheless, integrating both laser scanning and digital images data was not a straightforward process. The 3D point cloud model must be transformed into a 3D mesh model. A mesh model is important for controlling the quality of the 3D model where it keeps only the most relevant points of the object and optimized the size of the 3D model. Indeed, by transforming millions of points into one entity, allows other 3D modelling software to make used the model for other applications such as reverse engineering, animations and photo-realistic rendering. The 3D mesh model of Bukit Batu Pahat shrine was quite impressive although there were several small holes. However, after enhancing the 3D mesh model using tools like smoothing and filling holes, the 3D mesh model was ready to be textured with high-resolution digital images. Besides that, there was no spike or noise in the 3D mesh model because the points have been clean-up before meshing process started. A geometric mapping accuracy was applied onto the 3D mesh model where, several measurements of the shrine were made on site using measurement tape and compare with the measurements done virtually in 3D Reshaper 7.1. Fig-12 illustrates the measurement conducted in 3D Reshaper 7.1 while the measurements results are tabulated in Table-4. Based on the measurement results tabulated in Table-4, the differences between two measurement methods was 1 millimetre (minimum) to 7 millimetres (maximum). On the other hand, the RMS value for the measurements is approximately 4 millimetres. By referring to Table-2, the geometric accuracy requirement for detailed monument recording was between ± 2 millimetres until ±5 millimetres. Thus, from the result obtained, it showed that laser scanning data was capable of providing the required geometric accuracy in detailed monument recording. Fig-12: Measurements of the shrine for geometric accuracy validation
- 9. IJRET: International Journal of Research in Engineering and Technology eISSN: 2319-1163 | pISSN: 2321-7308 __________________________________________________________________________________________ Volume: 02 Issue: 10 | Oct-2013, Available @ http://www.ijret.org 370 Table-4: Comparison between on site measurements and virtual measurements Segment On-Site Measurement (m) Virtual Measurement (m) Deviation (m) a 10.596 10.603 0.007 b 23.966 23.963 0.003 c 10.320 10.314 0.006 d 13.462 13.458 0.004 e 10.654 10.656 0.002 f 10.730 10.733 0.003 g 0.374 0.373 0.001 Root mean square (RMS) value 0.004 5.2 Photo-Realistic Model and Feature Mapping Analysis Although the geometric accuracy of the mesh model was impressive and the model has been used as a base for texturing process, it does not mean that the 3D photo-realistic model would turn out to be as good as the mesh model result. Hence, an analysis called feature mapping analysis was carried out to evaluate the quality of the photo-realistic model by comparing the 3D photo-realistic model with digital images of the shrine. A feature mapping accuracy was chosen as an approach to evaluate how closed was the feature in 3D photo-realistic model with the real monument. Several identical features of the 3D photo-realistic model were compared with the corresponding images. The identical features such as the colour, holes and broken rock were chosen as the criteria to evaluate the quality of the 3D photo-realistic model. Thus, for the first parameter in feature mapping analysis, the colour of the 3D photo-realistic model was compared with high resolution images to know the accuracy of merging two different types of data. Several areas were selected for each parameter to be analyzed and the results are tabulated in Table-5, Table-6 and Table-7 respectively. Each area contained one to three selected spots that were used for detailed comparison. Table -5: Feature mapping analysis – comparing colours of the shrine Feature Mapping Analysis (Colour) 3D Photo-Realistic Model High Resolution Images Simila r Spots 3/3 3/3 3/3 2/3 Quality (%) [Number of similar spot/Total spot] x 100 91.67 By referring to Table-5, the colour quality of Bukit Batu Pahat shrine was approximately 91.67% matched with the real objects. The spots chosen were based on the uncommon colour or noticeable features appeared in the area such as a pink target marked on the shrine, white colour at certain rock and peculiar rock location. Eleven out of twelve spots possessed the same colour like the real monument. Only one spot was detected to be difference with the image. This might be due to the location of the spot, which was at the edge of the image. Thus, the image was slightly distorted and affected the colour of the rectangular rock (covered with green moss). Consequently, the rock became non-rectangular shape because the colour was only applied at certain part of the rock.
- 10. IJRET: International Journal of Research in Engineering and Technology eISSN: 2319-1163 | pISSN: 2321-7308 __________________________________________________________________________________________ Volume: 02 Issue: 10 | Oct-2013, Available @ http://www.ijret.org 371 Table-6: Feature mapping analysis – comparing holes of the shrine Feature Mapping Analysis (Holes) 3D Photo-Realistic Model High Resolution Images Similari ty 3/3 1/2 Quality (%) [Number of similar spots/Total spot] x 100 80.00 Bukit Batu Pahat shrine is a structure built from rocks obtained from a river. The structure is not cemented to cover holes between the rocks. As a result, there are many holes in the structure. These holes are considered as one parameter to analyze the quality of the photo-realistic model. Based on Table-6, 80% of holes are well presented in the 3D photo- realistic model. The shape of the holes is maintained without any distortion. However, there was one hole, which was not well presented in the model. This was caused by the shape of the mesh model that was not quite good. Thus, when an image tried overlapped with the mesh mode, the image tended to cover the whole mesh even the structure was a little bit different than the real one. In conclusion, features like holes could be well-preserved in the photo-realistic model if the mesh model or the base model was constructed accurately. Table-7: Feature mapping analysis – comparing broken rock of the shrine Feature Mapping Analysis (Broken Rock) 3D Photo-Realistic Model High Resolution Images Similari ty 1/1 2/2 Quality (%) [Number of similar spots/Total spot] x 100 100.00 Broken rocks were the third parameter used to analyze the quality of the 3D photo-realistic model. This feature was selected because it was the most obvious feature of the shrine. Yet the existing of broken structure can help archaeologist to identify the changes or deformation of the monument and they can plan for maintenance process. According to Table-7, the broken rocks are 100% textured without changing their shape. However, there is a small broken part undergoes image distortion because the image is not attached perpendicular to the broken part. This problem can be overcome by capturing an image perpendicular with the broken surface and map it to the mesh model. Generating a 3D photo-realistic model of a structure is not an easy task. It requires proper data collection planning, systematic data management and smart way of data processing. In this research, the structure of the shrine is quite big thus required longer time to integrate both image and scanner data. An automatic texture menu in 3D Reshaper 7.1 is very helpful to achieve the main objective of this research. Several problems were realized during integrating the data. First of all, the image must be captured perpendicular and closer to the structure (fit with the camera frame). This is to ensure that the process of texturing run smoothly. Besides that, it is important to capture the image with common features such as the edge to ease the process of marking the corresponding points. CONCLUSIONS This research was conducted to produce 3D photo-realistic model with required geometric accuracy of archaeological monument via multi-sensors data integration. In conclusion, the resulting 3D photo-realistic model was convincing because, most of the important features like the colour or the texture, existing holes and broken parts were well preserved in the virtual model. Hence, archaeologists and researchers can use the model to do their research or analysis without travelling to Bujang Valley. The result of the 3D photo- realistic model can be visualized in Reshaper Viewer 2013 where user can display the model (zoom and rotating) and do some measurement onto the model.
- 11. IJRET: International Journal of Research in Engineering and Technology eISSN: 2319-1163 | pISSN: 2321-7308 __________________________________________________________________________________________ Volume: 02 Issue: 10 | Oct-2013, Available @ http://www.ijret.org 372 ACKNOWLEDGEMENTS We would like to express our gratitude and thanks to the Director and staff of Bujang Valley Archaeological Museum, Malaysia for their supportive cooperation, priceless help and guidance throughout the data collection and interviewing session. REFERENCES [1]. Guarnieri, F. Marton, A. Vettore. (1999). 3D Modelling of Real Artistic Objects with Limited Computers Resources. Centre of Cartography and Photogrammetry (CIRGEO), University of Padua, Italy. Retrieved on 06 January 2012 from cipa.icomos.org/fileadmin/papers/olinda/99c415.pdf [2]. Aguilera, D.G. and Lahoz J. G. (2006). Laser scanning or Image-based Modelling? A Comparative through the Modelization of San Nicolas Church. International Archives of Photogrammetry and Remote Sensing, Volume XXXVI, B5, Dresden [3]. Campana, S., Sordini, M. and Rizzi, A. (2009). 3D Modelling of Romanesque Church in Tuscany: Archaeological Aims and Geomatics Techniques. In proceedings of 3rd International Workshop 3D ARCH 2009, Trento, Italy: 25-28 [4]. Remondino, F. (2010). Sensors and Data Integration for 3D Modelling Applications. International Summer School “3D Modelling in Archaeology and Cultural Heritage 2010”, 17-20 June 2010, Durham, United Kingdom [5]. Lambers, K. and Remondino, F. (2007). Optical 3D Measurement Techniques in Archaeology: Recent Developments and Applications. First publication in: Layers of Perception: Proceedings of the 35th International Conference on Computer Applications and Quantitative Methods in Archaeology (CAA), Berlin, Germany, April 2-6, 2007 / Ed. by Axel Posluschny ... Bonn: Habelt, 2008, pp. 27- 35 [6]. Campana, S., Sordini, M., and Remondino, F., (2008) Integration of Geomatic Techniques for the Digital Documentation of Heritage Areas. EARSEL workshop Advances in Remote Sensing in the Archaeology and the management of Cultural Heritage, Rome, Italy [7]. Campana, S. and Remondino, F. (2009). Fast and Detailed Digital Documentation of Archaeological Excavations and Heritage Artifacts. 35th CAA Conference (Computer Applications and Quantitative Methods in Archaeology), pp 36-42, Berlin, Germany, April 2007. [8]. Heine, E. (2004). 3D Risk Mapping: Theory and Practice on Terrestrial Laser Scanning Training Material Based on Practical Applications. (4th ed.). VLAAMS Leonardo da Vinci Agentschap: Netherland [9]. Georgopoulos, A. and Ionnidis, C. (2004). Photogrammetric and Surveying Methods for the Geometric Recording of Archaeological Monuments. Workshop - Archaeological Surveys. FIG Working Week 2004. 22-27 May. Athens, Greece [10]. Fang, S., George, B. and Palakal, M. (2009). Automatic Surface Scanning of 3D Artifacts. The International Journal of Virtual Reality. 8(4), pg. 67-72 [11]. Guidi, G., Remondino, F., Russo, M., Menna, F. and Rizzi, A. (2008). 3D Modeling of Large and Complex Site Using Multi-sensor Integration and Multi-resolution Data. The 9th International Symposium on Virtual Reality, Archaeology and Cultural Heritage VAST (2008), 2-5 December. Braga, Portugal, 85-92 [12]. Abdullah Mah (2005). Quickbird Versus Aerial Photos in Identifying Man-Made Objects. 1st National GIS Symposium in Saudi Arabia. 28 July, Jeddah, Saudi Arabia [13]. Gonzo, L., Voltolini, F., Girardi, S., Rizzi, A., Remondino, F. and El-Hakim, S. F. (2007). Multiple Techniques Approach to the 3D Virtual Reconstruction of Cultural Heritage. Eurographics Italian Chapter Conference 2007 [14]. Kadobayashi, R., Kochi, N., Otani, H. and Furukawa, R. (2004). Comparison and Evaluation of Laser Scanning and Photogrammetry and Their Combined Use for Digital Recording of Cultural Heritage, ISPRS Comm. V Sym. [15]. Ong, C. W., Cheong, S. W., Zulkepli, M. and Halim, S. (2010). 3D Documentation And Preservation of Historical Monument using Terrestrial Laser Scanning. Geoinformation Science Journal, Vol. 10, No. 1, 2010, pp: 73-90 [16]. News Straits Times (2008). Zoom Malaysia – Gone but not Forgotten. (2008, December 10). New Straits Times: Tourism Special, pg. 1-11 [17]. Nik Hassan Shuhaimi Nik Abdul Rahman (2004). The Encyclopedia of Malaysia: Early History. (4th ed.). Kuala Lumpur, Malaysia: Archipelago Press [18]. Nik Hassan Shuhaimi Nik Abdul Rahman (2006). Kepentingan Arkeologi Dalam Kerja Konservasi Monumen Dan Tapak Tanah Bersejarah. Course on Monument Conservation and Archaeological Sites. Pulau Pinang [19]. Patel, A. (2009). High Definition Documentation to Enhance the Interpretation of Archaeological Structures and Sites. Degrees of Master in Architecture, Texas Tech University, USA [20]. White, M., Mourkoussis, N., Darcy, J., Petridis, P., Liarokapis, F., Lister, P., Walczak, K., Wojciechowski, R., Cellary, W., Chmielewski, J., Stawniak, M., Wiza, W., Patel, M., Stevenson, J., Manley, J., Giorgini, F., Sayd, P. and Gaspard, F. (2004). Proceedings of the Computer Graphics International 2004. 16 – 19 June 2004. Greece, pg 1 – 4. [21]. Alshawabkeh, Y. and Haala, N. (2004). Integration of Digital Photogrammetry and Laser Scanning for Heritage Documentation. International Archives of Photogrammetry and Remote Sensing. Vol.5. Istanbul, Turkey [22]. Al-Hanbali, N. N., Albayari, O., Saleh, B., Almasri, H. and Baltsavias, E. (2006). Macro to Micro Archeological Documentation: Building a 3d GIS Model for Jerash City and Artemis Temple. Alias Abdul-Rahman, Zlatanova, S. and Coors, V. (Eds.) Innovation in 3D Geo Information Systems. New York: Springer Berlin Heidelberg
- 12. IJRET: International Journal of Research in Engineering and Technology eISSN: 2319-1163 | pISSN: 2321-7308 __________________________________________________________________________________________ Volume: 02 Issue: 10 | Oct-2013, Available @ http://www.ijret.org 373 BIOGRAPHIES Nurul Shahida Binti Sulaiman Researcher in Photogrammetry & Laser Scanning Research Group (PLSRG) Bsc in Geomatic Engineering, Faculty of Geoinformation & Real Estate, Universiti Teknologi Malaysia Area of interest: LiDAR and 3D modelling Erna Warnita Binti Bachad Researcher in Photogrammetry & Laser Scanning Research Group (PLSRG) Bsc in Geoinformation Science, Faculty of Geoinformation & Real Estate, Universiti Teknologi Malaysia Area of interest: GIS and LiDAR Dr Albert Kon-Fook Chong Senior Lecturer School of Civil Engineering and Surveying, University of Southern Queensland Phd from Washington Area of interest: Photogrammetry, 3D modelling, Information Database Design Assoc. Professor Dr Zulkepli Bin Majid Associate Professor Faculty of Geo information & Real Estate, Universiti Teknologi Malaysia Phd from Malaysia Area of interest: Photogrammetry, 3D modelling, Laser Scanning, GIS Professor Halim Bin Setan Professor Faculty of Geoinformation & Real Estate, Universiti Teknologi Malaysia Phd from United Kingdom Area of interest: Laser Scanning, Deformation Survey and Surveying Engineering