2. Model parameters for the cropping constraint were taken
from 15 studies of functional responses of 12 ruminant species
ranging in size from 20 to 750kg (table 1). We recorded para-
meters that measured intake on two types of swards: simple
swards composed solely of grass leaf or forbs and complex
swards using whole grass tillers or intact grass communities.
In studies where Michaelis^Menten parameters were not
reported, we calculated them using available information. Gross
et al. (1993) report cropping rates relative to plant size using the
Spalinger & Hobbs (1992) form of the functional response. We
calculated b from their data by multiplying Rmax by h (average
minutes per plant) and plant density (plantm¡2
). Murray &
Brown (1993) reported cropping rates as a multiple regression of
green-leaf biomass, crude protein and stem density. We calcu-
lated cropping rates relative to green-leaf biomass alone by
substituting mid-range values for crude protein and stem density
they report and determined Michaelis^Menten parameters from
their data using nonlinear regression.
We modelled daily intake on swards ranging from 0 to 300g m¡2
using a typical data set from the Serengeti ecosystem relating grass
quality to grass biomass (Wilmshurst et al. 1999). This data set is
also relevant to our subsequent empirical test of habitat use by the
guild of Serengeti grazers. Within this range of grass biomass,
digestible energy (DE) content is a linear function of its in vitro
digestible organic matter (IVDOM) content (Rittenhouse et al.
1971) that is, in turn a function of forage neutral detergent
¢bre (NDF) content and animal body mass (IVDOM
ˆ 90.170.53 £NDF(%) + 0.013 £M, F2,297 ˆ78.6, p50.001,
r2
ˆ 0.35; H. Meissner personal communication). NDFalso varies
linearly with biomass up to 300 g m¡2
(F1,23 ˆ7.5, p ˆ 0.01,
r2
ˆ 0.25), although this relationship tends to be nonlinear across
broader ranges of grassbiomass due to saturating NDFcontent on
dense swards (Breman & de Wit 1983; Hobbs & Swift 1985;
Gordon 1989). Hence, across the range of sward biomass we
modelled, DE(%) ˆ 65.670.27 £ biomass (g m¡2
). ME content
of the forage was calculated as 82% of DE (Van Soest 1982).
Given a standard combustible energy content per gram of grass,
Q(M) is calculated as ME(%) £ 17.1 (MJ g¡1
) (Golley1961).
We calculated the digestion constraint as daily dry matter
consumption under ad libitum feeding conditions multiplied by
forage quality. Digestion constraints relative to body size were
derived from a study of DVI for six ruminant species ranging in
size between 30 and 550kg (Meissner & Paulsmeier 1995).
While voluntary intake may not always represent maximum
daily intake due to variation in animal state or behaviour (Baile
& Forbes 1974) it is a useful estimate of ad libitum daily intake.
Meissner & Paulsmeier (1995) reported that DVI scaled isome-
trically to forage quality but allometrically (M0.9
) to body mass.
We modelled digestion constraints as a multiple regression equa-
tion relating both per cent NDF of grass and animal body mass
to DVI (kg dry matter day71
):
DVI ˆ 2:5 ¡ 0:049 £ %NDF ‡ 0:061 £ M0:9
, (2)
(r2
ˆ 0.95) (H. Meissner, personal communication). Kilograms
DVI were converted as above to DVI of ME. From this function
we calculated I2:
I2(M) ˆ DVI £ Q (M). (3)
To account for phylogenetic relationships, we created dummy
variables to represent family and tribe classi¢cations (Harvey &
Pagel 1991). Model predictions of optimal grass biomass and
maximum energy intake for each species listed in table 1 were
tested for dependency to body mass, sward type and phylogeny
using stepwise multiple regression. Relationships among signi¢-
cant e¡ects were determined using ANCOVA.
(b) Field data
The Serengeti ecosystem of East Africa provides an excellent
setting to test model predictions. Due to a complex pattern of
localized rainfall, a substantial range of grass densities is avail-
able to the diverse guild of Serengeti grazers in a small area. To
measure local herbivore densities, we drove twenty-¢ve 220-km
long ground transects on the Serengeti plain (2832.1’S, 34857’ E
to 2856.1’S, 34821’E) during the growing seasons of 1994 to
1996. All large herbivores visible within an arc extending 200 m
to the sides and front of the driver were counted at two random
locations in each kilometre of transect. At each location the
height and percentage cover of green vegetation was measured
using visual estimation (Daubenmire1959). These measurements
were calibrated to grass biomass (g m¡2
) using clip-plots from
which quality relationships were also determined (Wilmshurst et
al. 1999). Five herbivore species were found in su¤cient abun-
dance for analyses: Thomson’s gazelles (Gazella thomsoni), Grant’s
gazelles (Gazella granti), hartebeest (Alcelaphus buselaphus), wilde-
beest (Connochaetes taurinus), and topi (Damaliscus lunatus). Grant’s
gazelles have a 50 kg body mass (Estes 1991); body masses of the
other species are listed in table 1.
3. RESULTS
Predicted optimal sward biomass was dependent on
body mass and on the complexity of the sward on which
functional response parameters were measured, but not
on phylogeny. On simple swards, cropping constraints
346 J. F.Wilmshurst and others Ruminant patch selection and allometry
Proc. R. Soc. Lond. B (2000)
40
30
10
20
0
1007550
grass biomass (g m- 2
)
MEintake(MJday-1
)
0 25
cropping
digestion
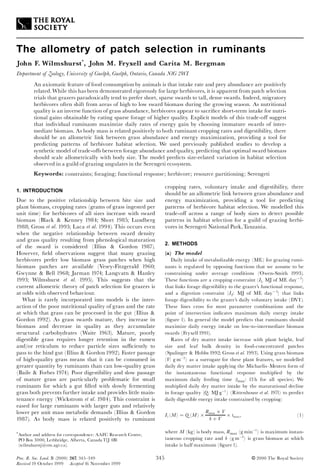
Figure 1. Daily ME intake constraint curves for Thomson’s
gazelle grazing on complex swards (parameters given in
table 1). The cropping constraint (I1) is the maximum
amount of energy an individual can consume daily in the
absence of digestion constraints and the digestion constraint
(I2) is the maximum amount of energy an individual can
process daily in the absence of cropping constraints. Realized
daily ME intake as a function of sward biomass tracks the
minimum of the two constraint lines. The point of intersection
identi¢es the maximum daily ME intake on the ordinate and
the optimal grass biomass on the abscissa.
3. increased steeply, intersecting the digestion constraint at
low biomass (¢gure 2). On complex swards, functional
responses increased more gradually, causing the
constraints to intersect at an order of magnitude higher
biomass (¢gure 2). This e¡ect of sward structure has been
shown using experimental manipulation of sward
complexity in trials featuring grazing bison (Bergman et
al. 2000).
Predicted maximum energy intake rates were a positive
linear function of body mass and phylogenetic relatedness
but were not related to sward type (¢gure 3). The energy
function scaled to M0.86
indicating a stronger link
between energy maximization and digestion constraints,
which scaled to M0.90
(Meissner & Paulsmeier 1995), than
to cropping constraints, which scaled to M0.73
(Shipley et
al. 1994). The realized metabolic rate for mammals is
approximately two to three times the basal metabolic rate
(Peters 1983), suggesting that our estimates of maximum
metabolic energy gain (approximately 3.5 times the daily
Ruminant patch selection and allometry J. F.Wilmshurst and others 347
Proc. R. Soc. Lond. B (2000)
Table 1. List of species parameters used to model constraint curves
species mass (kg) Rmax (g min¡1
) b (g m¡2
) sources
Thomson’s gazellea
(Gazella thomsoni) 20 6.42 16.6 Wilmshurst et al. (1999)
sheepa
(Ovis aries) 42 7.02 30.8 Black & Kenney (1984)
mule deera
(Odocoileus hemionus) 42 2.22 1.97 Wickstrom et al. (1984)
white-tailed deerb
(Odocoileus virginianus) 45 9.17 3.03 Gross et al. (1993)
axis deerb
(Axis axis) 53 8.42 2.27 Gross et al. (1993)
reindeera
(Rangifer tarandus) 70 6.37 31.7 Trudell & White (1981)
topib
(Damaliscus lunatus) 75 17.0 10.6 Murray & Brown (1993)
hartebeestb
(Alcelaphus buselaphus) 92 11.9 8.54 Murray & Brown (1993)
wildebeestb
(Connochaetes taurinus) 97 20.2 9.94 Murray & Brown (1993)
cariboub
(Rangifer tarandus) 104 16.3 7.82 Gross et al. (1993)
wapiti (yearling)a
(Cervus elaphus) 170 31.2 160.4 Wilmshurst et al. (1995)
bison (yearling)b
(Bison bison) 180 54.8 99.2 Bergman et al. (2000)
elkb
(Cervus elaphus) 266 47.4 71.2 Gross et al. (1993)
cowb
(Bos taurus) 548 74.6 24.6 Gross et al. (1993)
cowa
(Bos taurus) 750 129.5 688.6 Laca et al. (1992, 1994)
a
Complex sward trials.
b
Simple sward trials.
3
1
2
0
3.02.52.0
log10 body mass (kg)
log10optimalgrassbiomass(gm-2
)
1.0 1.5
Figure 2. Optimal grass biomass relative to body mass
for modelled ruminants listed in table 1. The open points
represent trials conducted on complex grass swards,
described by the function log10 y ˆ 70.088+ 0.86 £ log10 x
(dashed line). The ¢lled points represent trials conducted
on simple, leafy swards, and are described by the function
log10 y ˆ 71.05 + 0.86 £ log10 x (solid line). Slopes are
homogeneous (F1,11 ˆ 0.27, p ˆ 0.87 for heterogeneity) and
multiple regression including body mass and sward complexity
con¢rmed the signi¢cance of linear functions (F2,12 ˆ 32.8,
p50.001, r2
ˆ 0.86).
2.5
1.5
2.0
0.5
3.02.52.0
log10 body mass (kg)
log10MEintake(MJday-1
)
1.0
1.0
1.5
Figure 3. Maximum daily ME intake relative to ruminant
body mass. The open points represent cervids, described by
the function log10 y ˆ 70.302+ 0.91£log10 x (dashed line).
The ¢lled points represent bovids, described by the function
log10 y ˆ 70.29 + 0.91£log10 x (solid line). Slopes are
homogeneous (F1,11 ˆ 0.24, p ˆ 0.63 for heterogeneity) and
multiple regression including body mass and family con¢rmed
the signi¢cance of linear functions (F2,12 ˆ 9524.7, p50.001,
r2
ˆ 0.99). The dotted line is the basal (ME) requirements
relative to body mass (MJ day¡1
ˆ0.45£kg0.73
) (Konoplev et
al. 1978).
4. metabolic requirement for Artiodactyla (¢gure 2)), realis-
tically predict maximum daily values.
Biomass of patches on which Serengeti grazers were
observed was a function of their body mass. Treating the
density of each species in each year independently, there
was a signi¢cant positive relationship between body mass
and mean sward biomass of patches they occupied
(log10 biomass (g m¡2
) ˆ 1.5 + 0.22 £ log10 body mass (kg),
F1,13 ˆ5.4, p ˆ 0.04, r2 ˆ 0.3). The observed pattern better
matched the predictions derived from complex swards
than those from simple swards; nevertheless the slope of
the observed relationship among species was shallower
than predicted by the model (0.22 compared with 0.86).
4. DISCUSSION
The sward biomass on which ruminants optimize
energy gain is a positive, decelerating function of body
mass. This re£ects a gradual shift in the intersection of
the digestion constraint and the cropping constraint from
low biomass swards for small ruminants, to swards of
higher biomass for large ruminants with commensurately
larger gut capacity. Thus, the positive relationship
between optimal sward biomass and ruminant body mass
is the result of both a relaxation of digestion constraints
(Meissner & Paulsmeier 1995) and increasing bite size
(Gross et al. 1993) in larger ruminants.
Our assumption that energy gain by ruminants is a
hump-shaped function of grass abundance (Fryxell 1991)
makes our work fundamentally di¡erent from previous
allometric models. We found that body mass-related
habitat selection can result purely from individual energy
maximization, independent of either plant species selec-
tivity or interspeci¢c competition and that, in general,
ruminant herbivores should prefer short, intermediate
biomass swards over tall, high biomass swards. In Illius
and Gordon’s (1987) allometric model of energy function
in ruminants, daily energy gain is a positive function of
grass abundance, thus predicting that tall, high biomass
patches should be preferred by grazing ruminants regard-
less of body size. They predict a positive relationship
between ruminant body mass and grass biomass, as do
we, but resulting from competition for tall, high biomass
swards. Their model cannot explain the selection by
ruminants of low biomass swards when tall, high biomass
swards are available (McNaughton 1984; Langvatn &
Hanley 1993; Wallis DeVries & Schippers 1994; Wilm-
shurst et al. 1995, 2000; Bradbury et al. 1996).
It is interesting that we found no impact of phylogeny
on predicted optimal sward biomass, as this prediction is
strongly a¡ected by the form of the functional response,
which is presumably under morphological control. Never-
theless, we did ¢nd a slight di¡erence between cervids
and bovids with respect to maximum daily energy gain
(¢gure 3). This suggests at least marginal phylogenetic
linkage between muzzle architecture and body mass,
which has been postulated in other analyses of ruminant
foraging strategies (Gordon & Illius 1988).
The positive relationship we found between herbivore
body mass and sward biomass in the surveys of Serengeti
herbivores lends qualitative support to the idea that allo-
metric scaling in gut passage and cropping in ruminants
is linked to patch selection. There is a tendency for small
ruminants to be found on lower biomass patches than
larger ruminants during the growing season as predicted
by our model. Several processes could account for the
deviation of our model from the Serengeti observations. If
sward complexity is positively related to grass biomass
then predictions of optimal grass biomass for small rumi-
nants would conform to the simple sward regression
model and predictions of optimal grass biomass for large
ruminants would conform to the complex sward regres-
sion model (¢gure 2). Thus, the e¡ects of sward
complexity would predict a much shallower slope than
predicted by either model. In addition, by choosing rela-
tively simple representations of forage intake constraints,
we ignore processes such as competition and predation
that in£uence on herbivore distributions in the Serengeti
(Sinclair 1985; Hofer & East 1993; Durant 1998). Indeed
we found an inverse relationship between body mass and
how closely their observed patch choice matched that
predicted, perhaps the result of larger animals excluding
smaller animals from preferred patches.
These results lend theoretical and empirical support to
the hypothesis that there is size-speci¢c ecological separa-
tion among grazing herbivores on the basis of di¡erential
foraging e¤ciency (Murray & Brown 1993). The gradient
between optimal patch and body mass suggests that
herbivores of similar body size and feeding style may be
competing. Our work also suggests that large ruminants
should perform better on more productive grasslands
than do small ruminants, with the converse true of low-
productivity grasslands. In highly productive grasslands
in which tillers grow and lose quality rapidly (Braun
1973), large-bodied ruminants are favoured.
This research was supported by an Ontario Graduate Scholar-
ship to J.F.W., a Natural Science and Engineering Research
Council (NSERC) operating grant to J.M.F. and an NSERC
postgraduate scholarship to C.M.B. We are very grateful to H.
Meissner and the University of Pretoria for voluntary intake
data, A. Illius and M. Murray for functional response para-
meters and J. M. Gaillard and T. D. Nudds for valuable
comments on the manuscript. We also thank A. R. E. Sinclair,
Tanzania National Parks, Serengeti Wildlife Research Institute
and theTanzaniaWildlife Corporation.
REFERENCES
Baile, C. A. & Forbes, J. M. 1974 Control of feed intake and
regulation of energy balance in ruminants. Physiol. Rev. 54,
160^214.
Bergman, C. M., Fryxell, J. M. & Gates, C. C. 2000 The e¡ect
of tissue complexity and sward height on the functional
response of wood bison. Funct. Ecol. (In the press.)
Black, J. L. & Kenney, P. A. 1984 Factors a¡ecting diet selection
by sheep. II. Height and density of pasture. Aust. J. Agric. Res.
35, 565^578.
Bradbury, J. W., Vehrencamp, S. L., Clifton, K. E. & Clifton,
L. M. 1996 The relationship between bite rate and local
forage abundance in wild Thomson’s gazelles. Ecology 77,
2237^2255.
Braun, H. M. H. 1973 Primary production in the Serengeti;
purpose, methods and some results of research. Ann. Univ.
Abidjan E 6, 171^188.
Breman, H. & de Wit, C. T. 1983 Rangeland productivity and
exploitation in the Sahel. Science 221, 1341^1347.
Daubenmire, R. 1959 A canopy-coverage method of vegeta-
tional analysis. Northw. Sci. 33, 43^64.
348 J. F.Wilmshurst and others Ruminant patch selection and allometry
Proc. R. Soc. Lond. B (2000)
5. Durant, S. M. 1998 Competition refuges and coexistence: an
example from Serengeti carnivores. J. Anim. Ecol. 67, 370^386.
Estes, R. D. 1991 The behavior guide to African mammals. London:
University of California Press.
Fryxell, J. M. 1991 Forage quality and aggregation by large
herbivores. Am. Nat. 138, 478^498.
Golley, F. B. 1961 Energy values of ecological materials. Ecology
42, 581^584.
Gordon, I. J. 1989 Vegetation community selection by ungulates
on the isle of Rhum. I. Food supply. J. Appl. Ecol. 26, 35^51.
Gordon, I. J. & Illius, A. W. 1988 Incisor arcade structure and
diet selection in ruminants. J. Anim. Ecol. 2, 15^22.
Gross, J. E., Shipley, L. A., Hobbs, N. T., Spalinger, D. E. &
Wunder, B. A. 1993 Functional response of herbivores in food-
concentrated patches: tests of a mechanistic model. Ecology 74,
778^791.
Gwynne, M. D. & Bell, R. H. V. 1968 Selection of vegetation
components by grazing ungulates in the Serengeti National
Park. Nature 220, 390^393.
Harvey, P. H. & Pagel, M. D. 1991 The comparative method in evolu-
tionary biology. Oxford University Press.
Hobbs, N. T. & Swift, D. M. 1985 Estimates of habitat carrying
capacity incorporating explicit nutritional constraints. J.
Wildl. Mgmt 49, 814^822.
Hofer, H. & East, M. L. 1993 The commuting system of
Serengeti spotted hyaenas: how a predator copes with migra-
tory prey. II. Intrusion pressure and commuters’ space use.
Anim. Behav. 46, 559^574.
Illius, A. W. & Gordon, I. J. 1987 The allometry of food intake
in grazing ruminants. J. Anim. Ecol. 56, 989^999.
Illius, A. W. & Gordon, I. J. 1992 Modelling the nutritional
ecology of ungulate herbivores: evolution of body size and
competitive interactions. Oecologia 89, 428^434.
Jarman, P. J. 1974 The social organisation of antelope in relation
to their ecology. Behaviour 48, 215^266.
Konoplev, V. A., Sokolov, V. E. & Zotin, A. L. 1978 Criterion of
orderliness and some problems of taxonomy. In
Thermodynamics of biological processes (ed. I. Lamprecht & A. L.
Lotin), pp. 349^359. Berlin: deGruyter.
Laca, E. A., Ungar, E. D., Seligman, N. & Demment, M. W.
1992 E¡ects of sward height and bulk density on bite dimen-
sions of cattle grazing homogeneous swards. Grass Forage Sci.
47, 91^102.
Laca, E. A., Ungar, E. D. & Demment, M. W. 1994
Mechanisms of handling time and intake rate of a large
mammalian grazer. Appl. Anim. Behav. Sci. 39, 3^19.
Langvatn, R. & Hanley, T. A. 1993 Feeding-patch choice by red
deer in relation to foraging e¤ciency. Oecologia 95, 164^170.
Lundberg, P. 1988 Functional response of a small mammalian
herbivore: the disc equation revisited. J. Anim. Ecol. 57,
999^1006.
McNaughton, S. J. 1984 Grazing lawns: animals in herds, plant
form and coevolution. Am. Nat. 124, 863^886.
Meissner, H. H. & Paulsmeier, D. V. 1995 Plant compositional
constituents a¡ecting between-plant and animal species
prediction of forage intake. J. Anim. Sci. 73, 2447^2457.
Murray, M. G. & Brown, D. 1993 Niche separation of grazing
ungulates in the Serengeti. an experimental test. J. Anim. Ecol.
62, 380^389.
Owen-Smith, N. 1993 Evaluating optimal diet models for an
African browsing ruminant, the kudu: how constraining are
the assumed constraints? Evol. Ecol. 7, 499^524.
Peters, R. H. 1983 The ecological implications of body size.
Cambridge University Press.
Rittenhouse, L. R., Streeter, C. L. & Clanton, D. C. 1971
Estimating digestible energy from digestible dry and organic
matter in diets of grazing cattle. J. Range Mgmt 24, 73^75.
Shipley, L. A., Gross, J. A., Spalinger, D. E., Hobbs, N. T. &
Wunder, B. A. 1994 The scaling of intake rate in mammalian
herbivores. Am. Nat. 143, 1055^1082.
Short, J. 1985 The functional response of kangaroos, sheep and
rabbits in an arid grazing system. J. Appl. Ecol. 22, 435^447.
Sinclair, A. R. E. 1985 Does interspeci¢c competition or preda-
tion shape the African ungulate community? J. Anim. Ecol.
54, 899^918.
Spalinger, D. E. & Hobbs, N. T. 1992 Mechanisms of foraging in
mammalian herbivores: new models of functional response.
Am. Nat. 140, 325^348.
Trudell, J. & White, R. G. 1981 The e¡ect of forage structure
and availability on food intake, biting rate, bite size and daily
eating time of reindeer. J. Appl. Ecol. 18, 63^81.
Van Soest, P. J. 1982 Nutritional ecology of the ruminant. Corvallis,
OR: O & B Books.
Vesey-Fitzgerald, D. F. 1960 Grazing succession among east
African game mammals. J. Mamm. 41, 161^172.
Waite, R. 1963 Botanical and chemical changes in maturing
grass and their e¡ect on its digestibility. Agr. Prog. 38, 50^56.
Wallis DeVries, M. & Schippers, P. 1994 Foraging in a landscape
mosaic: selection for energy and minerals in free-ranging
cattle. Oecologia 100, 107^117.
Wickstrom, M. L., Robbins, C.T., Hanley,T. A., Spalinger, D. E.
& Parish, S. M. 1984 Food intake and foraging energetics of
elk and mule deer. J.Wildl. Mgmt 48, 1285^1301.
Wilmshurst, J. F., Fryxell, J. M. & Hudson, R. J. 1995 Forage
quality and patch choice by wapiti (Cervus elaphus). Behav. Ecol.
6, 209^217.
Wilmshurst, J. F., Fryxell, J. M. & Colucci, P. E. 1999 What
constrains daily intake in Thomson’s gazelles? Ecology 80,
2338^2347.
Wilmshurst, J. F., Fryxell, J. M., Farm, B. P., Sinclair, A. R. E.
& Henschel, C. P. 2000 Spatial distribution of Serengeti wild-
ebeest in relation to resources. Can. J. Zool. (In the press.)
Ruminant patch selection and allometry J. F.Wilmshurst and others 349
Proc. R. Soc. Lond. B (2000)