
Recommandé
Recommandé
Contenu connexe
Tendances
Tendances (19)
En vedette
En vedette (20)
Similaire à Barnet's Diverse Population
Similaire à Barnet's Diverse Population (20)
Plus de Julie Pal
Plus de Julie Pal (20)
Barnet's Diverse Population
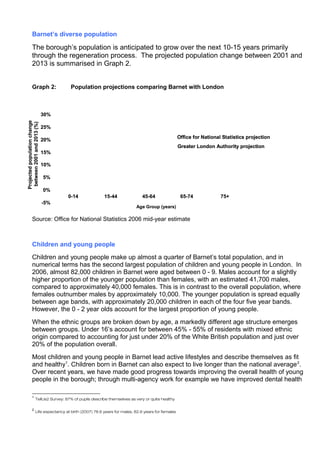
- 1. Barnet’s diverse population The borough’s population is anticipated to grow over the next 10-15 years primarily through the regeneration process. The projected population change between 2001 and 2013 is summarised in Graph 2. Graph 2: Population projections comparing Barnet with London Source: Office for National Statistics 2006 mid-year estimate Children and young people Children and young people make up almost a quarter of Barnet’s total population, and in numerical terms has the second largest population of children and young people in London. In 2006, almost 82,000 children in Barnet were aged between 0 - 9. Males account for a slightly higher proportion of the younger population than females, with an estimated 41,700 males, compared to approximately 40,000 females. This is in contrast to the overall population, where females outnumber males by approximately 10,000. The younger population is spread equally between age bands, with approximately 20,000 children in each of the four five year bands. However, the 0 - 2 year olds account for the largest proportion of young people. When the ethnic groups are broken down by age, a markedly different age structure emerges between groups. Under 16’s account for between 45% - 55% of residents with mixed ethnic origin compared to accounting for just under 20% of the White British population and just over 20% of the population overall. Most children and young people in Barnet lead active lifestyles and describe themselves as fit and healthy1 . Children born in Barnet can also expect to live longer than the national average2 . Over recent years, we have made good progress towards improving the overall health of young people in the borough; through multi-agency work for example we have improved dental health 1 TellUs2 Survey: 87% of pupils describe themselves as very or quite healthy 2 Life expectancy at birth (2007) 78.6 years for males, 82.6 years for females -5% 0% 5% 10% 15% 20% 25% 30% 0-14 15-44 45-64 65-74 75+ Age Group (years) Projectedpopulationchange between2001and2013(%) Office for National Statistics projection Greater London Authority projection -5% 0% 5% 10% 15% 20% 25% 30% 0-14 15-44 45-64 65-74 75+ Age Group (years) Projectedpopulationchange between2001and2013(%) Office for National Statistics projection Greater London Authority projection Office for National Statistics projectionOffice for National Statistics projection Greater London Authority projectionGreater London Authority projection
- 2. in children, reducing the average number of decayed, missing or filled teeth in 5 year olds3 . However, there is still progress to make both to improve the overall health of Barnet’s children and young people and to reduce health inequality. Despite our success in increasing immunisation rates locally in recent years15, too many children in Barnet remain unprotected against measles, mumps and rubella (currently 76% receive the MMR vaccination by their second birthday). During 2007 there were several local outbreaks of measles, underlining the need to continue to prioritise this issue. We have started to slow the rise in teenage conceptions: the latest data shows an encouraging drop in the rate of teenage pregnancy from 34.6 per thousand women aged 15-17 in 2004 to 29.8 in 2006, the fourth lowest in London. However, chlamydia is a growing problem both nationally and locally. Data covering Barnet shows that the infection is rising, particularly among the 16-24 age group.16 Barnet’s chlamydia screening programme, commenced in 2007, remains a priority for the PCT. We will work to improve access to chlamydia screening and also increase young people’s awareness of the risks of sexually transmitted infections Middle-age spread Irrespective of the source of data, both data sets reveal the population bulge of the 45-64 year olds. Known popularly as ‘middle-aged spread’ it marks the emergence of an age-related risk triggers to a number diseases including cardiovascular disease (CVD), increased cholesterol, blood pressure, blood cholesterol and diabetes. This age pre-disposition is further complicated amongst people who are obese or smoke. Colorectal and breast cancers also become more prevalent in this age group. Lifestyle risk assessments and interventions will need to be developed to reduce morbidity and mortality amongst this age group. Older People Barnet has the second highest number of people over 65 in Greater London. There has been a steady increase in the number of people who are living to the age of 75 years in Barnet, and this growth will be compounded when the post war generation (referred to as the baby boomers) will, by 2020, begin to reach 75 years old. Associated with this will be an increase in the number of older people from Black and minority ethnic groups, with the sharpest increase expected to occur in Indian, Chinese and Black African groupsi . At the same time, the number of people living beyond 85 years of age is set to increase slightly. However, this is expected to occur only in 11 out of 21 wards. The biggest absolute increase is expected in Colindale (131) and West Hendon (113). Audit Commission data shows that 15% of residents aged over 60 years of age live in households that are income deprived. This is slightly higher than the national mean and is near the average for London, where the range is 23.1% (Brent) and 9.9% (Bromley)ii . A Joseph Rowntree Foundation study of the material resources of older people found that women, those living alone, widowed, divorced or separated and or poorly educated are disproportionately represented in the lower socio-economic groups and more likely to be in poor health.iii People aged 85+ are more at risk of social isolation living in a geographically large borough as their social networks literally begin to die off. This group is expected to rise This is significant in terms of the targeting of selected geographical areas to reduce the impact of undue poverty on the demand for social care and health services due to: social isolation, depression, poor nutrition or hypothermia. 3 Average number of decayed, missing or filled teeth in children age 5 reduced from 2.07 in 2003/4 to 1.71 in 2005/6
- 3. i ONS Revised Pop. Projections 27 Sep 2007 ii www.areaprofiles.audit-commission.gov.uk/(3bvskyb3l10ctr55caci15vi)/DataSelection.aspx iii Vanessa Burholt and Gill Windle The material resources and well-being of older people. Joseph Rowntree Foundation. 2006.