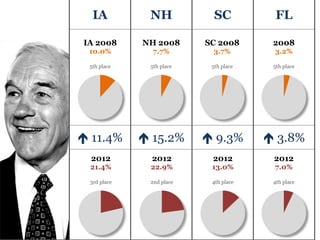
SlideShare une entreprise Scribd logo
1  sur  9
Télécharger pour lire hors ligne
IA          NH            SC           FL

IA 2008      NH 2008      SC 2008       2008
 10.0%         7.7%        3.7%         3.2%

 5th place    5th place    5th place    5th place


 11.4%       15.2%       9.3%        3.8%
  2012         2012        2012         2012
  21.4%       22.9%        13.0%        7.0%

 3rd place    2nd place    4th place    4th place
NV           MO           MN           CO

 2008         2008         2008         2008
 13.7%        4.5%         15.7%        8.4%

 2nd place    4th place    4th place    4th place


 5.1%        7.7%        11.4%       3.4%
 2012         2012          2012        2012
 18.8%        12.2%        27.1%        11.8%

 3rd place    3rd place    2nd place    4th place
ME           MI           AZ           WA

 2008         2008         2008         2008
  18.3%       6.3%         4.2%         21.6%

 3rd place    4th place    4th place    3rd place


 17.4%       5.3%        4.2%        3.2%
  2012        2012         2012         2012
  35.7%       11.6%        8.4%         24.8%

 2nd place    3rd place    4th place    2nd place
AK           GA            ID          MA

 2008         2008         2008         2008
 17.2%        2.9%         23.8%        2.7%

 3rd place    4th place    2nd place    4th place


 6.8%        3.6%        5.7%        6.8%
 2012         2012         2012         2012
 24.0%        6.5%         18.1%        9.5%

 3rd place    4th place    3rd place    3rd place
ND           OH           OK           TN

 2008         2008         2008         2008
 21.3%        4.6%         3.3%         5.6%

 3rd place    3rd place    4th place    4th place


 6.8%        4.6%        6.3%        3.4%
 2012         2012         2012         2012
 28.1%        9.2%         9.6%         9.0%

 2nd place    4th place    4th place    4th place
VT           VA            WY               KS

  2008         2008           2008            2008
  6.7%         4.5%             NA            11.2%

 3rd place     3rd place    (no vote held)    3rd place


 18.7%       36.0%        12.2%            1.4%
  2012         2012           2012            2012
 25.4%        40.5%           12.2%           12.6%

 2nd place    2nd place       3rd place       4th place
AL              HI             MS           PR

 2008           2008            2008         2008
 2.7%             NA            3.8%         4.3%

 4th place    (no vote held)    3rd place    3rd place


 2.3%        18.3%            0.6%        3.0%
 2012           2012            2012         2012
 5.0%           18.3%           4.4%          1.3%

 4th place      3rd place       4th place    4th place
IL          LA           MD           WI

 2008         2008         2008         2008
 5.0%         5.3%         6.0%         4.7%

 4th place    4th place    4th place    3rd place


 4.3%        0.9%        3.5%        7.0%
 2012         2012         2012         2012
  9.3%         6.2%         9.5%        11.7%

 3rd place    4th place    4th place    3rd place
DC

DC 2008
 8.0%

 3rd place


 4.0%
DC 2012
 12.0%

 2nd place

Contenu connexe

Plus de kkellyfv

Gop 2012 nomination votes delegates (update, 04.04.12)
Gop 2012 nomination votes delegates (update, 04.04.12)Gop 2012 nomination votes delegates (update, 04.04.12)
Gop 2012 nomination votes delegates (update, 04.04.12)kkellyfv
 
Romney vs. romney (update, 04.04.12)
Romney vs. romney (update, 04.04.12)Romney vs. romney (update, 04.04.12)
Romney vs. romney (update, 04.04.12)kkellyfv
 
Romney vs. romney (post super tuesday update, 03.22.12)
Romney vs. romney (post super tuesday update, 03.22.12)Romney vs. romney (post super tuesday update, 03.22.12)
Romney vs. romney (post super tuesday update, 03.22.12)kkellyfv
 
Gop 2012 nomination share of popular vote and delegates per candidate (03.2...
Gop 2012 nomination   share of popular vote and delegates per candidate (03.2...Gop 2012 nomination   share of popular vote and delegates per candidate (03.2...
Gop 2012 nomination share of popular vote and delegates per candidate (03.2...kkellyfv
 
Gop 2012 nomination share of popular vote and delegates per candidate (03.1...
Gop 2012 nomination   share of popular vote and delegates per candidate (03.1...Gop 2012 nomination   share of popular vote and delegates per candidate (03.1...
Gop 2012 nomination share of popular vote and delegates per candidate (03.1...kkellyfv
 
FairVote.org - Why NPV makes sense (for Utah)
FairVote.org - Why NPV makes sense (for Utah)FairVote.org - Why NPV makes sense (for Utah)
FairVote.org - Why NPV makes sense (for Utah)kkellyfv
 
Portland, me 2011, mayoral election graphs (1)
Portland, me 2011, mayoral election graphs (1)Portland, me 2011, mayoral election graphs (1)
Portland, me 2011, mayoral election graphs (1)kkellyfv
 
San francisco 2011, sheriff election graphs (1)
San francisco 2011, sheriff election graphs (1)San francisco 2011, sheriff election graphs (1)
San francisco 2011, sheriff election graphs (1)kkellyfv
 
San francisco, 2011 district attorney election graphs (1)
San francisco, 2011 district attorney election graphs (1)San francisco, 2011 district attorney election graphs (1)
San francisco, 2011 district attorney election graphs (1)kkellyfv
 
San francisco 2011, mayoral election graphs
San francisco 2011, mayoral election graphsSan francisco 2011, mayoral election graphs
San francisco 2011, mayoral election graphskkellyfv
 
Portland, me 2011, mayoral election graphs
Portland, me 2011, mayoral election graphsPortland, me 2011, mayoral election graphs
Portland, me 2011, mayoral election graphskkellyfv
 
San francisco 2011, sheriff election graphs
San francisco 2011, sheriff election graphsSan francisco 2011, sheriff election graphs
San francisco 2011, sheriff election graphskkellyfv
 
San francisco, 2011 district attorney election graphs
San francisco, 2011 district attorney election graphsSan francisco, 2011 district attorney election graphs
San francisco, 2011 district attorney election graphskkellyfv
 
San francisco, 2011 mayoral election graphs
San francisco, 2011 mayoral election graphsSan francisco, 2011 mayoral election graphs
San francisco, 2011 mayoral election graphskkellyfv
 
San francisco, CA 2011 Mayoral Results
San francisco, CA 2011 Mayoral ResultsSan francisco, CA 2011 Mayoral Results
San francisco, CA 2011 Mayoral Resultskkellyfv
 

Plus de kkellyfv (15)

Gop 2012 nomination votes delegates (update, 04.04.12)
Gop 2012 nomination votes delegates (update, 04.04.12)Gop 2012 nomination votes delegates (update, 04.04.12)
Gop 2012 nomination votes delegates (update, 04.04.12)
 
Romney vs. romney (update, 04.04.12)
Romney vs. romney (update, 04.04.12)Romney vs. romney (update, 04.04.12)
Romney vs. romney (update, 04.04.12)
 
Romney vs. romney (post super tuesday update, 03.22.12)
Romney vs. romney (post super tuesday update, 03.22.12)Romney vs. romney (post super tuesday update, 03.22.12)
Romney vs. romney (post super tuesday update, 03.22.12)
 
Gop 2012 nomination share of popular vote and delegates per candidate (03.2...
Gop 2012 nomination   share of popular vote and delegates per candidate (03.2...Gop 2012 nomination   share of popular vote and delegates per candidate (03.2...
Gop 2012 nomination share of popular vote and delegates per candidate (03.2...
 
Gop 2012 nomination share of popular vote and delegates per candidate (03.1...
Gop 2012 nomination   share of popular vote and delegates per candidate (03.1...Gop 2012 nomination   share of popular vote and delegates per candidate (03.1...
Gop 2012 nomination share of popular vote and delegates per candidate (03.1...
 
FairVote.org - Why NPV makes sense (for Utah)
FairVote.org - Why NPV makes sense (for Utah)FairVote.org - Why NPV makes sense (for Utah)
FairVote.org - Why NPV makes sense (for Utah)
 
Portland, me 2011, mayoral election graphs (1)
Portland, me 2011, mayoral election graphs (1)Portland, me 2011, mayoral election graphs (1)
Portland, me 2011, mayoral election graphs (1)
 
San francisco 2011, sheriff election graphs (1)
San francisco 2011, sheriff election graphs (1)San francisco 2011, sheriff election graphs (1)
San francisco 2011, sheriff election graphs (1)
 
San francisco, 2011 district attorney election graphs (1)
San francisco, 2011 district attorney election graphs (1)San francisco, 2011 district attorney election graphs (1)
San francisco, 2011 district attorney election graphs (1)
 
San francisco 2011, mayoral election graphs
San francisco 2011, mayoral election graphsSan francisco 2011, mayoral election graphs
San francisco 2011, mayoral election graphs
 
Portland, me 2011, mayoral election graphs
Portland, me 2011, mayoral election graphsPortland, me 2011, mayoral election graphs
Portland, me 2011, mayoral election graphs
 
San francisco 2011, sheriff election graphs
San francisco 2011, sheriff election graphsSan francisco 2011, sheriff election graphs
San francisco 2011, sheriff election graphs
 
San francisco, 2011 district attorney election graphs
San francisco, 2011 district attorney election graphsSan francisco, 2011 district attorney election graphs
San francisco, 2011 district attorney election graphs
 
San francisco, 2011 mayoral election graphs
San francisco, 2011 mayoral election graphsSan francisco, 2011 mayoral election graphs
San francisco, 2011 mayoral election graphs
 
San francisco, CA 2011 Mayoral Results
San francisco, CA 2011 Mayoral ResultsSan francisco, CA 2011 Mayoral Results
San francisco, CA 2011 Mayoral Results
 

Paul vs paul (update, 04.04.12)

  • 1. IA NH SC FL IA 2008 NH 2008 SC 2008 2008 10.0% 7.7% 3.7% 3.2% 5th place 5th place 5th place 5th place  11.4%  15.2%  9.3%  3.8% 2012 2012 2012 2012 21.4% 22.9% 13.0% 7.0% 3rd place 2nd place 4th place 4th place
  • 2. NV MO MN CO 2008 2008 2008 2008 13.7% 4.5% 15.7% 8.4% 2nd place 4th place 4th place 4th place  5.1%  7.7%  11.4%  3.4% 2012 2012 2012 2012 18.8% 12.2% 27.1% 11.8% 3rd place 3rd place 2nd place 4th place
  • 3. ME MI AZ WA 2008 2008 2008 2008 18.3% 6.3% 4.2% 21.6% 3rd place 4th place 4th place 3rd place  17.4%  5.3%  4.2%  3.2% 2012 2012 2012 2012 35.7% 11.6% 8.4% 24.8% 2nd place 3rd place 4th place 2nd place
  • 4. AK GA ID MA 2008 2008 2008 2008 17.2% 2.9% 23.8% 2.7% 3rd place 4th place 2nd place 4th place  6.8%  3.6%  5.7%  6.8% 2012 2012 2012 2012 24.0% 6.5% 18.1% 9.5% 3rd place 4th place 3rd place 3rd place
  • 5. ND OH OK TN 2008 2008 2008 2008 21.3% 4.6% 3.3% 5.6% 3rd place 3rd place 4th place 4th place  6.8%  4.6%  6.3%  3.4% 2012 2012 2012 2012 28.1% 9.2% 9.6% 9.0% 2nd place 4th place 4th place 4th place
  • 6. VT VA WY KS 2008 2008 2008 2008 6.7% 4.5% NA 11.2% 3rd place 3rd place (no vote held) 3rd place  18.7%  36.0%  12.2%  1.4% 2012 2012 2012 2012 25.4% 40.5% 12.2% 12.6% 2nd place 2nd place 3rd place 4th place
  • 7. AL HI MS PR 2008 2008 2008 2008 2.7% NA 3.8% 4.3% 4th place (no vote held) 3rd place 3rd place  2.3%  18.3%  0.6%  3.0% 2012 2012 2012 2012 5.0% 18.3% 4.4% 1.3% 4th place 3rd place 4th place 4th place
  • 8. IL LA MD WI 2008 2008 2008 2008 5.0% 5.3% 6.0% 4.7% 4th place 4th place 4th place 3rd place  4.3%  0.9%  3.5%  7.0% 2012 2012 2012 2012 9.3% 6.2% 9.5% 11.7% 3rd place 4th place 4th place 3rd place
  • 9. DC DC 2008 8.0% 3rd place  4.0% DC 2012 12.0% 2nd place