SlideShare a Scribd company logo
1 of 1
Download to read offline
Habitat Suitability Models:
Predicting Sebastes Presence at the Del Monte Shalebeds
Lisa Jensen
California State University, Monterey Bay
ENVS 532 Advanced Geographic Information Systems
Background
Habitat structure plays a key role in determining spatial patterns of marine biota (McArthur et al.
2010). Understanding species habitat associations offers resource managers better control over
species management and sustainability (Grober-Dunsmore et al. 2008). Terrestrial landscape ecology
metrics used to analyze the spatial relationships for habitat associations can often be adapted to
marine habitat association and compliment marine specific metrics (Pittman et al. 2010).
Methods
Results
References
My appreciation to Dr. Rikk Kvitek, Pat Iampietro, Mary Young, Captain Bill Williamson, the students of ENVS 433/533
with specific appreciation to Jason Adelaars and Jessica Blakely, and the CSU Monterey Bay Seafloor Mapping Lab for
their assistance in data collection and analysis.
• Multi-beam bathymetric data were collected over
the Del Monte Shalebeds aboard the R/V Harold
Heath in Spring 2012.
• Fish presence data were collected over five days
using a Furuno searchlight CH250 sector
scanning sonar (Fig. 2).
• A Seabotix LBV remotely operated vehicle (ROV)
was used to groundtruth fish presence (Fig 3).
• Multi-beam bathymetric data were used to
create a Digital Elevation Model (DEM) (Fig. 1).
Figure 1. The Del Monte Shalebeds compose the
substrate in lower part of image. A granitic outcrop is
seen in upper left of image.
Figure 3. Seabotix LBV ROV used to
ground truth fish presence seen in Furuno.
Figure 2. Furuno Searchlight CH250 sector scanning
sonar sweeps side to side identifying targets (a). The
resulting image displays fish presence as a “cloud”
above substrate (b).
Discussion
This research indicates rockfish presence can be fairly accurately predicted utilizing landscape
metrics for habitat characteristics in conjunction with remote sensing technology. Further, this
research demonstrates rockfish presence varies predictably with measures of habitat complexity and
depth. The results here support the conclusions of previous research indicating marine biota can be
predicted using measures of habitat structure and further the use of remote sensing in prediction of
rockfish.
The final predictive model
provides good agreement
between locations of fish
presence and absence
(Cohen’s Kappa = 0.61).
Predictor variables Slope,
Eastness, and Depth were all
significant (p-value < 0.05)
with distance to topographic
peaks and VRM being the most
significant (p-value < 0.01).
The GLM was validated using
presence/absence data set
aside prior to model
development (20%) (Fig. 7).
Figure 7. Probability of occurrence with presence/absence data used
in model development (hollow) and validation (filled).
Rockfish are an economically important
species for California fisheries, some of these
species have been overexploited and are at
risk of localized extinction. This research will
aid in identification of spatial patterns
important to rockfish. The Del Monte
Shalebeds are located approximately 1
kilometer offshore of Cannery Row in
Monterey, CA (Fig. 1). The shalebeds and
associated granitic outcrops are home to
different species of rockfish including Sebastes
pinninger which is listed under the Endangered
Species Act as a threatened species.
The area for this study is approximately 11
km2 and includes 4.4 km2 of hard substrate
with high relief granitic outcrop and low relief
shalebeds. Past research indicates there may
be different degrees of site fidelity depending
on topographic relief with rockfish exhibiting a
lower degree of site fidelity over low relief
substrate.
Hypothesis:
Rockfish presence on rocky reefs varies
predictably with habitat characteristics of
topographic complexity and depth.
Rockfish presence can be accurately predicted
using habitat characteristics.
Presence ~ Slope + Eastness
+ Depth + TPI25distance
+ VRM25
Figure 6. Predictor values were associated with presence
and absence points by sampling through the raster layers.
Figure 4. Derivative rasters derived from DEM.
Figure 5. Transformation of
cyclical predictor, Aspect.
• The DEM was used to derive habitat rasters for
slope, aspect, topographic position index (TPI),
and vector ruggedness measure (VRM) (Fig 4).
• Aspect was transformed into Northness and
Eastness (Fig. 5)
• Habitat rasters were used as input along with
fish presence/absence data in a generalized
linear model (GLM) to create a probability raster
using the Marine Geospatial Ecology Toolbox
(MGET) in ArcGIS 10 (Fig. 6).
• Fish presence/absence data were set aside prior
to model development for subsequent validation
of the probability raster (Young et al. 2010).
a.
b.
Acknowledgements
Grober-Dunsmore R, Frazer TK, Beets JP, Lindberg WJ, Zwick P, Funicelli NA. 2008. Influence of landscape structure
on reef fish assemblages. Landscape Ecology 23(Supp 1):37-53.
McArthur MA, Brooke BP, Przeslawski R, Ryan DA, Lucieer VL, Nicol S, McCallum AW, Mellin C, Cresswell ID, Radke
LC. 2010. On the use of aboitoc currogates to describe marine benthic biodiversity. Estuarine, Coastal and Shelf
Science 88(1):21-22.
Matthews KR. 1990. A telemetric study of the home ranges and homing routes of copper and quillback rockfishes on
shallow rocky reefs. Canadian Journal of Zoology 68(11):2243 – 2250.
Pittman SJ, Costa BM, Jeffrey CFG, Caldow C. Importance of seascape complexity for reslient fish habitat and
sustainable fisheries. 63rd Gulf and Caribbean Fisheries Institute; 1-5 November 2010; San Juan, Puerto Rico.
Young MA, Iampietro PJ, Kvitek RG, Garza CD. 2010. Multivariate bathymetry-derived generalized linear model
accurately predicts rockfish distribution on Cordell Bank, California, USA. Marine Ecology Progress Series 415:247-261.
10%False Absence
25%
False
Presence
75%True Absence
90%True Presence
81%Accuracy
Model
Accuracy
Statistics
Table 1. Model accuracy using
reserved validation data.
Figure 8. Direction of water flow, including
beneficial effects of upwelling, at shalebeds.
a. b.
Figure 9. Profile comparison of relief at granitic
outcrop (a) and shalebed (b), the red line indicates
transect used for profile analysis.
http://www.cencoos.org/sections/conditions/CENCAL_currents/mb_n
ode.shtml
Future research efforts should include:
• Closer examination of the relationship between rockfish presence and the direction of cold, nutrient
rich waters from upwelling zones to the North of Monterey Bay (Fig. 8).
• Passive acoustic radio telemetry studies of rockfish home range and site fidelity at hard substrate
of varying relief (Fig. 9)
• Potential for variability in site fidelity over low relief and high relief hard substrate (Matthews
1990).
• The role isolation of rocky outcrops may play in the distribution and abundance of rockfish
aggregations.
Future Research
The answers to future these research efforts will provide resource managers and marine spatial
planning experts important information and tools to aid in the recovery and sustainability of rockfish.

More Related Content

What's hot

Evan's Africa Paper
Evan's Africa PaperEvan's Africa Paper
Evan's Africa Paper
Evan Firl
 
An Extension education program to help water districts conserve water and ope...
An Extension education program to help water districts conserve water and ope...An Extension education program to help water districts conserve water and ope...
An Extension education program to help water districts conserve water and ope...
Texas Alliance of Groundwater Districts
 
Ecosystem_Approach_REPORT_10470276_FINISHED
Ecosystem_Approach_REPORT_10470276_FINISHEDEcosystem_Approach_REPORT_10470276_FINISHED
Ecosystem_Approach_REPORT_10470276_FINISHED
Sarah Chater
 
Detecting natural succession on abandoned agricultural land in
Detecting natural succession on abandoned agricultural land inDetecting natural succession on abandoned agricultural land in
Detecting natural succession on abandoned agricultural land in
Beata Markowska
 
Muskie_poster (4)
Muskie_poster (4)Muskie_poster (4)
Muskie_poster (4)
David Ewald
 

What's hot (20)

Conceptual Model for Assessing Recreational Safety Related to Habitat Improve...
Conceptual Model for Assessing Recreational Safety Related to Habitat Improve...Conceptual Model for Assessing Recreational Safety Related to Habitat Improve...
Conceptual Model for Assessing Recreational Safety Related to Habitat Improve...
 
Final Project Report_301819G032
Final Project Report_301819G032Final Project Report_301819G032
Final Project Report_301819G032
 
Evan's Africa Paper
Evan's Africa PaperEvan's Africa Paper
Evan's Africa Paper
 
An Extension education program to help water districts conserve water and ope...
An Extension education program to help water districts conserve water and ope...An Extension education program to help water districts conserve water and ope...
An Extension education program to help water districts conserve water and ope...
 
Ecosystem_Approach_REPORT_10470276_FINISHED
Ecosystem_Approach_REPORT_10470276_FINISHEDEcosystem_Approach_REPORT_10470276_FINISHED
Ecosystem_Approach_REPORT_10470276_FINISHED
 
Survey on Frazer River Sand in Richmond, British Columbia, Canada
Survey on Frazer River Sand in Richmond, British Columbia, CanadaSurvey on Frazer River Sand in Richmond, British Columbia, Canada
Survey on Frazer River Sand in Richmond, British Columbia, Canada
 
SIRE poster
SIRE posterSIRE poster
SIRE poster
 
Fish passage system!
Fish passage system!Fish passage system!
Fish passage system!
 
Geological field activities at the HI-SEAS planetary surface analog mission s...
Geological field activities at the HI-SEAS planetary surface analog mission s...Geological field activities at the HI-SEAS planetary surface analog mission s...
Geological field activities at the HI-SEAS planetary surface analog mission s...
 
Poster Distributional Pattern of Ichthyofauna
Poster Distributional Pattern of IchthyofaunaPoster Distributional Pattern of Ichthyofauna
Poster Distributional Pattern of Ichthyofauna
 
Understanding land use influence to coastal ecosystems in the Rio Grande de M...
Understanding land use influence to coastal ecosystems in the Rio Grande de M...Understanding land use influence to coastal ecosystems in the Rio Grande de M...
Understanding land use influence to coastal ecosystems in the Rio Grande de M...
 
An Integrative Decision Support System for Managing Water Resources under Inc...
An Integrative Decision Support System for Managing Water Resources under Inc...An Integrative Decision Support System for Managing Water Resources under Inc...
An Integrative Decision Support System for Managing Water Resources under Inc...
 
Land use land cover impacts
Land use land cover impactsLand use land cover impacts
Land use land cover impacts
 
Coastal Wetland Restoration Success Stories-Fleming, 2012
Coastal Wetland Restoration Success Stories-Fleming, 2012Coastal Wetland Restoration Success Stories-Fleming, 2012
Coastal Wetland Restoration Success Stories-Fleming, 2012
 
Estimating Fish Community Diversity through Linear and Non-Linear Statistical...
Estimating Fish Community Diversity through Linear and Non-Linear Statistical...Estimating Fish Community Diversity through Linear and Non-Linear Statistical...
Estimating Fish Community Diversity through Linear and Non-Linear Statistical...
 
Resumesmall
ResumesmallResumesmall
Resumesmall
 
Detecting natural succession on abandoned agricultural land in
Detecting natural succession on abandoned agricultural land inDetecting natural succession on abandoned agricultural land in
Detecting natural succession on abandoned agricultural land in
 
DSD-INT 2017 Wave-Induced Reef Barrier Currents, XBeach Simulation vs Field M...
DSD-INT 2017 Wave-Induced Reef Barrier Currents, XBeach Simulation vs Field M...DSD-INT 2017 Wave-Induced Reef Barrier Currents, XBeach Simulation vs Field M...
DSD-INT 2017 Wave-Induced Reef Barrier Currents, XBeach Simulation vs Field M...
 
Muskie_poster (4)
Muskie_poster (4)Muskie_poster (4)
Muskie_poster (4)
 
Paul Hagan Executive Resume
Paul Hagan Executive ResumePaul Hagan Executive Resume
Paul Hagan Executive Resume
 

Similar to Habitat suitability models: Predicting Sebastes presence at the Del Monte Shalebeds

Habitat models: Predicting Sebastes presence in the Del Monte Shalebeds
Habitat models: Predicting Sebastes presence in the Del Monte ShalebedsHabitat models: Predicting Sebastes presence in the Del Monte Shalebeds
Habitat models: Predicting Sebastes presence in the Del Monte Shalebeds
Lisa Jensen
 
JLGASKIN_ISTS_Poster1
JLGASKIN_ISTS_Poster1JLGASKIN_ISTS_Poster1
JLGASKIN_ISTS_Poster1
Jaynie Gaskin
 
Flats Ecology Research Poster
Flats Ecology Research PosterFlats Ecology Research Poster
Flats Ecology Research Poster
Kate Maroni
 
Tulevech_Effects_of_Shoreline_Structure_on_Fish_Habitat_Use_and_Schooling_Beh...
Tulevech_Effects_of_Shoreline_Structure_on_Fish_Habitat_Use_and_Schooling_Beh...Tulevech_Effects_of_Shoreline_Structure_on_Fish_Habitat_Use_and_Schooling_Beh...
Tulevech_Effects_of_Shoreline_Structure_on_Fish_Habitat_Use_and_Schooling_Beh...
Steven Tulevech
 
CMoore_SPEI_Fidelity_FINAL
CMoore_SPEI_Fidelity_FINALCMoore_SPEI_Fidelity_FINAL
CMoore_SPEI_Fidelity_FINAL
Callie B. Moore
 
Aag poster
Aag poster Aag poster
Aag poster
lmohon
 

Similar to Habitat suitability models: Predicting Sebastes presence at the Del Monte Shalebeds (20)

Habitat models: Predicting Sebastes presence in the Del Monte Shalebeds
Habitat models: Predicting Sebastes presence in the Del Monte ShalebedsHabitat models: Predicting Sebastes presence in the Del Monte Shalebeds
Habitat models: Predicting Sebastes presence in the Del Monte Shalebeds
 
Using sea-floor morphometrics to constrain stratigraphic models of sinuous su...
Using sea-floor morphometrics to constrain stratigraphic models of sinuous su...Using sea-floor morphometrics to constrain stratigraphic models of sinuous su...
Using sea-floor morphometrics to constrain stratigraphic models of sinuous su...
 
Runya et al.2021.pdf
Runya et al.2021.pdfRunya et al.2021.pdf
Runya et al.2021.pdf
 
JLGASKIN_ISTS_Poster1
JLGASKIN_ISTS_Poster1JLGASKIN_ISTS_Poster1
JLGASKIN_ISTS_Poster1
 
BEAMR
BEAMRBEAMR
BEAMR
 
Flats Ecology Research Poster
Flats Ecology Research PosterFlats Ecology Research Poster
Flats Ecology Research Poster
 
Sutherland_JMIHPoster
Sutherland_JMIHPosterSutherland_JMIHPoster
Sutherland_JMIHPoster
 
Relating fish populations to coral colony size and complexity.pdf
Relating fish populations to coral colony size and complexity.pdfRelating fish populations to coral colony size and complexity.pdf
Relating fish populations to coral colony size and complexity.pdf
 
Estimating and Classifying Spatial and Temporal Distributions of Flow Conditi...
Estimating and Classifying Spatial and Temporal Distributions of Flow Conditi...Estimating and Classifying Spatial and Temporal Distributions of Flow Conditi...
Estimating and Classifying Spatial and Temporal Distributions of Flow Conditi...
 
Tulevech_Effects_of_Shoreline_Structure_on_Fish_Habitat_Use_and_Schooling_Beh...
Tulevech_Effects_of_Shoreline_Structure_on_Fish_Habitat_Use_and_Schooling_Beh...Tulevech_Effects_of_Shoreline_Structure_on_Fish_Habitat_Use_and_Schooling_Beh...
Tulevech_Effects_of_Shoreline_Structure_on_Fish_Habitat_Use_and_Schooling_Beh...
 
Keith cooper day_3_session_7
Keith cooper day_3_session_7Keith cooper day_3_session_7
Keith cooper day_3_session_7
 
CMoore_SPEI_Fidelity_FINAL
CMoore_SPEI_Fidelity_FINALCMoore_SPEI_Fidelity_FINAL
CMoore_SPEI_Fidelity_FINAL
 
Aag poster
Aag poster Aag poster
Aag poster
 
AAG Poster Presentation
AAG Poster PresentationAAG Poster Presentation
AAG Poster Presentation
 
Txgio presentation rgsm_gps_pearson_062012
Txgio presentation rgsm_gps_pearson_062012Txgio presentation rgsm_gps_pearson_062012
Txgio presentation rgsm_gps_pearson_062012
 
Dimosfismo-sexual-flounder.pdf
Dimosfismo-sexual-flounder.pdfDimosfismo-sexual-flounder.pdf
Dimosfismo-sexual-flounder.pdf
 
Integrating sediment dynamics into habitat mapping approaches using sediment ...
Integrating sediment dynamics into habitat mapping approaches using sediment ...Integrating sediment dynamics into habitat mapping approaches using sediment ...
Integrating sediment dynamics into habitat mapping approaches using sediment ...
 
Biogeography of Caribbean weevils highlights the importance of founder-event ...
Biogeography of Caribbean weevils highlights the importance of founder-event ...Biogeography of Caribbean weevils highlights the importance of founder-event ...
Biogeography of Caribbean weevils highlights the importance of founder-event ...
 
Modeling the occurrence and abundance of fishing cat in ctl, india (1)
Modeling the occurrence and abundance of fishing cat in ctl, india (1)Modeling the occurrence and abundance of fishing cat in ctl, india (1)
Modeling the occurrence and abundance of fishing cat in ctl, india (1)
 
Benthic Habitat Mapping in Tropical Marine Environment Using QuickBird Multis...
Benthic Habitat Mapping in Tropical Marine Environment Using QuickBird Multis...Benthic Habitat Mapping in Tropical Marine Environment Using QuickBird Multis...
Benthic Habitat Mapping in Tropical Marine Environment Using QuickBird Multis...
 

Recently uploaded

Biogenic Sulfur Gases as Biosignatures on Temperate Sub-Neptune Waterworlds
Biogenic Sulfur Gases as Biosignatures on Temperate Sub-Neptune WaterworldsBiogenic Sulfur Gases as Biosignatures on Temperate Sub-Neptune Waterworlds
Biogenic Sulfur Gases as Biosignatures on Temperate Sub-Neptune Waterworlds
Sérgio Sacani
 
Pests of cotton_Sucking_Pests_Dr.UPR.pdf
Pests of cotton_Sucking_Pests_Dr.UPR.pdfPests of cotton_Sucking_Pests_Dr.UPR.pdf
Pests of cotton_Sucking_Pests_Dr.UPR.pdf
PirithiRaju
 
development of diagnostic enzyme assay to detect leuser virus
development of diagnostic enzyme assay to detect leuser virusdevelopment of diagnostic enzyme assay to detect leuser virus
development of diagnostic enzyme assay to detect leuser virus
NazaninKarimi6
 
Bacterial Identification and Classifications
Bacterial Identification and ClassificationsBacterial Identification and Classifications
Bacterial Identification and Classifications
Areesha Ahmad
 

Recently uploaded (20)

Human & Veterinary Respiratory Physilogy_DR.E.Muralinath_Associate Professor....
Human & Veterinary Respiratory Physilogy_DR.E.Muralinath_Associate Professor....Human & Veterinary Respiratory Physilogy_DR.E.Muralinath_Associate Professor....
Human & Veterinary Respiratory Physilogy_DR.E.Muralinath_Associate Professor....
 
High Profile 🔝 8250077686 📞 Call Girls Service in GTB Nagar🍑
High Profile 🔝 8250077686 📞 Call Girls Service in GTB Nagar🍑High Profile 🔝 8250077686 📞 Call Girls Service in GTB Nagar🍑
High Profile 🔝 8250077686 📞 Call Girls Service in GTB Nagar🍑
 
module for grade 9 for distance learning
module for grade 9 for distance learningmodule for grade 9 for distance learning
module for grade 9 for distance learning
 
Dubai Call Girls Beauty Face Teen O525547819 Call Girls Dubai Young
Dubai Call Girls Beauty Face Teen O525547819 Call Girls Dubai YoungDubai Call Girls Beauty Face Teen O525547819 Call Girls Dubai Young
Dubai Call Girls Beauty Face Teen O525547819 Call Girls Dubai Young
 
Clean In Place(CIP).pptx .
Clean In Place(CIP).pptx                 .Clean In Place(CIP).pptx                 .
Clean In Place(CIP).pptx .
 
High Class Escorts in Hyderabad ₹7.5k Pick Up & Drop With Cash Payment 969456...
High Class Escorts in Hyderabad ₹7.5k Pick Up & Drop With Cash Payment 969456...High Class Escorts in Hyderabad ₹7.5k Pick Up & Drop With Cash Payment 969456...
High Class Escorts in Hyderabad ₹7.5k Pick Up & Drop With Cash Payment 969456...
 
GBSN - Microbiology (Unit 2)
GBSN - Microbiology (Unit 2)GBSN - Microbiology (Unit 2)
GBSN - Microbiology (Unit 2)
 
Factory Acceptance Test( FAT).pptx .
Factory Acceptance Test( FAT).pptx       .Factory Acceptance Test( FAT).pptx       .
Factory Acceptance Test( FAT).pptx .
 
GBSN - Microbiology (Unit 3)
GBSN - Microbiology (Unit 3)GBSN - Microbiology (Unit 3)
GBSN - Microbiology (Unit 3)
 
Biogenic Sulfur Gases as Biosignatures on Temperate Sub-Neptune Waterworlds
Biogenic Sulfur Gases as Biosignatures on Temperate Sub-Neptune WaterworldsBiogenic Sulfur Gases as Biosignatures on Temperate Sub-Neptune Waterworlds
Biogenic Sulfur Gases as Biosignatures on Temperate Sub-Neptune Waterworlds
 
Pests of cotton_Sucking_Pests_Dr.UPR.pdf
Pests of cotton_Sucking_Pests_Dr.UPR.pdfPests of cotton_Sucking_Pests_Dr.UPR.pdf
Pests of cotton_Sucking_Pests_Dr.UPR.pdf
 
Connaught Place, Delhi Call girls :8448380779 Model Escorts | 100% verified
Connaught Place, Delhi Call girls :8448380779 Model Escorts | 100% verifiedConnaught Place, Delhi Call girls :8448380779 Model Escorts | 100% verified
Connaught Place, Delhi Call girls :8448380779 Model Escorts | 100% verified
 
Introduction to Viruses
Introduction to VirusesIntroduction to Viruses
Introduction to Viruses
 
GBSN - Microbiology (Unit 1)
GBSN - Microbiology (Unit 1)GBSN - Microbiology (Unit 1)
GBSN - Microbiology (Unit 1)
 
9999266834 Call Girls In Noida Sector 22 (Delhi) Call Girl Service
9999266834 Call Girls In Noida Sector 22 (Delhi) Call Girl Service9999266834 Call Girls In Noida Sector 22 (Delhi) Call Girl Service
9999266834 Call Girls In Noida Sector 22 (Delhi) Call Girl Service
 
❤Jammu Kashmir Call Girls 8617697112 Personal Whatsapp Number 💦✅.
❤Jammu Kashmir Call Girls 8617697112 Personal Whatsapp Number 💦✅.❤Jammu Kashmir Call Girls 8617697112 Personal Whatsapp Number 💦✅.
❤Jammu Kashmir Call Girls 8617697112 Personal Whatsapp Number 💦✅.
 
Sector 62, Noida Call girls :8448380779 Model Escorts | 100% verified
Sector 62, Noida Call girls :8448380779 Model Escorts | 100% verifiedSector 62, Noida Call girls :8448380779 Model Escorts | 100% verified
Sector 62, Noida Call girls :8448380779 Model Escorts | 100% verified
 
Zoology 5th semester notes( Sumit_yadav).pdf
Zoology 5th semester notes( Sumit_yadav).pdfZoology 5th semester notes( Sumit_yadav).pdf
Zoology 5th semester notes( Sumit_yadav).pdf
 
development of diagnostic enzyme assay to detect leuser virus
development of diagnostic enzyme assay to detect leuser virusdevelopment of diagnostic enzyme assay to detect leuser virus
development of diagnostic enzyme assay to detect leuser virus
 
Bacterial Identification and Classifications
Bacterial Identification and ClassificationsBacterial Identification and Classifications
Bacterial Identification and Classifications
 

Habitat suitability models: Predicting Sebastes presence at the Del Monte Shalebeds

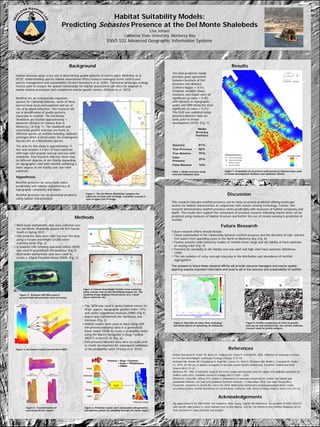
  • 1. Habitat Suitability Models: Predicting Sebastes Presence at the Del Monte Shalebeds Lisa Jensen California State University, Monterey Bay ENVS 532 Advanced Geographic Information Systems Background Habitat structure plays a key role in determining spatial patterns of marine biota (McArthur et al. 2010). Understanding species habitat associations offers resource managers better control over species management and sustainability (Grober-Dunsmore et al. 2008). Terrestrial landscape ecology metrics used to analyze the spatial relationships for habitat associations can often be adapted to marine habitat association and compliment marine specific metrics (Pittman et al. 2010). Methods Results References My appreciation to Dr. Rikk Kvitek, Pat Iampietro, Mary Young, Captain Bill Williamson, the students of ENVS 433/533 with specific appreciation to Jason Adelaars and Jessica Blakely, and the CSU Monterey Bay Seafloor Mapping Lab for their assistance in data collection and analysis. • Multi-beam bathymetric data were collected over the Del Monte Shalebeds aboard the R/V Harold Heath in Spring 2012. • Fish presence data were collected over five days using a Furuno searchlight CH250 sector scanning sonar (Fig. 2). • A Seabotix LBV remotely operated vehicle (ROV) was used to groundtruth fish presence (Fig 3). • Multi-beam bathymetric data were used to create a Digital Elevation Model (DEM) (Fig. 1). Figure 1. The Del Monte Shalebeds compose the substrate in lower part of image. A granitic outcrop is seen in upper left of image. Figure 3. Seabotix LBV ROV used to ground truth fish presence seen in Furuno. Figure 2. Furuno Searchlight CH250 sector scanning sonar sweeps side to side identifying targets (a). The resulting image displays fish presence as a “cloud” above substrate (b). Discussion This research indicates rockfish presence can be fairly accurately predicted utilizing landscape metrics for habitat characteristics in conjunction with remote sensing technology. Further, this research demonstrates rockfish presence varies predictably with measures of habitat complexity and depth. The results here support the conclusions of previous research indicating marine biota can be predicted using measures of habitat structure and further the use of remote sensing in prediction of rockfish. The final predictive model provides good agreement between locations of fish presence and absence (Cohen’s Kappa = 0.61). Predictor variables Slope, Eastness, and Depth were all significant (p-value < 0.05) with distance to topographic peaks and VRM being the most significant (p-value < 0.01). The GLM was validated using presence/absence data set aside prior to model development (20%) (Fig. 7). Figure 7. Probability of occurrence with presence/absence data used in model development (hollow) and validation (filled). Rockfish are an economically important species for California fisheries, some of these species have been overexploited and are at risk of localized extinction. This research will aid in identification of spatial patterns important to rockfish. The Del Monte Shalebeds are located approximately 1 kilometer offshore of Cannery Row in Monterey, CA (Fig. 1). The shalebeds and associated granitic outcrops are home to different species of rockfish including Sebastes pinninger which is listed under the Endangered Species Act as a threatened species. The area for this study is approximately 11 km2 and includes 4.4 km2 of hard substrate with high relief granitic outcrop and low relief shalebeds. Past research indicates there may be different degrees of site fidelity depending on topographic relief with rockfish exhibiting a lower degree of site fidelity over low relief substrate. Hypothesis: Rockfish presence on rocky reefs varies predictably with habitat characteristics of topographic complexity and depth. Rockfish presence can be accurately predicted using habitat characteristics. Presence ~ Slope + Eastness + Depth + TPI25distance + VRM25 Figure 6. Predictor values were associated with presence and absence points by sampling through the raster layers. Figure 4. Derivative rasters derived from DEM. Figure 5. Transformation of cyclical predictor, Aspect. • The DEM was used to derive habitat rasters for slope, aspect, topographic position index (TPI), and vector ruggedness measure (VRM) (Fig 4). • Aspect was transformed into Northness and Eastness (Fig. 5) • Habitat rasters were used as input along with fish presence/absence data in a generalized linear model (GLM) to create a probability raster using the Marine Geospatial Ecology Toolbox (MGET) in ArcGIS 10 (Fig. 6). • Fish presence/absence data were set aside prior to model development for subsequent validation of the probability raster (Young et al. 2010). a. b. Acknowledgements Grober-Dunsmore R, Frazer TK, Beets JP, Lindberg WJ, Zwick P, Funicelli NA. 2008. Influence of landscape structure on reef fish assemblages. Landscape Ecology 23(Supp 1):37-53. McArthur MA, Brooke BP, Przeslawski R, Ryan DA, Lucieer VL, Nicol S, McCallum AW, Mellin C, Cresswell ID, Radke LC. 2010. On the use of aboitoc currogates to describe marine benthic biodiversity. Estuarine, Coastal and Shelf Science 88(1):21-22. Matthews KR. 1990. A telemetric study of the home ranges and homing routes of copper and quillback rockfishes on shallow rocky reefs. Canadian Journal of Zoology 68(11):2243 – 2250. Pittman SJ, Costa BM, Jeffrey CFG, Caldow C. Importance of seascape complexity for reslient fish habitat and sustainable fisheries. 63rd Gulf and Caribbean Fisheries Institute; 1-5 November 2010; San Juan, Puerto Rico. Young MA, Iampietro PJ, Kvitek RG, Garza CD. 2010. Multivariate bathymetry-derived generalized linear model accurately predicts rockfish distribution on Cordell Bank, California, USA. Marine Ecology Progress Series 415:247-261. 10%False Absence 25% False Presence 75%True Absence 90%True Presence 81%Accuracy Model Accuracy Statistics Table 1. Model accuracy using reserved validation data. Figure 8. Direction of water flow, including beneficial effects of upwelling, at shalebeds. a. b. Figure 9. Profile comparison of relief at granitic outcrop (a) and shalebed (b), the red line indicates transect used for profile analysis. http://www.cencoos.org/sections/conditions/CENCAL_currents/mb_n ode.shtml Future research efforts should include: • Closer examination of the relationship between rockfish presence and the direction of cold, nutrient rich waters from upwelling zones to the North of Monterey Bay (Fig. 8). • Passive acoustic radio telemetry studies of rockfish home range and site fidelity at hard substrate of varying relief (Fig. 9) • Potential for variability in site fidelity over low relief and high relief hard substrate (Matthews 1990). • The role isolation of rocky outcrops may play in the distribution and abundance of rockfish aggregations. Future Research The answers to future these research efforts will provide resource managers and marine spatial planning experts important information and tools to aid in the recovery and sustainability of rockfish.