2. of 10−20 nm and 50−200 nm, respectively. As the evaporation
front receded toward the center of the shrinking droplet, it
appeared that the droplet became depinned and the GO sheets
become entrained, accumulated, and eventually deposited to
form the star-shaped assembly at the center region of the
droplet.
Figure 3d−f shows that the dried-out structure of GO sheets
printed on silicon substrates became continuous with
decreasing D from 50 to 20 μm at N = 1. Even with increasing
N to 5, the structure obtained with D = 50 μm remained largely
discontinuous (not shown). On the other hand, the structure
produced at D = 40 μm became more interconnected at N = 5.
Despite oxygen plasma substrate treatment prior to the printing
step, the effect of D on the formation of discontinuous
morphology was more pronounced on hydrophobic PET and
Kapton substrates than on hydrophilic silicon and glass
substrates. Nevertheless, 20 μm was determined to be an
adequate spacing to produce completely continuous morphol-
ogy even on Kapton and glass substrates used for optical
transparency and electrical sheet resistance (Rs) measurements.
Note that the printer used for this study was capable of
operating with 5 μm resolutions in the x- and y-directions.
Prior to the IR lamp treatment, characteristic GO peaks were
present in the Fourier transform infrared (FTIR) spectrum
(Figure 4a) including the following: (1) CO stretching
vibration at 1735 cm−1
, (2) OH stretching at 3428 cm−1
, (3)
OH deformation vibration at 1411 cm−1
, (4) aromatic CC
stretching vibration at 1610 cm−1
, and (5) alkoxy CO
stretching vibration at 1041 cm−1
.9
After the exposure, the 1411
cm−1
and 1041 cm−1
peaks disappeared with the 3428 cm−1
peak significantly decreased, and the small 1735 cm−1
peak still
remained. These changes suggested the significant removal of
OH functional groups from the exposed GO sheets.
However, the 1735 cm−1
peak did not disappear, suggesting
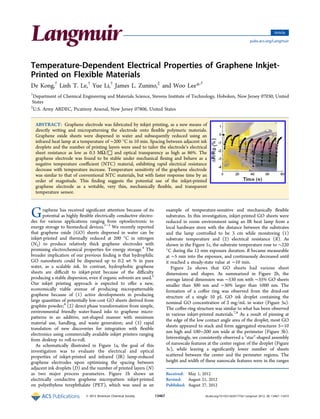
Figure 1. Flexible graphene micropatterns produced by inkjet-printing of GO sheets and photothermal reduction using an IR heat lamp in ambient
environment: (a) illustration of the overall processing concept with the spacing between adjacent ink droplets (D) and the number of printed layers
(N) as major printing variables; (b) micropatterns printed on a transparent PET substrate; and (c) electrical resistance and temperature changes
measured in real-time during the photothermal reduction step of the inkjet-printed graphene produced at D = 30 μm and N = 3.
Figure 2. (a) SEM image and (b) lateral size distribution of GO sheets deposited on Si from the dried-out structure of one ink droplet containing 0.1
mg/mL GO.
Langmuir Article
dx.doi.org/10.1021/la301775d | Langmuir 2012, 28, 13467−1347213468
3. that the CO stretching vibration of six-ring lactones was still
present.10
The 1610 cm−1
CC peak was present, indicating
that the sp2
structure of carbon atoms was retained.11
Two prominent Raman peaks were observed before and after
the IR lamp reduction step (Figure 4b): (1) G band
corresponding to the first-order scattering of photons by sp2
carbon atoms and (2) D band arising from small domain-sized
graphitic regions.12,13
The intensity ratio of the D to G bands
(ID/IG) increased from 0.79 to 0.94 upon reduction. This ratio
change suggested that (1) most of the oxygenated functional
groups were removed from GO sheets by the reduction step
and (2) sp2
network was established. Upon reduction, the G
band was slightly shifted to 1602 cm−1
from 1607 cm−1
.
However, the G and D bands of the reduced GO sheets present
at 1602 cm−1
and 1354 cm−1
were considerably higher than
those of chemically vapor deposited (CVD) graphene typically
Figure 3. Morphology of dried-out structures produced by a single GO ink droplet on Si: (a) SEM and (b,c) AFM images. (d,e,f) SEM images
showing the effects of decreasing D on the development of continuous film morphology on Si.
Figure 4. (a) FTIR and (b) Raman spectra of GO sheets before and after IR heat lamp reduction.
Figure 5. Effects of D and N on (a) electrical sheet resistance and (b) optical transparency.
Langmuir Article
dx.doi.org/10.1021/la301775d | Langmuir 2012, 28, 13467−1347213469
4. observed at 1575 cm−1
and 1350 cm−1
. These peak shifts
indicated the relative lack of sp2
character and the remaining
presence of some oxygenated functional groups, consistent with
the FTIR results.
The FTIR and Raman results suggested that the IR heat
lamp treatment was effective in reducing printed GO films to
graphene films to a significant extent, but not completely. The
IR lamp reduction method is expected to be particularly useful
for printing onto thermally and chemically sensitive materials
and devices. Also, this method is advantageous for easy
integration with roll-to-roll, additive manufacturing since it only
takes minutes as opposed to hours required for the thermal and
chemical methods without the need for controlled reduction
environments and equipment.
As shown in Figure 5a, Rs of the graphene electrodes
fabricated on Kapton decreased with (1) decreasing D and (2)
increasing N. At D = 40 μm, the films were not conductive at N
= 2, but became conductive with N = 3 at ∼26 MΩ/□ and
with N = 5 at 14 MΩ/□. The high Rs values of these samples
could be explained by (1) the development of noncontinuous
morphology at large D and small N and (2) consequently
blocking of electron transport paths. At D = 20 μm, Rs
decreased from ∼12 MΩ/□ to ∼0.3MΩ/□ with increasing
N from 2 to 5.
As shown in Figure 5b, graphene electrodes printed on glass
substrates became less transparent with (1) reducing D and (2)
increasing N. At D = 20 μm, transparency rapidly decreased
from ∼76% to 45% upon increasing N from 2 to 5. It is well-
known that an increase in the stacking of CVD graphene layers
decreases light transparency of 2.3% per graphene sheet.14
Assuming this number for our sample obtained at N = 2, we
roughly estimated that ∼10 graphene sheets may be stacked on
average to result in 76% transparency. This estimation was
consistent with the average thickness of the dried out structure
of each ink droplet being on the order of ∼10 nm as suggested
by the AFM data in Figures 3b and 3c.
Based on the above results, D = 20 μm and N = 2 were
determined to be optimum printing parameters for producing
Figure 6. (a) Relative electrical resistance changes upon mechanical bending. (b) Experimental configuration. Error bars represent 3 measurements
made for each bending angle.
Figure 7. (a) Temperature-dependence on electrical resistance. (b) Linear fit (red) between ln (R) versus T−1
. (c) Relative electrical resistance
responses upon repeated fingertip tapping. (d) Experimental configuration.
Langmuir Article
dx.doi.org/10.1021/la301775d | Langmuir 2012, 28, 13467−1347213470
5. continuous electrode morphology with Rs = 12 MΩ/□ at 76%
transparency. This optoelectrical performance is similar to that
reported by Torrisi et al.5
with Rs = 102
MΩ/□ at 74%
transparency for graphene sheets exfoliated by ultrasonicating
graphite powder, dispersed in an organic solvent, and inkjet-
printed. However, in comparison to CVD graphene,15,16
Rs of
our sample was about 7 orders of magnitude higher at a given
transparency of 86%. The lower Rs of the CVD graphene was
expected since it contains relatively defect-free graphene
structure. Nevertheless, the comparison highlights a significant
challenge associated with the use of inkjet-printed graphene for
optoelectronic applications.
Figure 6 shows that R of the electrode printed on Kapton at
D = 20 μm and N = 2 decreased with increasing the degree of
bending (2θ). The overall decrease in R was 5.6% at 2θ = 27.4°.
Apparently, local bending stresses increased the effective
mobility of electrons, although the mechanism behind this
behavior is not clear. Some hysteresis was observed during
recovery, but the resistance ultimately returned to the initial
value prior to bending. This recovery behavior implies that the
mechanical structure of the graphene electrode remained to be
relatively stable during the mechanical bending test.
Figure 7a shows that R of the graphene electrode decreased
significantly with temperature. The effect of the temperature on
the electrode resistance is similar to what has been recently
observed by (1) Sahoo et al.17
for filter-deposited and
chemically reduced GO sheets using hydrazine vapor and (2)
Zhuge et al.18
with filter-deposited and metal-defused GO
sheets. As shown in Figure 7b, the following equation was used
to model the observed temperature dependence as a negative
temperature coefficient (NTC) behavior
=
−
·
⎛
⎝
⎜
⎞
⎠
⎟R R B
T T
T T
exp
( )
T 0
0
0
where RT is the electrical resistance as a function of temperature
(T), B is the material constant and a measure of temperature
sensitivity, and R0 is the resistance at the reference temperature
(T0 = 298 K). From the data fitting, B was determined to be
1860 K in the temperature range of 298 to 358 K with the
respective resistance changes from 4.4 × 10⁶
to 2.4 × 10⁶
Ω.
This B value is close to that of the conventional metal oxide
NTC materials, typically in the range of 2000 to 5000 K.19
The
temperature coefficient of resistance (α) was also used as
another measure of temperature sensitivity where α = R−1
·(dR/
dT). α for our graphene electrodes was determined to be
−0.0148 K−1
at 298 K, which is about 1 order of magnitude
larger than that of the chemically reduced GO sheets17
as well
as that of metal-defused GO sheets.18
Also, the α value of our
graphene electrode is about 3 orders of magnitude higher than
that of carbon nanotubes.20
As shown in Figure 7c,d, temperature-sensing function of the
graphene electrode was evaluated by tapping the electrode with
a human finger in the ambient room environment. The
repeated taps resulted in the resistance decreases shown in the
Figure 7c. In contrast, no change in the resistance was observed
when the electrode was tapped with other objects that were in
thermal equilibrium with the room environment (not shown).
This observation also indicated that the effect of slight substrate
flexing during tapping on the resistance changes was much
smaller than that of touching with the finger tip. These results
suggested that the resistance changes were as a result of heat
transfer between the finger tip and the electrode.
The response time to the touching was about 0.5 s, and the
recovery time to its initial resistance value upon removing the
finger tip was about 10 s. In comparison, typical response time
for conventional NTC metal oxide materials is more than 10
s,21
suggesting an order-of-magnitude faster temperature-
sensing function of the inkjet-printed graphene electrode.
The observed NTC behavior suggests the inkjet-printed
graphene functions as an intrinsic semiconductor with perhaps
thermally activated transfer of electrons between the reduced
domains of the GO sheets as well as between the sheets. It
appears that a major reason for the fast time response of the
graphene electrode is a very small volume of the inkjet-printed
electrode and therefore a significantly lower thermal mass
involved with transient heat transfer.
In conclusion, our results suggest that micropatternable
graphene electrodes can be easily fabricated by inkjet printing
of GO sheets and subsequent photothermal reduction using the
IR heat lamp in ambient environment in about 10 min. D and
N were optimized as the major printing parameters to produce
the continuous morphology of the graphene electrode for
optimum Rs and transparency. R of the electrode decreased
during mechanical bending, but returned to its initial value
upon recovery, suggesting the electrode’s structural stability
with mechanical flexing. Also, the electrode’s NTC behavior
with high temperature sensitivity and fast response time
suggests new potential as a writable, very thin, flexible, and
transparent temperature sensor.
■ EXPERIMENTAL SECTION
Commercially available GO sheets (Cheap Tubes, Brattleboro, VT)
dispersed in water (2 mg/mL) were used to prepare inks at several GO
concentrations by dilution for some initial experiments. For most
experiments, 2 mg/mL was used as the nominal concentration of the
GO ink. The viscosity, surface tension, and ζ-potential of the nominal
GO ink were measured to 1.06 mPa·s, 68 N/m, and −20 mV,
respectively.4
Glass slides (1.2 mm thick, Thermo Scientific,
Portsmouth, NH), Kapton-HN (DuPont, Wilmington, DE), and
PET (3M, St. Paul, MN) films were used as examples of transparent
substrates. Also, polished Si (University Wafer, Boston, MA) was used
for characterization purposes. Glass and Si substrates were cleaned
using a piranha solution and deionized water several times, then dried
with nitrogen gas prior to printing. Si, Kapton, and PET were treated
with O2 plasma for 30 s prior to printing using Plasma Cleaner
(Harrick Plasma, Ithaca, NY).
As previously described,4
a Dimatix Material Printer (DMP 2831,
Fujifilm Dimatix, Santa Clara, CA) was used to print the GO inks
using cartridges that generate 10 pL droplets. The cartridge height and
substrate temperature were maintained at 0.5 mm and 25 °C,
respectively. GO electrodes were inkjet-printed as 0.8 cm × 0.8 cm
square patterns. The GO electrodes were reduced with an infrared
(IR) heat lamp (250 W, GE, Cleveland, OH). Raman spectroscopy
(Spectra Pro 2300i, Princeton Instrument, Trenton, NJ) was
conducted using the excitation line of 632.8 nm. FTIR (TENSOR
Series 27 FT-IR Spectrometers, Bruker Optics, Billerica, MA) was
performed in a transparency mode using 100 μL droplet-cast samples
on silicon before and after reduction. The drop casting method was
used for the FTIR measurements, since the signal from the printed
samples was not strong enough to be measured.
The morphology and pattern formation of the printed GO
electrodes were characterized by optical microscopy (SMZ1500,
Nikon, Melville, NJ) and scanning electron microscopy (SEM, Carl
Zeiss SMT Auriga FIB-SEM workstation, Peabody, MA), and atomic
force microscopy (AFM, Nanoink, Skokie, IL). Transparency was
recorded at 560 nm using a multimode microplate reader (Synergy
HT, BioTek Instruments, Inc., Winooski, VT).
Langmuir Article
dx.doi.org/10.1021/la301775d | Langmuir 2012, 28, 13467−1347213471
6. Rs was measured using a digital multimeter (Keithley Instruments
Inc., Cleveland, OH) and a custom-made four-point probe
configuration shown in Figure 5a. The four-point probe was prepared
by inkjet printing silver nanoparticles ink (Cabot Corporation, Boston,
MA) onto Kapton followed by annealing at 200 °C using a hot plate
(Corning, Lowell, MA) in the air. Electrical resistance changes during
the reduction process were measured by the multimeter with a
distance of 2 mm between two probes. Similarly, electrical resistance
changes during mechanical bending were measured with a distance of
0.8 mm between two probes. Temperature dependence character-
ization was conducted similarly using a tunable hot plate (Corning,
Lowell, MA) in the air and a thermocouple attached to the graphene
electrode. The fingertip tapping experiment was performed with the 4-
point probe device by applying a constant voltage of 10 V across the
sample and recording the corresponding current change using the
multimeter. The graphene electrode surface was covered with Scotch
tape, and a plastic glove was worn, as shown in Figure 7d.
■ AUTHOR INFORMATION
Corresponding Author
*E-mail: wlee@stevens.edu.
Notes
The authors declare no competing financial interest.
■ ACKNOWLEDGMENTS
The authors thank the U.S. Army - ARDEC for funding this
project under the contract of W15QKN-05-D-0011. This
research effort used microscope resources partially funded by
the National Science Foundation through NSF Grant DMR-
0922522. We also thank Andrew Ihnen at Stevens and Brian
Fuchs at ARDEC for various discussions.
■ REFERENCES
(1) Eda, G.; Fanchini, G.; Chhowalla, M. Large-area ultrathin films of
reduced graphene oxide as a transparent and flexible electronic
material. Nat. Nanotechnol. 2008, 3, 270−274.
(2) Cohen-Karni, T.; Qing, Q.; Li, Q.; Fang, Y.; Lieber, C. M.
Graphene and nanowire transistors for cellular interfaces and electrical
recording. Nano Lett. 2010, 10, 1098−1102.
(3) Shan, C.; Yang, H.; Song, J.; Han, D.; Ivaska, A.; Niu, L. Direct
electrochemistry of glucose oxidase and biosensing for glucose based
on graphene. Anal. Chem. 2009, 81, 2378−2382.
(4) Le, L. T.; Ervin, M. H.; Qiu, H.; Fuchs, B. E.; Lee, W. Y.
Graphene supercapacitor electrodes fabricated by inkjet printing and
thermal reduction of graphene oxide. Electrochem. Commun. 2011, 13,
355−358.
(5) Torrisi, F.; Wu, T. H., W.; Sun, Z.; Lombardo, A.; Kulmala, T.;
Hshieh, G. W.; Jung, S. J.; Bonaccorso, F.; Paul, P. J.; Chu, D. P.;
Ferrari, A. C. Ink-Jet Printed Graphene Electronics. ACS Nano 2012, 6
(4), 2992−3006.
(6) Jacoby, M. Graphene Moves Toward Applications. Chem. Eng.
News November 21, 2011.
(7) Kang, J. S.; Kim, H. S.; Ryu, J.; Hahn, H. T.; Jang, S.; Joung, J. W.
Inkjet printed electronics using copper nanoparticle ink. J. Mater. Sci.
Mater. Electronics 2010, 21, 1213−1220.
(8) Yoshitsugu, K.; Ueno, I. Effect of suspended particles on
spreading of volatile droplet on solid substrate. J. Vis. 2011, 14, 285−
294.
(9) Ren, P. G.; Yan, D. X.; Ji, X.; Chen, T.; Li, Z. M. Temperature
dependence of graphene oxide reduced by hydrazine hydrate.
Nanotechnology 2011, 22, 055705.
(10) Mei, X. G.; Ouyang, J. Y. Ultrasonication-assisted ultrafast
reduction of graphene oxide by zinc powder at room temperature.
Carbon 2011, 49, 5389−5397.
(11) Chen, W. F.; Yan, L. F.; Bangal, P. R. Preparation of graphene
by the rapid and mild thermal reduction of graphene oxide induced by
microwaves. Carbon 2010, 48, 1146−1152.
(12) Lin, Z.; Yao, Y.; Li, Z.; Liu, Y.; Li, Z.; Wong, C.-P. Solvent-
Assisted Thermal Reduction of Graphite Oxide. J. Phys. Chem. C 2010,
114, 14819−14825.
(13) Ferrari, A. C.; Robertson, J. Interpretation of Raman spectra of
disordered and amorphous carbon. Phys. Rev. B 2000, 61, 14095−
14107.
(14) Nair, R. R.; Blake, P.; Grigorenko, A. N.; Novoselov, K. S.;
Booth, T. J.; Stauber, T.; Peres, N. M. R.; Geim, A. K. Fine structure
constant defines visual transparency of graphene. Science 2008, 320,
1308.
(15) Kim, K. S.; Zhao, Y.; Jang, H.; Lee, S. Y.; Kim, J. M.; Kim, K. S.;
Ahn, J.-H.; Kim, P.; Choi, J.-Y.; Hong, B. H. Large-scale pattern
growth of graphene films for stretchable transparent electrodes. Nature
2009, 457, 706−710.
(16) Bae, S.; Kim, H.; Lee, Y.; Xu, X.; Park, J.-S.; Zheng, Y.;
Balakrishnan, J.; Lei, T.; Ri Kim, H.; Song, Y. I.; Kim, Y.-J.; Kim, K. S.;
Ozyilmaz, B.; Ahn, J.-H.; Hong, B. H.; Iijima, S. Roll-to-roll production
of 30-in. graphene films for transparent electrodes. Nat. Nanotechnol.
2010, 5, 574−578.
(17) Sahoo, S.; Barik, S. K.; Sharma, G. L.; Khurana, G.; Scott, J. F.;
Katiyar, R. S. Reduced graphene oxide as ultra fast temperature sensor.
2012, arXiv:1204.1928v1 [cond-mat.mes-hall].
(18) Zhuge, F.; Hu, B.; He, C.; Zhou, X.; Liu, Z.; Li, R. Mechanism of
nonvolatile resistive switching in graphene oxide thin films. Carbon
2011, 49, 3796−3802.
(19) Kang, J.; Ryu, J.; Han, G.; Choi, J.; Yoon, W.; Hahn, B.; Kim, J.;
Ahn, C.; Choi, J.; Park, D. LaNiO3 conducting particle dispersed
NiMn2O4 nanocomposite NTC thermistor thick films by aerosol
deposition. J. Alloys Compd. 2012, 534, 70−73.
(20) Bartolomeo, A. D.; Sarno, M.; Giubileo, F.; Altavilla, C.; Iemmo,
L.; Piano, S.; Bobba, F.; Longobardi, M.; Scarfato, A.; Sannino, D.;
Cucolo, A. M.; Ciambelli, P. Multiwalled carbon nanotube films as
small-sized temperature sensors. J. Appl. Phys. 2009, 105, 064518.
(21) Kanungo, J.; Saha, H.; Basu, S. Pd sensitized porous silicon
hydrogen sensorInfluence of ZnO thin film. Sens. Actuators, B:
Chem. 2010, 147, 128−136.
Langmuir Article
dx.doi.org/10.1021/la301775d | Langmuir 2012, 28, 13467−1347213472