SlideShare une entreprise Scribd logo
1  sur  9
Biology |Form 4 | Chapter 4: Chemical Composition in Cell 10
Activity 4.1
Aim To differentiate between reducing and non-reducing sugars.
Materials 5% glucose solution, 5% fructose solution, 5% galactose solution, 5% maltose solution, 5% lactose solution, 5% sucrose solution, dilute
hydrochloric acid, water, sodium hydrogen carbonate powder and Benedict’s solution
Apparatus Test tubes, beaker, Bunsen burner, tripod stand, wire gauze and test tube holder
A.Testing for reducing sugars
Procedure
1. 2 ml of Benedict’s solution are added to 2 ml of glucose solution in a test tube
2. The test tube is placed in a water bath of boiling water for 5 minutes.
3. The colour of the precipitate that is formed (if any) is recorded in the table below.
4. Steps 1 to 3 are repeated for all the other sugar solutions.
Results Sugar solution Benedict’s solution Sugar solution Benedict’s solution
Glucose Brick-red precipitate Maltose Brick-red precipitate
Fructose Brick-red precipitate Lactose Brick-red precipitate
Galactose Brick-red precipitate Sucrose Blue solution
Discussion 1. Glucose, fructose, galactose, maltose and lactose are reducing sugars because they give a positive Benedict’s test.
2. Sucrose is a non-reducing sugar because it gives a negative Benedict’s test.
B.Testing for non-reducing sugar
Procedure 1. 2 ml of sucrose solution and 1 ml of dilute hydrochloric acid are added to a test tube
2. The test tube is placed in a water bath and boiled for 5 minutes.
3. The test tube is cooled under a tap and sodium hydrogen carbonate powder is added to neutralize the excess acid.
4. When it stops fizzing, 2 ml of Benedict’s solution are added to the mixture in the test tube。
5. The test tube is placed in the water in the water bath again and boiled for 5 minutes.
Observation A brick red precipitate is formed in the test tube.
Biology |Form 4 | Chapter 4: Chemical Composition in Cell 11
Discussion 1. Sucrose is hydrolysed into glucose and fructose by boiling the sucrose solution with dilute hydrochloride acid.
2. When the solution containing glucose and fructose is boiled with Benedict’s solution, it produces a brick-red precipitate.
Conclusion Glucose, fructose, maltose are reducing sugars. Sucrose is non-reducing sugar.
Biology |Form 4 | Chapter 4: Chemical Composition in Cell 12
Experiment 4.1
Aim To study the effects of temperature on the activity of salivary amylase.
Problem statement What are the effects of temperature on the activity of salivary amylase?
Hypothesis The optimum temperature for salivary amylase is 37oC.
Variables (a) Manipulated variable: Temperature
(b) Responding variable: Rate of reaction
(c) Fixed variable: Volume and concentration of starch suspension, volume and concentration of saliva suspension, pH of starch and
saliva suspensions.
Apparatus Beakers, test tubes, tripod stand, wire gauze, Bunsen burner, thermometer, dropper, glass rod, syringes, stopwatch, spotting tile and test
tube rack
Materials 1% starch starch suspension, saliva, iodine solution, ice cubes and distilled water
Technique Recording the time taken for the complete hydrolysis of starch with a stopwatch. The presence of starch is indicated by the iodine test.
Biology |Form 4 | Chapter 4: Chemical Composition in Cell 13
Procedure
1. The mouth is rinsed with distilled water.
2. The saliva suspension is prepared by spitting into a small beaker and diluting the saliva with an amount of distilled water equal to
the amount of saliva.
3. Five water baths are prepared at the following temperatures: 0o
C, 20 o
C, 37 o
C, 50 o
C and 60 o
C.
4. Two test tubes are labelled P and Q.
5. 4 ml of starch suspension are placed in test tube P and 1 ml of saliva suspension in test tube Q.
6. Both test tubes are placed into the first water bath (at 60 o
C) for 5 minutes.
7. A drop of iodine solution is placed into each groove of a clean spotting tile.
8. A drop of suspension from test tube P is poured into the saliva suspension in test tube Q. The stopwatch is started immediately.
9. A drop of suspension is taken out from the test tube Q every minute and tested with iodine solution on the spotting tile.
10. Test tube Q is kept in the water bath thoughout the experiment.
11. The time taken for the complete hydrolysis of starch is recorded in the table, that is, when the iodine solution does not turn blue
anymore..
Biology |Form 4 | Chapter 4: Chemical Composition in Cell 14
12. Steps 4 to 9 are repeated for temperatures 20 o
C, 37 o
C, 50 o
C and 60 o
C.
13. The results are recorded in the table below.
14. A graph of rate of reaction against temperature (o
C) is plotted.
Results
Temperature of water
bath (o
C)
Time taken for complete
hydrolysis of starch, t (minute)
Rate of reaction,
(minute-1
)
0 >30 <0.03
20 8 0.13
37 0.33 3
50 6 0.17
60 >30. <0.03
Discussion 1. The test tubes P and Q are kept in the water bath for 5 minutes to stabilize the temperature of the suspensions in the two test tubes.
2. When the amylase in the saliva has completely hydrolysed the starch, the dark blue colour does not form in the iodine test.
3. At low temperatures, the reaction progresses slowly. As the temperature increases, the rate of reaction increases until the optimum
temperature of 37o
C is reached. Above the optimum temperature, the rate of reaction falls rapidly.
Conclusion The rate of reaction is highest at the temperature 37o
C. the hypothesis is accepted.
Biology |Form 4 | Chapter 4: Chemical Composition in Cell 15
Experiment 4.2
Aim To study the effects of pH on the activity of pepsin.
Problem statement What are the effects of pH on the activity of pepsin?
Hypothesis The enzyme pepsin works best in acidic conditions.
Variables (a) Manipulated variable: pH of medium
(b) Responding variable: Rate of reaction
(c) Fixed variable: Volume and concentration of egg albumen suspension, volume and concentration of pepsin solution, temperature of
medium
Materials Egg albumen suspension, dilute hydrochloride acid, dilute sodium hydroxide solution, 1% of pepsin solution, pH paper and distilled
water
Apparatus Beaker, tripod stand, wire gauze, Bunsen burner, thermometer, dropper, test tubes, test tube rack and syringes
Procedure
1. The egg albumen suspension is prepared by adding 1g of dried egg albumen to 100 cm3
of water. The mixture is then heated to
90o
C.
2. Three test tubes are labelled P,Q and R.
3. 5 ml of egg albumen suspension and 1 ml of pepsin solution are placed in each test tube.
4. 5 drops of distilled water are added to test tube P.
5. 5 drops of dilute hydrochloric acid are added to test tube Q.
6. 5 drops of dilute sodium hydroxide solution are added to test tube R.
7. All the three test tubes are placed into a water bath at 37o
C for 20 minutes.
8. The appearance of the contents in each test tube is recorded at the beginning and the end of the experiment.
9. The contents in each test tube are tested with pH paper.
10. The results are recorded in a table.
Biology |Form 4 | Chapter 4: Chemical Composition in Cell 16
Results Test
tube
pH Contents
Appearance of contents
At the beginning of the experiment At the end of the experiment
P 7 Albumen + pepsin + distilled water White suspension White suspension
Q 2
Albumen + pepsin + dilute
hydrochloric acid
White suspension Clear solution
R 9
Albumen + pepsin + dilute sodium
hydroxide solution
White suspension White suspension
Discussion 1. The test tubes are kept in a water bath maintained at 37o
C because that is the optimum temperature for pepsin.
2. The mixture in test tube Q is clear at the end of the experiment because the albumen has been hydrolysed.
3. Pepsin does not catalyse the hydrolysis of albumen in the neutral and in alkaline conditions.
Conclusion Pepsin catalyses the hydrolysis of protein only in acidic conditions. The hypothesis is accepted.
Biology |Form 4 | Chapter 4: Chemical Composition in Cell 17
Experiment 4.3
Aim To study the effects of substrate concentration on salivary amylase activity.
Problem statement What are the effects of substrate concentration on salivary amylase activity?
Hypothesis The rate of enzymatic reaction increases with the increase in substrate concentration until it reaches a maximum rate.
Variables (a) Manipulated variable: Substrate concentration
(b) Responding variable: Rate of concentration
(c) Fixed variable: Enzyme concentration, temperature, pH of starch and saliva suspension, volume of starch and saliva suspension
Materials 0.1%, 0.2%, 0.3%, 0.4%, 0.5% and 0.6% starch suspensions, saliva, iodine solution and distilled water
Apparatus Beakers, test tubes, tripod stand, wire gauze, Bunsen burner, thermometer, dropper, glass rod, syringes, stopwatch, spotting tile and test
tube rack
Technique Recording the time taken for the complete hydrolysis of starch with a stopwatch. The presence of starch is indicated by the iodine test.
Procedure 1. The mouth is rinsed with distilled water.
2. The saliva suspension is prepared by spitting into a small beaker and diluting the saliva with an amount of distilled water is equal to
the amount of saliva.
3. Six test tubes are labelled P, Q, R, S, T and Uare filled with the following starch suspensions using different syringe.
Test tube Type of starch suspension
P 4 ml 0.1% starch suspension
Q 4 ml 0.2% starch suspension
R 4 ml 0.3% starch suspension
S 4 ml 0.4% starch suspension
T 4 ml 0.5% starch suspension
U 4 ml 0.6% starch suspension
4. 1 ml of saliva suspension is placed in a test tube.
5. A drop of iodine solution is placed into each groove of a clean spotting tile.
6. Test tube P and the test tube containing the saliva suspension are placed into a water bath at 37o
C.
7. After 5 minutes, the saliva suspension is poured into the starch suspension in test tube P. the stopwatch is started immediately.
8. A drop of suspension is taken from test tube P every minute and tested with iodine solution on the spotting tile.
9. Test tube P is kept in the water bath throughout the experiment.
10. The time taken for the complete hydrolysis of starch is recorded in the table, that is, when the iodine solution does not turn blue
anymore.
11. Steps 4 to 10 are repeated for test tubes Q, R, S, T and U.
12. The results are recorded in the table below.
13. The graph of rate of reaction (% minute-1
) against concentration of starch suspension (%) is plotted.
Biology |Form 4 | Chapter 4: Chemical Composition in Cell 18
Results Concentration of starch
suspension, C (%)
Time taken for the complete hydrolysis of starch,t Rate of reaction = C/t
(% minute-1
)(seconds) (minutes)
0.1 300 5.00 0.02
0.2 300 5.00 0.04
0.3 300 5.00 0.06
0.4 300 5.00 0.08
0.5 375 6.25 0.08
0.6 450 7.50 0.08
Discussion 1. The rate of reaction increases with the increase in the concentration of the substrate (starch) concentration, that is from 0.1% to
0.4% starch suspension.
2. The maximum rate is reached at 0.4% starch suspension. At this point all the active sites of the enzymes are filled at anyone one
time. This is referred to as saturated point.
3. Beyond the saturation point, the rate of reaction does not increases even through the substrate concentration is increased because the
concentration of enzyme becomes a limiting concentration.
Conclusion The rate of enzymatic reaction increases with the increase in substrate concentration until it reaches a maximum rate. The hypothesis is
accepted.

Contenu connexe

Tendances

Spm chemistry formula list form 4
Spm chemistry formula list form 4Spm chemistry formula list form 4
Spm chemistry formula list form 4Zhang Ewe
 
chapter 6: nutrition-food test
chapter 6: nutrition-food testchapter 6: nutrition-food test
chapter 6: nutrition-food testLim Yee Yern
 
Chemistry paper 3
Chemistry paper 3Chemistry paper 3
Chemistry paper 3Ina Amalina
 
Naftalena
NaftalenaNaftalena
Naftalenakghuda
 
Bab 2 struktur atom
Bab 2   struktur atomBab 2   struktur atom
Bab 2 struktur atomjalinialias
 
Amali wajib biologi kssm tingkatan 4
Amali wajib biologi kssm tingkatan 4Amali wajib biologi kssm tingkatan 4
Amali wajib biologi kssm tingkatan 4NORRAZITABINTIMOKHTA
 
Data Logger: Melting and Freezing Points of Naphthalene
Data Logger: Melting and Freezing Points of NaphthaleneData Logger: Melting and Freezing Points of Naphthalene
Data Logger: Melting and Freezing Points of NaphthaleneRochelle Ning
 
INVESTIGATE THE PROPERTIES OF IONIC BOND AND COVALENT BOND THROUGH AN EXPERIMENT
INVESTIGATE THE PROPERTIES OF IONIC BOND AND COVALENT BOND THROUGH AN EXPERIMENTINVESTIGATE THE PROPERTIES OF IONIC BOND AND COVALENT BOND THROUGH AN EXPERIMENT
INVESTIGATE THE PROPERTIES OF IONIC BOND AND COVALENT BOND THROUGH AN EXPERIMENTMISS ESTHER
 
Physics form 4 (definition)
Physics form 4 (definition)Physics form 4 (definition)
Physics form 4 (definition)Fatini Adnan
 
Activity 6.7 Investigate the colour of the salts and their solubility in water
Activity 6.7 Investigate the colour of the salts and their solubility in waterActivity 6.7 Investigate the colour of the salts and their solubility in water
Activity 6.7 Investigate the colour of the salts and their solubility in waterMISS ESTHER
 
Construction of Ionic Equations through the Continuous Variation Method
Construction of Ionic Equations through the Continuous Variation MethodConstruction of Ionic Equations through the Continuous Variation Method
Construction of Ionic Equations through the Continuous Variation MethodMISS ESTHER
 
paper 3 physics form 4
paper 3 physics form 4 paper 3 physics form 4
paper 3 physics form 4 astchr148
 
ACTION OF HEAT ON CARBONATE AND NITRATE SALT
ACTION OF HEAT ON CARBONATE AND NITRATE SALTACTION OF HEAT ON CARBONATE AND NITRATE SALT
ACTION OF HEAT ON CARBONATE AND NITRATE SALTMISS ESTHER
 
Chapter 4 science FORM 2 KSSM
Chapter 4 science FORM 2 KSSMChapter 4 science FORM 2 KSSM
Chapter 4 science FORM 2 KSSMjamilahshafii
 
Answering questions technique physics spm paper 3
Answering questions technique physics spm paper 3Answering questions technique physics spm paper 3
Answering questions technique physics spm paper 3firdaus_mfm
 
Spm physics-formula-list-form4
Spm physics-formula-list-form4Spm physics-formula-list-form4
Spm physics-formula-list-form4Salty Tay Xian
 
Soalan tubi-f4-kimia-bab-3-formula-persamaan-kimia
Soalan tubi-f4-kimia-bab-3-formula-persamaan-kimiaSoalan tubi-f4-kimia-bab-3-formula-persamaan-kimia
Soalan tubi-f4-kimia-bab-3-formula-persamaan-kimiaSchool of Visual Arts
 
6.10 EFFECT OF HEAT ON SALT
6.10 EFFECT OF HEAT ON SALT6.10 EFFECT OF HEAT ON SALT
6.10 EFFECT OF HEAT ON SALTMISS ESTHER
 
Jadual ion kimia
Jadual ion kimia Jadual ion kimia
Jadual ion kimia alhalfeast
 

Tendances (20)

Spm chemistry formula list form 4
Spm chemistry formula list form 4Spm chemistry formula list form 4
Spm chemistry formula list form 4
 
chapter 6: nutrition-food test
chapter 6: nutrition-food testchapter 6: nutrition-food test
chapter 6: nutrition-food test
 
Chemistry paper 3
Chemistry paper 3Chemistry paper 3
Chemistry paper 3
 
Naftalena
NaftalenaNaftalena
Naftalena
 
Bab 2 struktur atom
Bab 2   struktur atomBab 2   struktur atom
Bab 2 struktur atom
 
Amali wajib biologi kssm tingkatan 4
Amali wajib biologi kssm tingkatan 4Amali wajib biologi kssm tingkatan 4
Amali wajib biologi kssm tingkatan 4
 
SPM PHYSICS-PAPER-3--GUIDE-
SPM PHYSICS-PAPER-3--GUIDE-SPM PHYSICS-PAPER-3--GUIDE-
SPM PHYSICS-PAPER-3--GUIDE-
 
Data Logger: Melting and Freezing Points of Naphthalene
Data Logger: Melting and Freezing Points of NaphthaleneData Logger: Melting and Freezing Points of Naphthalene
Data Logger: Melting and Freezing Points of Naphthalene
 
INVESTIGATE THE PROPERTIES OF IONIC BOND AND COVALENT BOND THROUGH AN EXPERIMENT
INVESTIGATE THE PROPERTIES OF IONIC BOND AND COVALENT BOND THROUGH AN EXPERIMENTINVESTIGATE THE PROPERTIES OF IONIC BOND AND COVALENT BOND THROUGH AN EXPERIMENT
INVESTIGATE THE PROPERTIES OF IONIC BOND AND COVALENT BOND THROUGH AN EXPERIMENT
 
Physics form 4 (definition)
Physics form 4 (definition)Physics form 4 (definition)
Physics form 4 (definition)
 
Activity 6.7 Investigate the colour of the salts and their solubility in water
Activity 6.7 Investigate the colour of the salts and their solubility in waterActivity 6.7 Investigate the colour of the salts and their solubility in water
Activity 6.7 Investigate the colour of the salts and their solubility in water
 
Construction of Ionic Equations through the Continuous Variation Method
Construction of Ionic Equations through the Continuous Variation MethodConstruction of Ionic Equations through the Continuous Variation Method
Construction of Ionic Equations through the Continuous Variation Method
 
paper 3 physics form 4
paper 3 physics form 4 paper 3 physics form 4
paper 3 physics form 4
 
ACTION OF HEAT ON CARBONATE AND NITRATE SALT
ACTION OF HEAT ON CARBONATE AND NITRATE SALTACTION OF HEAT ON CARBONATE AND NITRATE SALT
ACTION OF HEAT ON CARBONATE AND NITRATE SALT
 
Chapter 4 science FORM 2 KSSM
Chapter 4 science FORM 2 KSSMChapter 4 science FORM 2 KSSM
Chapter 4 science FORM 2 KSSM
 
Answering questions technique physics spm paper 3
Answering questions technique physics spm paper 3Answering questions technique physics spm paper 3
Answering questions technique physics spm paper 3
 
Spm physics-formula-list-form4
Spm physics-formula-list-form4Spm physics-formula-list-form4
Spm physics-formula-list-form4
 
Soalan tubi-f4-kimia-bab-3-formula-persamaan-kimia
Soalan tubi-f4-kimia-bab-3-formula-persamaan-kimiaSoalan tubi-f4-kimia-bab-3-formula-persamaan-kimia
Soalan tubi-f4-kimia-bab-3-formula-persamaan-kimia
 
6.10 EFFECT OF HEAT ON SALT
6.10 EFFECT OF HEAT ON SALT6.10 EFFECT OF HEAT ON SALT
6.10 EFFECT OF HEAT ON SALT
 
Jadual ion kimia
Jadual ion kimia Jadual ion kimia
Jadual ion kimia
 

En vedette

Physiochemical characterization of starch from different sorghum varieties
Physiochemical characterization of starch from different sorghum varietiesPhysiochemical characterization of starch from different sorghum varieties
Physiochemical characterization of starch from different sorghum varietiesAlexis Prillhart
 
Form 4 chapter 4 - chemical composition of cell
Form 4 chapter 4 - chemical composition of cellForm 4 chapter 4 - chemical composition of cell
Form 4 chapter 4 - chemical composition of cellQashira Izlan
 
Chap 1 chemical_composition_of_the_cell
Chap 1 chemical_composition_of_the_cellChap 1 chemical_composition_of_the_cell
Chap 1 chemical_composition_of_the_cellacloving
 
West Kendall Earth Day Festival - Sponsorship
West Kendall Earth Day Festival - SponsorshipWest Kendall Earth Day Festival - Sponsorship
West Kendall Earth Day Festival - SponsorshipClaudia Lascano
 
50 old proverbs English, French, German, Dutch- M. van eijk
50 old proverbs  English, French, German, Dutch-  M. van eijk50 old proverbs  English, French, German, Dutch-  M. van eijk
50 old proverbs English, French, German, Dutch- M. van eijkZadkine
 
Chemical Compounds In Cells Power Point
Chemical  Compounds In  Cells Power PointChemical  Compounds In  Cells Power Point
Chemical Compounds In Cells Power Point♥Moriah♥
 
Chapter 4: 4.4 to 4.5
Chapter 4: 4.4 to 4.5Chapter 4: 4.4 to 4.5
Chapter 4: 4.4 to 4.5maieymuhamad
 
Biodegradation of starch
Biodegradation of starch   Biodegradation of starch
Biodegradation of starch Vipin Kannan
 
Cell membrane 93 2010
Cell membrane 93 2010Cell membrane 93 2010
Cell membrane 93 2010dnyanesh amle
 
Soalan past year esei no 10
Soalan past year esei no 10Soalan past year esei no 10
Soalan past year esei no 10hasliza mokhri
 
form 4 biology chap 4 pt5
form 4 biology chap 4 pt5form 4 biology chap 4 pt5
form 4 biology chap 4 pt5cikgushaik
 
Contoh brosur hari-guru
Contoh brosur hari-guruContoh brosur hari-guru
Contoh brosur hari-guruMARTIN JANTAI
 

En vedette (20)

Physiochemical characterization of starch from different sorghum varieties
Physiochemical characterization of starch from different sorghum varietiesPhysiochemical characterization of starch from different sorghum varieties
Physiochemical characterization of starch from different sorghum varieties
 
Form 4 chapter 4 - chemical composition of cell
Form 4 chapter 4 - chemical composition of cellForm 4 chapter 4 - chemical composition of cell
Form 4 chapter 4 - chemical composition of cell
 
Chap 1 chemical_composition_of_the_cell
Chap 1 chemical_composition_of_the_cellChap 1 chemical_composition_of_the_cell
Chap 1 chemical_composition_of_the_cell
 
Chemical compounds in cells
Chemical compounds in cellsChemical compounds in cells
Chemical compounds in cells
 
Hari bumi
Hari bumiHari bumi
Hari bumi
 
West Kendall Earth Day Festival - Sponsorship
West Kendall Earth Day Festival - SponsorshipWest Kendall Earth Day Festival - Sponsorship
West Kendall Earth Day Festival - Sponsorship
 
Bio p3 spm trial sbp 08
Bio p3 spm trial sbp 08Bio p3 spm trial sbp 08
Bio p3 spm trial sbp 08
 
AFMC Biology 2008
AFMC Biology 2008AFMC Biology 2008
AFMC Biology 2008
 
50 old proverbs English, French, German, Dutch- M. van eijk
50 old proverbs  English, French, German, Dutch-  M. van eijk50 old proverbs  English, French, German, Dutch-  M. van eijk
50 old proverbs English, French, German, Dutch- M. van eijk
 
Chemical Compounds In Cells Power Point
Chemical  Compounds In  Cells Power PointChemical  Compounds In  Cells Power Point
Chemical Compounds In Cells Power Point
 
Chapter 4: 4.4 to 4.5
Chapter 4: 4.4 to 4.5Chapter 4: 4.4 to 4.5
Chapter 4: 4.4 to 4.5
 
Biodegradation of starch
Biodegradation of starch   Biodegradation of starch
Biodegradation of starch
 
Cell membrane 93 2010
Cell membrane 93 2010Cell membrane 93 2010
Cell membrane 93 2010
 
1000 english proverbs
1000 english proverbs1000 english proverbs
1000 english proverbs
 
Soalan past year esei no 10
Soalan past year esei no 10Soalan past year esei no 10
Soalan past year esei no 10
 
form 4 biology chap 4 pt5
form 4 biology chap 4 pt5form 4 biology chap 4 pt5
form 4 biology chap 4 pt5
 
Contoh brosur hari-guru
Contoh brosur hari-guruContoh brosur hari-guru
Contoh brosur hari-guru
 
Biology notes
Biology notesBiology notes
Biology notes
 
Buku program-hari-guru-2014
Buku program-hari-guru-2014Buku program-hari-guru-2014
Buku program-hari-guru-2014
 
CS Biology Form 4
CS Biology Form 4CS Biology Form 4
CS Biology Form 4
 

Similaire à Chapter 4: Chemical Composition of the Cell

hemistry-Project-Class-XII-2021-22-Investigatory-Project.pdf
hemistry-Project-Class-XII-2021-22-Investigatory-Project.pdfhemistry-Project-Class-XII-2021-22-Investigatory-Project.pdf
hemistry-Project-Class-XII-2021-22-Investigatory-Project.pdfparteet310
 
Enzyme hydrolysis of starch
Enzyme hydrolysis of starchEnzyme hydrolysis of starch
Enzyme hydrolysis of starchOkanya Virginus
 
Carbohydrate
CarbohydrateCarbohydrate
CarbohydrateRohit K.
 
Isolation of Carbohydrates - Experiment no. 4
Isolation of Carbohydrates - Experiment no. 4Isolation of Carbohydrates - Experiment no. 4
Isolation of Carbohydrates - Experiment no. 4Narella Rebullar
 
Urine Testing for Detection of presence of glucose and proteins
Urine Testing for Detection of presence of glucose and proteinsUrine Testing for Detection of presence of glucose and proteins
Urine Testing for Detection of presence of glucose and proteinsTaniyaMondal6
 
Ayan_Chemistry_ClassXII.pptx
Ayan_Chemistry_ClassXII.pptxAyan_Chemistry_ClassXII.pptx
Ayan_Chemistry_ClassXII.pptxAyan50932
 
Biochemical reactions PPT.pptx
Biochemical reactions PPT.pptxBiochemical reactions PPT.pptx
Biochemical reactions PPT.pptxMonishabasavaraj
 
Chemistry project for Class 12
Chemistry project for Class 12Chemistry project for Class 12
Chemistry project for Class 12Shahban Ali
 
Water analysis and testing
Water analysis and testingWater analysis and testing
Water analysis and testingNEHA MISHRA
 
Carbohydrates - Experiment No. 3
Carbohydrates - Experiment No. 3Carbohydrates - Experiment No. 3
Carbohydrates - Experiment No. 3Narella Rebullar
 
Microbiological examination of water2
Microbiological examination of water2Microbiological examination of water2
Microbiological examination of water2Fatimah Tahir
 
Investigatory Project chemistry.pdf
Investigatory Project chemistry.pdfInvestigatory Project chemistry.pdf
Investigatory Project chemistry.pdfpratyushmohapatra808
 

Similaire à Chapter 4: Chemical Composition of the Cell (20)

chemistry project (1).docx
chemistry project (1).docxchemistry project (1).docx
chemistry project (1).docx
 
Lab discussion
Lab discussionLab discussion
Lab discussion
 
hemistry-Project-Class-XII-2021-22-Investigatory-Project.pdf
hemistry-Project-Class-XII-2021-22-Investigatory-Project.pdfhemistry-Project-Class-XII-2021-22-Investigatory-Project.pdf
hemistry-Project-Class-XII-2021-22-Investigatory-Project.pdf
 
Enzyme hydrolysis of starch
Enzyme hydrolysis of starchEnzyme hydrolysis of starch
Enzyme hydrolysis of starch
 
Carbohydrate
CarbohydrateCarbohydrate
Carbohydrate
 
adnan adil, S/O:- md monir alam, vill:-kesath, chauparan, hazaribagh (study a...
adnan adil, S/O:- md monir alam, vill:-kesath, chauparan, hazaribagh (study a...adnan adil, S/O:- md monir alam, vill:-kesath, chauparan, hazaribagh (study a...
adnan adil, S/O:- md monir alam, vill:-kesath, chauparan, hazaribagh (study a...
 
Isolation of Carbohydrates - Experiment no. 4
Isolation of Carbohydrates - Experiment no. 4Isolation of Carbohydrates - Experiment no. 4
Isolation of Carbohydrates - Experiment no. 4
 
Kriti
KritiKriti
Kriti
 
Urine Testing for Detection of presence of glucose and proteins
Urine Testing for Detection of presence of glucose and proteinsUrine Testing for Detection of presence of glucose and proteins
Urine Testing for Detection of presence of glucose and proteins
 
Ayan_Chemistry_ClassXII.pptx
Ayan_Chemistry_ClassXII.pptxAyan_Chemistry_ClassXII.pptx
Ayan_Chemistry_ClassXII.pptx
 
Exp 1 (A)
Exp 1 (A)Exp 1 (A)
Exp 1 (A)
 
Biochemical reactions PPT.pptx
Biochemical reactions PPT.pptxBiochemical reactions PPT.pptx
Biochemical reactions PPT.pptx
 
Chemistry project for Class 12
Chemistry project for Class 12Chemistry project for Class 12
Chemistry project for Class 12
 
P3 q2 bio_latihan
P3 q2 bio_latihanP3 q2 bio_latihan
P3 q2 bio_latihan
 
Water analysis and testing
Water analysis and testingWater analysis and testing
Water analysis and testing
 
Carbohydrates - Experiment No. 3
Carbohydrates - Experiment No. 3Carbohydrates - Experiment No. 3
Carbohydrates - Experiment No. 3
 
Ninhydrin.ppt
Ninhydrin.pptNinhydrin.ppt
Ninhydrin.ppt
 
EXP 7&8.pdf
EXP 7&8.pdfEXP 7&8.pdf
EXP 7&8.pdf
 
Microbiological examination of water2
Microbiological examination of water2Microbiological examination of water2
Microbiological examination of water2
 
Investigatory Project chemistry.pdf
Investigatory Project chemistry.pdfInvestigatory Project chemistry.pdf
Investigatory Project chemistry.pdf
 

Dernier

HỌC TỐT TIẾNG ANH 11 THEO CHƯƠNG TRÌNH GLOBAL SUCCESS ĐÁP ÁN CHI TIẾT - CẢ NĂ...
HỌC TỐT TIẾNG ANH 11 THEO CHƯƠNG TRÌNH GLOBAL SUCCESS ĐÁP ÁN CHI TIẾT - CẢ NĂ...HỌC TỐT TIẾNG ANH 11 THEO CHƯƠNG TRÌNH GLOBAL SUCCESS ĐÁP ÁN CHI TIẾT - CẢ NĂ...
HỌC TỐT TIẾNG ANH 11 THEO CHƯƠNG TRÌNH GLOBAL SUCCESS ĐÁP ÁN CHI TIẾT - CẢ NĂ...Nguyen Thanh Tu Collection
 
Active Learning Strategies (in short ALS).pdf
Active Learning Strategies (in short ALS).pdfActive Learning Strategies (in short ALS).pdf
Active Learning Strategies (in short ALS).pdfPatidar M
 
4.18.24 Movement Legacies, Reflection, and Review.pptx
4.18.24 Movement Legacies, Reflection, and Review.pptx4.18.24 Movement Legacies, Reflection, and Review.pptx
4.18.24 Movement Legacies, Reflection, and Review.pptxmary850239
 
Oppenheimer Film Discussion for Philosophy and Film
Oppenheimer Film Discussion for Philosophy and FilmOppenheimer Film Discussion for Philosophy and Film
Oppenheimer Film Discussion for Philosophy and FilmStan Meyer
 
Transaction Management in Database Management System
Transaction Management in Database Management SystemTransaction Management in Database Management System
Transaction Management in Database Management SystemChristalin Nelson
 
AUDIENCE THEORY -CULTIVATION THEORY - GERBNER.pptx
AUDIENCE THEORY -CULTIVATION THEORY -  GERBNER.pptxAUDIENCE THEORY -CULTIVATION THEORY -  GERBNER.pptx
AUDIENCE THEORY -CULTIVATION THEORY - GERBNER.pptxiammrhaywood
 
ENG 5 Q4 WEEk 1 DAY 1 Restate sentences heard in one’s own words. Use appropr...
ENG 5 Q4 WEEk 1 DAY 1 Restate sentences heard in one’s own words. Use appropr...ENG 5 Q4 WEEk 1 DAY 1 Restate sentences heard in one’s own words. Use appropr...
ENG 5 Q4 WEEk 1 DAY 1 Restate sentences heard in one’s own words. Use appropr...JojoEDelaCruz
 
Millenials and Fillennials (Ethical Challenge and Responses).pptx
Millenials and Fillennials (Ethical Challenge and Responses).pptxMillenials and Fillennials (Ethical Challenge and Responses).pptx
Millenials and Fillennials (Ethical Challenge and Responses).pptxJanEmmanBrigoli
 
GRADE 4 - SUMMATIVE TEST QUARTER 4 ALL SUBJECTS
GRADE 4 - SUMMATIVE TEST QUARTER 4 ALL SUBJECTSGRADE 4 - SUMMATIVE TEST QUARTER 4 ALL SUBJECTS
GRADE 4 - SUMMATIVE TEST QUARTER 4 ALL SUBJECTSJoshuaGantuangco2
 
Activity 2-unit 2-update 2024. English translation
Activity 2-unit 2-update 2024. English translationActivity 2-unit 2-update 2024. English translation
Activity 2-unit 2-update 2024. English translationRosabel UA
 
Daily Lesson Plan in Mathematics Quarter 4
Daily Lesson Plan in Mathematics Quarter 4Daily Lesson Plan in Mathematics Quarter 4
Daily Lesson Plan in Mathematics Quarter 4JOYLYNSAMANIEGO
 
4.16.24 Poverty and Precarity--Desmond.pptx
4.16.24 Poverty and Precarity--Desmond.pptx4.16.24 Poverty and Precarity--Desmond.pptx
4.16.24 Poverty and Precarity--Desmond.pptxmary850239
 
Q4-PPT-Music9_Lesson-1-Romantic-Opera.pptx
Q4-PPT-Music9_Lesson-1-Romantic-Opera.pptxQ4-PPT-Music9_Lesson-1-Romantic-Opera.pptx
Q4-PPT-Music9_Lesson-1-Romantic-Opera.pptxlancelewisportillo
 
Influencing policy (training slides from Fast Track Impact)
Influencing policy (training slides from Fast Track Impact)Influencing policy (training slides from Fast Track Impact)
Influencing policy (training slides from Fast Track Impact)Mark Reed
 
How to Add Barcode on PDF Report in Odoo 17
How to Add Barcode on PDF Report in Odoo 17How to Add Barcode on PDF Report in Odoo 17
How to Add Barcode on PDF Report in Odoo 17Celine George
 
Measures of Position DECILES for ungrouped data
Measures of Position DECILES for ungrouped dataMeasures of Position DECILES for ungrouped data
Measures of Position DECILES for ungrouped dataBabyAnnMotar
 
INTRODUCTION TO CATHOLIC CHRISTOLOGY.pptx
INTRODUCTION TO CATHOLIC CHRISTOLOGY.pptxINTRODUCTION TO CATHOLIC CHRISTOLOGY.pptx
INTRODUCTION TO CATHOLIC CHRISTOLOGY.pptxHumphrey A Beña
 
MULTIDISCIPLINRY NATURE OF THE ENVIRONMENTAL STUDIES.pptx
MULTIDISCIPLINRY NATURE OF THE ENVIRONMENTAL STUDIES.pptxMULTIDISCIPLINRY NATURE OF THE ENVIRONMENTAL STUDIES.pptx
MULTIDISCIPLINRY NATURE OF THE ENVIRONMENTAL STUDIES.pptxAnupkumar Sharma
 
Keynote by Prof. Wurzer at Nordex about IP-design
Keynote by Prof. Wurzer at Nordex about IP-designKeynote by Prof. Wurzer at Nordex about IP-design
Keynote by Prof. Wurzer at Nordex about IP-designMIPLM
 

Dernier (20)

HỌC TỐT TIẾNG ANH 11 THEO CHƯƠNG TRÌNH GLOBAL SUCCESS ĐÁP ÁN CHI TIẾT - CẢ NĂ...
HỌC TỐT TIẾNG ANH 11 THEO CHƯƠNG TRÌNH GLOBAL SUCCESS ĐÁP ÁN CHI TIẾT - CẢ NĂ...HỌC TỐT TIẾNG ANH 11 THEO CHƯƠNG TRÌNH GLOBAL SUCCESS ĐÁP ÁN CHI TIẾT - CẢ NĂ...
HỌC TỐT TIẾNG ANH 11 THEO CHƯƠNG TRÌNH GLOBAL SUCCESS ĐÁP ÁN CHI TIẾT - CẢ NĂ...
 
Active Learning Strategies (in short ALS).pdf
Active Learning Strategies (in short ALS).pdfActive Learning Strategies (in short ALS).pdf
Active Learning Strategies (in short ALS).pdf
 
4.18.24 Movement Legacies, Reflection, and Review.pptx
4.18.24 Movement Legacies, Reflection, and Review.pptx4.18.24 Movement Legacies, Reflection, and Review.pptx
4.18.24 Movement Legacies, Reflection, and Review.pptx
 
YOUVE GOT EMAIL_FINALS_EL_DORADO_2024.pptx
YOUVE GOT EMAIL_FINALS_EL_DORADO_2024.pptxYOUVE GOT EMAIL_FINALS_EL_DORADO_2024.pptx
YOUVE GOT EMAIL_FINALS_EL_DORADO_2024.pptx
 
Oppenheimer Film Discussion for Philosophy and Film
Oppenheimer Film Discussion for Philosophy and FilmOppenheimer Film Discussion for Philosophy and Film
Oppenheimer Film Discussion for Philosophy and Film
 
Transaction Management in Database Management System
Transaction Management in Database Management SystemTransaction Management in Database Management System
Transaction Management in Database Management System
 
AUDIENCE THEORY -CULTIVATION THEORY - GERBNER.pptx
AUDIENCE THEORY -CULTIVATION THEORY -  GERBNER.pptxAUDIENCE THEORY -CULTIVATION THEORY -  GERBNER.pptx
AUDIENCE THEORY -CULTIVATION THEORY - GERBNER.pptx
 
ENG 5 Q4 WEEk 1 DAY 1 Restate sentences heard in one’s own words. Use appropr...
ENG 5 Q4 WEEk 1 DAY 1 Restate sentences heard in one’s own words. Use appropr...ENG 5 Q4 WEEk 1 DAY 1 Restate sentences heard in one’s own words. Use appropr...
ENG 5 Q4 WEEk 1 DAY 1 Restate sentences heard in one’s own words. Use appropr...
 
Millenials and Fillennials (Ethical Challenge and Responses).pptx
Millenials and Fillennials (Ethical Challenge and Responses).pptxMillenials and Fillennials (Ethical Challenge and Responses).pptx
Millenials and Fillennials (Ethical Challenge and Responses).pptx
 
GRADE 4 - SUMMATIVE TEST QUARTER 4 ALL SUBJECTS
GRADE 4 - SUMMATIVE TEST QUARTER 4 ALL SUBJECTSGRADE 4 - SUMMATIVE TEST QUARTER 4 ALL SUBJECTS
GRADE 4 - SUMMATIVE TEST QUARTER 4 ALL SUBJECTS
 
Activity 2-unit 2-update 2024. English translation
Activity 2-unit 2-update 2024. English translationActivity 2-unit 2-update 2024. English translation
Activity 2-unit 2-update 2024. English translation
 
Daily Lesson Plan in Mathematics Quarter 4
Daily Lesson Plan in Mathematics Quarter 4Daily Lesson Plan in Mathematics Quarter 4
Daily Lesson Plan in Mathematics Quarter 4
 
4.16.24 Poverty and Precarity--Desmond.pptx
4.16.24 Poverty and Precarity--Desmond.pptx4.16.24 Poverty and Precarity--Desmond.pptx
4.16.24 Poverty and Precarity--Desmond.pptx
 
Q4-PPT-Music9_Lesson-1-Romantic-Opera.pptx
Q4-PPT-Music9_Lesson-1-Romantic-Opera.pptxQ4-PPT-Music9_Lesson-1-Romantic-Opera.pptx
Q4-PPT-Music9_Lesson-1-Romantic-Opera.pptx
 
Influencing policy (training slides from Fast Track Impact)
Influencing policy (training slides from Fast Track Impact)Influencing policy (training slides from Fast Track Impact)
Influencing policy (training slides from Fast Track Impact)
 
How to Add Barcode on PDF Report in Odoo 17
How to Add Barcode on PDF Report in Odoo 17How to Add Barcode on PDF Report in Odoo 17
How to Add Barcode on PDF Report in Odoo 17
 
Measures of Position DECILES for ungrouped data
Measures of Position DECILES for ungrouped dataMeasures of Position DECILES for ungrouped data
Measures of Position DECILES for ungrouped data
 
INTRODUCTION TO CATHOLIC CHRISTOLOGY.pptx
INTRODUCTION TO CATHOLIC CHRISTOLOGY.pptxINTRODUCTION TO CATHOLIC CHRISTOLOGY.pptx
INTRODUCTION TO CATHOLIC CHRISTOLOGY.pptx
 
MULTIDISCIPLINRY NATURE OF THE ENVIRONMENTAL STUDIES.pptx
MULTIDISCIPLINRY NATURE OF THE ENVIRONMENTAL STUDIES.pptxMULTIDISCIPLINRY NATURE OF THE ENVIRONMENTAL STUDIES.pptx
MULTIDISCIPLINRY NATURE OF THE ENVIRONMENTAL STUDIES.pptx
 
Keynote by Prof. Wurzer at Nordex about IP-design
Keynote by Prof. Wurzer at Nordex about IP-designKeynote by Prof. Wurzer at Nordex about IP-design
Keynote by Prof. Wurzer at Nordex about IP-design
 

Chapter 4: Chemical Composition of the Cell

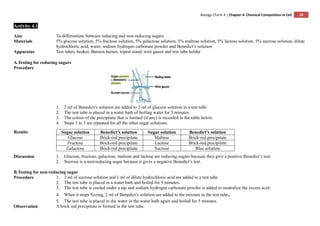
  • 1. Biology |Form 4 | Chapter 4: Chemical Composition in Cell 10 Activity 4.1 Aim To differentiate between reducing and non-reducing sugars. Materials 5% glucose solution, 5% fructose solution, 5% galactose solution, 5% maltose solution, 5% lactose solution, 5% sucrose solution, dilute hydrochloric acid, water, sodium hydrogen carbonate powder and Benedict’s solution Apparatus Test tubes, beaker, Bunsen burner, tripod stand, wire gauze and test tube holder A.Testing for reducing sugars Procedure 1. 2 ml of Benedict’s solution are added to 2 ml of glucose solution in a test tube 2. The test tube is placed in a water bath of boiling water for 5 minutes. 3. The colour of the precipitate that is formed (if any) is recorded in the table below. 4. Steps 1 to 3 are repeated for all the other sugar solutions. Results Sugar solution Benedict’s solution Sugar solution Benedict’s solution Glucose Brick-red precipitate Maltose Brick-red precipitate Fructose Brick-red precipitate Lactose Brick-red precipitate Galactose Brick-red precipitate Sucrose Blue solution Discussion 1. Glucose, fructose, galactose, maltose and lactose are reducing sugars because they give a positive Benedict’s test. 2. Sucrose is a non-reducing sugar because it gives a negative Benedict’s test. B.Testing for non-reducing sugar Procedure 1. 2 ml of sucrose solution and 1 ml of dilute hydrochloric acid are added to a test tube 2. The test tube is placed in a water bath and boiled for 5 minutes. 3. The test tube is cooled under a tap and sodium hydrogen carbonate powder is added to neutralize the excess acid. 4. When it stops fizzing, 2 ml of Benedict’s solution are added to the mixture in the test tube。 5. The test tube is placed in the water in the water bath again and boiled for 5 minutes. Observation A brick red precipitate is formed in the test tube.
  • 2. Biology |Form 4 | Chapter 4: Chemical Composition in Cell 11 Discussion 1. Sucrose is hydrolysed into glucose and fructose by boiling the sucrose solution with dilute hydrochloride acid. 2. When the solution containing glucose and fructose is boiled with Benedict’s solution, it produces a brick-red precipitate. Conclusion Glucose, fructose, maltose are reducing sugars. Sucrose is non-reducing sugar.
  • 3. Biology |Form 4 | Chapter 4: Chemical Composition in Cell 12 Experiment 4.1 Aim To study the effects of temperature on the activity of salivary amylase. Problem statement What are the effects of temperature on the activity of salivary amylase? Hypothesis The optimum temperature for salivary amylase is 37oC. Variables (a) Manipulated variable: Temperature (b) Responding variable: Rate of reaction (c) Fixed variable: Volume and concentration of starch suspension, volume and concentration of saliva suspension, pH of starch and saliva suspensions. Apparatus Beakers, test tubes, tripod stand, wire gauze, Bunsen burner, thermometer, dropper, glass rod, syringes, stopwatch, spotting tile and test tube rack Materials 1% starch starch suspension, saliva, iodine solution, ice cubes and distilled water Technique Recording the time taken for the complete hydrolysis of starch with a stopwatch. The presence of starch is indicated by the iodine test.
  • 4. Biology |Form 4 | Chapter 4: Chemical Composition in Cell 13 Procedure 1. The mouth is rinsed with distilled water. 2. The saliva suspension is prepared by spitting into a small beaker and diluting the saliva with an amount of distilled water equal to the amount of saliva. 3. Five water baths are prepared at the following temperatures: 0o C, 20 o C, 37 o C, 50 o C and 60 o C. 4. Two test tubes are labelled P and Q. 5. 4 ml of starch suspension are placed in test tube P and 1 ml of saliva suspension in test tube Q. 6. Both test tubes are placed into the first water bath (at 60 o C) for 5 minutes. 7. A drop of iodine solution is placed into each groove of a clean spotting tile. 8. A drop of suspension from test tube P is poured into the saliva suspension in test tube Q. The stopwatch is started immediately. 9. A drop of suspension is taken out from the test tube Q every minute and tested with iodine solution on the spotting tile. 10. Test tube Q is kept in the water bath thoughout the experiment. 11. The time taken for the complete hydrolysis of starch is recorded in the table, that is, when the iodine solution does not turn blue anymore..
  • 5. Biology |Form 4 | Chapter 4: Chemical Composition in Cell 14 12. Steps 4 to 9 are repeated for temperatures 20 o C, 37 o C, 50 o C and 60 o C. 13. The results are recorded in the table below. 14. A graph of rate of reaction against temperature (o C) is plotted. Results Temperature of water bath (o C) Time taken for complete hydrolysis of starch, t (minute) Rate of reaction, (minute-1 ) 0 >30 <0.03 20 8 0.13 37 0.33 3 50 6 0.17 60 >30. <0.03 Discussion 1. The test tubes P and Q are kept in the water bath for 5 minutes to stabilize the temperature of the suspensions in the two test tubes. 2. When the amylase in the saliva has completely hydrolysed the starch, the dark blue colour does not form in the iodine test. 3. At low temperatures, the reaction progresses slowly. As the temperature increases, the rate of reaction increases until the optimum temperature of 37o C is reached. Above the optimum temperature, the rate of reaction falls rapidly. Conclusion The rate of reaction is highest at the temperature 37o C. the hypothesis is accepted.
  • 6. Biology |Form 4 | Chapter 4: Chemical Composition in Cell 15 Experiment 4.2 Aim To study the effects of pH on the activity of pepsin. Problem statement What are the effects of pH on the activity of pepsin? Hypothesis The enzyme pepsin works best in acidic conditions. Variables (a) Manipulated variable: pH of medium (b) Responding variable: Rate of reaction (c) Fixed variable: Volume and concentration of egg albumen suspension, volume and concentration of pepsin solution, temperature of medium Materials Egg albumen suspension, dilute hydrochloride acid, dilute sodium hydroxide solution, 1% of pepsin solution, pH paper and distilled water Apparatus Beaker, tripod stand, wire gauze, Bunsen burner, thermometer, dropper, test tubes, test tube rack and syringes Procedure 1. The egg albumen suspension is prepared by adding 1g of dried egg albumen to 100 cm3 of water. The mixture is then heated to 90o C. 2. Three test tubes are labelled P,Q and R. 3. 5 ml of egg albumen suspension and 1 ml of pepsin solution are placed in each test tube. 4. 5 drops of distilled water are added to test tube P. 5. 5 drops of dilute hydrochloric acid are added to test tube Q. 6. 5 drops of dilute sodium hydroxide solution are added to test tube R. 7. All the three test tubes are placed into a water bath at 37o C for 20 minutes. 8. The appearance of the contents in each test tube is recorded at the beginning and the end of the experiment. 9. The contents in each test tube are tested with pH paper. 10. The results are recorded in a table.
  • 7. Biology |Form 4 | Chapter 4: Chemical Composition in Cell 16 Results Test tube pH Contents Appearance of contents At the beginning of the experiment At the end of the experiment P 7 Albumen + pepsin + distilled water White suspension White suspension Q 2 Albumen + pepsin + dilute hydrochloric acid White suspension Clear solution R 9 Albumen + pepsin + dilute sodium hydroxide solution White suspension White suspension Discussion 1. The test tubes are kept in a water bath maintained at 37o C because that is the optimum temperature for pepsin. 2. The mixture in test tube Q is clear at the end of the experiment because the albumen has been hydrolysed. 3. Pepsin does not catalyse the hydrolysis of albumen in the neutral and in alkaline conditions. Conclusion Pepsin catalyses the hydrolysis of protein only in acidic conditions. The hypothesis is accepted.
  • 8. Biology |Form 4 | Chapter 4: Chemical Composition in Cell 17 Experiment 4.3 Aim To study the effects of substrate concentration on salivary amylase activity. Problem statement What are the effects of substrate concentration on salivary amylase activity? Hypothesis The rate of enzymatic reaction increases with the increase in substrate concentration until it reaches a maximum rate. Variables (a) Manipulated variable: Substrate concentration (b) Responding variable: Rate of concentration (c) Fixed variable: Enzyme concentration, temperature, pH of starch and saliva suspension, volume of starch and saliva suspension Materials 0.1%, 0.2%, 0.3%, 0.4%, 0.5% and 0.6% starch suspensions, saliva, iodine solution and distilled water Apparatus Beakers, test tubes, tripod stand, wire gauze, Bunsen burner, thermometer, dropper, glass rod, syringes, stopwatch, spotting tile and test tube rack Technique Recording the time taken for the complete hydrolysis of starch with a stopwatch. The presence of starch is indicated by the iodine test. Procedure 1. The mouth is rinsed with distilled water. 2. The saliva suspension is prepared by spitting into a small beaker and diluting the saliva with an amount of distilled water is equal to the amount of saliva. 3. Six test tubes are labelled P, Q, R, S, T and Uare filled with the following starch suspensions using different syringe. Test tube Type of starch suspension P 4 ml 0.1% starch suspension Q 4 ml 0.2% starch suspension R 4 ml 0.3% starch suspension S 4 ml 0.4% starch suspension T 4 ml 0.5% starch suspension U 4 ml 0.6% starch suspension 4. 1 ml of saliva suspension is placed in a test tube. 5. A drop of iodine solution is placed into each groove of a clean spotting tile. 6. Test tube P and the test tube containing the saliva suspension are placed into a water bath at 37o C. 7. After 5 minutes, the saliva suspension is poured into the starch suspension in test tube P. the stopwatch is started immediately. 8. A drop of suspension is taken from test tube P every minute and tested with iodine solution on the spotting tile. 9. Test tube P is kept in the water bath throughout the experiment. 10. The time taken for the complete hydrolysis of starch is recorded in the table, that is, when the iodine solution does not turn blue anymore. 11. Steps 4 to 10 are repeated for test tubes Q, R, S, T and U. 12. The results are recorded in the table below. 13. The graph of rate of reaction (% minute-1 ) against concentration of starch suspension (%) is plotted.
  • 9. Biology |Form 4 | Chapter 4: Chemical Composition in Cell 18 Results Concentration of starch suspension, C (%) Time taken for the complete hydrolysis of starch,t Rate of reaction = C/t (% minute-1 )(seconds) (minutes) 0.1 300 5.00 0.02 0.2 300 5.00 0.04 0.3 300 5.00 0.06 0.4 300 5.00 0.08 0.5 375 6.25 0.08 0.6 450 7.50 0.08 Discussion 1. The rate of reaction increases with the increase in the concentration of the substrate (starch) concentration, that is from 0.1% to 0.4% starch suspension. 2. The maximum rate is reached at 0.4% starch suspension. At this point all the active sites of the enzymes are filled at anyone one time. This is referred to as saturated point. 3. Beyond the saturation point, the rate of reaction does not increases even through the substrate concentration is increased because the concentration of enzyme becomes a limiting concentration. Conclusion The rate of enzymatic reaction increases with the increase in substrate concentration until it reaches a maximum rate. The hypothesis is accepted.