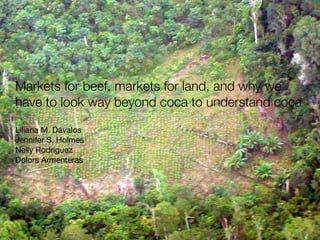
Markets for beef, markets for land, and why we have to look way beyond coca to understand coca
•
1 like•355 views

Davalos invited lecture on coca and beef SBU 2013

Recommended
Recommended
More Related Content
Similar to Markets for beef, markets for land, and why we have to look way beyond coca to understand coca
Similar to Markets for beef, markets for land, and why we have to look way beyond coca to understand coca (6)
More from Liliana Davalos
More from Liliana Davalos (20)
Recently uploaded
Recently uploaded (20)
Markets for beef, markets for land, and why we have to look way beyond coca to understand coca
- 1. Markets for beef, markets for land, and why we have to look way beyond coca to understand coca Liliana M. Dávalos Jennifer S. Holmes Nelly Rodriguez Dolors Armenteras
- 2. Two kinds of questions Biological diversity Diversificatio n, increase decrease Habitat loss
- 3. How important are habitats? Schipper et al. 2008 Science Hoffmann et al. 2011 PTRSB Understanding habitat change
- 4. Vaupes, Colombia 2009 Antioquia, Colombia 2010 Understanding habitat change
- 5. Why deforestation? Geist & Lambin 2002 BioScience Understanding habitat change
- 6. World Bank Statistics 2012 Population growth over time Understanding habitat change
- 7. An in-depth look • Guaviare from 2001-2010 • One of two large foci of Plan Colombia (the other was Putumayo) • Poor development indicators • Extractive land uses Guaviare, Colombia 2008 Understanding habitat change
- 8. 50 45 40 35 30 2200 2000 1800 1600 1400 ● ● ● ● Forest ● ● ● ● 50 45 40 35 30 NP 40 35 30 2500 2000 1500 ● ● Pasture ● ● ● ● ● ● 28 30 32 34 36 38 40 3 2 400 350 300 250 200 150 Coca ● ● ● ● ● ● ● ● 2.5 2.0 1.5 1.0 0.5 700 ● 650 600 550 500 ● ● ● ● ● ● ● 50 45 40 35 30 PA (ha) 350 300 250 200 150 ● ● ● ● ● ● ● ● 28 30 32 34 36 38 40 14 12 10 8 6 4 2 ● ● ● ●● ● ● ● 2.5 2.0 1.5 1.0 0.5 110 100 90 ● ● ● ● ● ● ● ● 50 45 40 35 30 PLAND ENN (m) 120 115 110 105 100 95 ● ● ● ● ● ● ● ● 28 30 32 34 36 38 40 PLAND 600 500 400 300 ● ● ● ● ● ● ● ● 2.5 2.0 1.5 1.0 0.5 PLAND Figure 2 A B G C D E F H I 25 2001 2004 2007 2010 25 2001 2004 2007 2010 1 2001 2004 2007 2010 PLAND K L M Fate of forest, fate of coca Dávalos et al. In Review Global Environ Chang Understanding habitat change
- 9. Hamburger! (or steak) Kaimowitz et al. 2004 CIFOR Three explanations Understanding habitat change Coca Dávalos et al. 2011 Environ Sci Technol Land tenure and property Hecht 1993 BioScience
- 10. If coca were the cause • Perhaps eradication is the solution • Great because we can solve coca Understanding habitat change coca decrease Eradication
- 11. San Jose El Retorno Calamar A B C Figure 90,000 60,000 30,000 2,200 2,000 1,800 30 20 10 Year Ranching GDP (109 pesos) Price of beef (pesos/Kg) Cattle 2000 2002 2004 2006 2008 2010 1,600 There are cows but no money • Relationship cows:pasture yields ~ 1.08 cow/ha • This is up to 10X overestimate • Beef prices have barely budged • Ranching revenues have plummeted Understanding habitat change Dávalos et al. In Review Global Environ Chang
- 12. ● ● ● ● ● ● ● ● ● ● ● ● ● ● ● ● ● ● ● ● ● ● ● ● ● ● ● ● ● ● ● ● ● 6000 4000 2000 0 3000 6000 9000 Eradication previous year (ha) Coca cultivation (ha) 5 ● 5 mpio ● ● ● Calamar Retorno San Jose Coca declined • Forest was lost • But coca declined • Was coca decline caused by fumigation? • Analyses show no relationship Dávalos et al. In Review Global Environ Chang Understanding habitat change
- 13. Why did coca decline? • Each municipality started out with different amounts of coca • As the municipalities become more urban, there is less coca • At ~50% urban population there is 0 coca in the smaller municipalities Dávalos et al. In Review Global Municipality ● ● ● Calamar El Retorno San Jose ● ● 6,000 4,000 A B Figure 6 ● ● ● ● ● ● ● ● ● ● ●● ● ● ● ● ● ● ● ● ● 40 30 20 30,000 60,000 90,000 Cattle Percentage land pasture ● ● ● ● ● ● ● ● ● ● ● ● ● ● ● ● ● ● ● ● ● ● ● ● ● ● ● ● ● ● ● 2,000 30 40 50 60 Percentage population urban Coca cultivation (ha) Environ Chang Understanding habitat change
- 14. San Jose El Retorno Calamar A B C Figure 5 2010 0.06 0.04 0.02 0.00 50 40 30 20 5 4 3 2 2000 2002 2004 2006 2008 Year Property Tax (106 pesos/capita) Construction GDP (109 pesos) Financial GDP (109 pesos) What urbanization looks like • Urban people paying more taxes that finance construction • Finance becomes important • Less dependence on ranching (and agriculture) Dávalos et al. In Review Global Environ Chang Understanding habitat change
- 15. Urban cows! • Cows enhance claim to the land • The region is rapidly urbanizing • Per capita taxes are rising => property values are rising • Clearing the land to sell in future urban market Dávalos et al. In Review Global Environ Chang Understanding habitat change
- 16. A disturbing development model • Development excludes coca • Not eradication • Development centered on a model of settlement that is destructive • And probably not peaceful Guaviare, Colombia 2008
- 17. coca nothing More decrease Eradication Urbanization Development Missing the real point & Understanding habitat change becomes Pasture & Cows property is
- 18. Thanks! • Funding • CIDER –SBU • Collaborators conservation & policy • A. Bejarano, A. Corthals, L. Correa, C. Romero • Dávalos Lab • P. Connell, M. Hall, E. Simola, G. Tudda