SlideShare a Scribd company logo
1 of 15
Defining and Testing the Value Proposition of
Outside-in Planning Processes
Author. Lora Cecere, Founder of Supply Chain Insights
Pandemic. Inflation. Global unrest. Labor shifts. Supply shortages. Food instability. Water pattern
changes. Global migration. Entergy outages. Talent transition. Over the past three years, the supply
chain team faced challenge after challenge. Disruption is the new normal.
For the supply chain leader, the unprecedented demand and supply shifts test traditional processes.
Historic practices are unequal to the challenge of continued disruption.
Traditional supply chain processes are inside-out. Tight integration to enterprise data makes an
organization insular—a risk in a time of disruption. While companies focus on reducing risk impacts on
the business, the focus is only on supply. Managing demand and supply together using outside-in signals
and translating market-to-market effects is an opportunity.
This new approach tests current practices and makes many technologies and approaches touted by
supply chain leaders, consultants, and business leaders obsolete.
Defining Outside-in Processes
Data surrounds the enterprise providing needed signals, but 80% is unused. The primary reason?
Tradition.
The focus has been on making organizational decisions using enterprise data for decades. Based on the
belief that the order is a good proxy for demand, the promise was to use supply chain planning to align
to better serve the customer based on history. But what happens when history is no longer a good
predictor of future demand? Companies encountered this issue during the pandemic. As a result, supply
chain planners turned off traditional optimization and utilized spreadsheets to make over 90% of
decisions feeding the input into descriptive analytics or overriding the outputs of traditional planning
systems.
To understand the value proposition of a new approach—using outside-in data and aligning internal
functions to a balanced scorecard—Supply Chain Insights partnered with o9 Solutions using the moniker
of Project Zebra in four pilots with manufacturers from 2019 to 2022. Through the facilitation of a group
discussion in an advisory group composed of nine business leaders, two consultants, four academics,
and three technologists, supply chain leaders worked together to define nine new business processes to
build outside-in processes.
The goal was simple. How could companies use market data to decrease the time to sense and improve
the response?
Figure 1. Advisory Group for the Kick-off of Project Zebra
Advisory Board Members First Year of Project Zebra: Phillipe Lambotte, Tonal; Rebecca Vohl, BSH; Dave Winstone,
Dow Chemical; Daniel Corsten, IE Business School; Douglas Kent, ASCM; Bob Masching, Trident Seafood; Peter
Schram, Independent Consultant; Chris Tyas, Retired Nestle; Jason Robke, Boeing; Stephanie Thomas, University of
Arkansas; Steven Daugherty, Samsung; Lora Cecere, Supply Chain Insights; Fred Baumann, o9 Solutions; Lukasz
Zieba, o9 Solutions; Tanguy Caillet, o9 Solutions; Olivier Redon, Schneider Electric; Yossi Sheffi, MIT; and Arnd
Huchzermeier, WHU.
In Figure 2, we depict a pictorial of the group’s work using SCOR methodology at the end of the two-year
journey.
Figure 2. Overview of an Outside-in Approach Using the SCOR Methodology
Starting with Defining the Problems with the Current State
The genesis of the Project Zebra work starts with the question, “Can supply chain leaders change their
processes and adapt like Zebras changing their stripes in the wild?” Each zebra has unique markings
designed to provide camouflage for survival. Initially, the belief was that the Zebra’s patterns were
inherited and did not change, but scientists learned that Zebras change their stripes to adapt over time.
In contrast, supply chain leaders struggle to adapt their processes and evolve as market conditions
change.
The term supply chain, as defined in 1982 by Keith Oliver, a British Logistician, is the process of planning,
implementing, and controlling the operations of the supply chain with the purpose of satisfying
customer requirements as efficiently as possible1
. Today, across organizations, there are many
definitions for the supply chain. In Figure 3, we share the response from a recent survey on the
reporting relationships within the supply chain organization.
Figure 3. Reporting Relationships Within the Supply Chain Organization
While organizations bandy-about terms like End-to-End Supply Chain Management, the data models for
planning are functional. The transportation, manufacturing, and order management technologies have
little in common. End-to-end planning systems are not today’s reality. Instead, today’s systems focus on
improving functional optima based on enterprise data. While technologists clearly defined the
transactional processes of order-to-cash and procure-to-pay, the decision support processes of market
signal-to-buy plan in procurement or plan to commit in customer service needs more clarity, with each
organization implementing differently. In addition, with today’s technologies, there is no way to connect
optimization outputs to rules and policies effectively. Each system and functional group varies by goal,
1
Keith Oliver - Wikipedia, November 23, 2022
sub-optimizing balance sheet results, and throwing the supply chain out of balance. As shown in Figure
4, organizations lack alignment. Most struggle to define supply chain excellence.
Figure 4. Supply Chain Alignment Pre-Pandemic
In Advanced Planning Systems, optimization engines mine the order patterns with the consumption of
this historical representation of demand as an input into the processes of deliver, make and source
without bi-directional trade-offs or connection to rules and policies. Traditional optimization approaches
focus on improving local optima focused primarily on cost reduction or trade-offs between cost and
service without linking to the balance sheet.
In this process, inventory is the most critical buffer to absorb demand and supply volatility. The design of
these buffers is essential, and a focus only on finished goods safety stock management is insufficient.
Ironically, inventory is also the most significant source of waste, or MUDA, in the supply chain creating
organizational tension. (The Japanese “Muda” word (無駄) translates as uselessness or futility. In Lean
management, Muda represents the changes or actions that do not cause a value-increasing effect on the
product or drive improvement that a customer will be happy to pay for.)
Table 1. Definition of Form and Function of Inventory
While the traditional solutions focused on safety stock, few existing approaches helped business leaders
understand the form and function of inventory as defined in Table 1. This gap increased in importance
with the impact of the pandemic. (Based on demand and supply variation, the form and function of
inventory assess where and how to store inventory and design buffers. For example, as variability
increases, companies need to shift from holding finished goods to storing raw materials and semi-
finished goods.)
In Project Zebra, the measured Coefficient of Variation (COV) differences of the demand signal at each
node. By measuring both, the shifts in COV and latency by node and role, the importance of using
outside-in signals becomes more apparent, especially in translating a demand signal for manufacturing
or procurement processes.
Figure 5. Increase in Inventory Across Industry Segments Over Periods from 2004-2021
As shown in Figure 5, companies hold 27 more days of inventory in 2022 than at the beginning of the
recession in 2007. The reason? There are three. The impact of longer in-transit and manufacturing cycle
times increased inventories. (Long global supply chain shipping times increased cycle times while
product proliferation on the long tail of products due to item proliferation increased manufacturing
cycle stock.) Over the last decade, as supply and demand variability increased, traditional approaches
focusing only on safety stock management based on demand variability were insufficient.
The Process
In the market today, technologists compete with each other, and business leaders adopt existing
definitions. As new forms of analytics evolve, the definition of supply chain planning remains rooted in
history, despite the explosion of market data, the promise of NoSQL with ontological learning, and graph
databases.
Figure 6. Capturing the Essence of the Advisory Group Kick-off Using a Visual Facilitator
The advisory board
exploration to define outside-
in processes kicked off in
January 2020. The group
started by closely examining
current processes and asking
the questions:
 What are the gaps in
today’s approaches?
 How can the process be
improved through the use of
market data?
 What market data is
available? How can it be
used?
 How do we define the
value of process
improvement?
 With the advancement
of analytics, how can
different forms of data be
used to improve decision
support?
To help crystallize the learning, a visual artist captured the essence of each advisory group session. The
discussion captured in Figure 6 was the start of the effort. In the session, the group agreed to hold
themselves to humility, openness, active listening, and openness to the outcome. The largest barrier
was unlearning the basics of current processes.
Through a series of experiential activities, the group defined the future state of demand as a river with
multiple flows based on demand and supply variability and the identification of supply chain constraints.
In exploring the topic of constraints, it is clear that the current focus is only on modeling manufacturing
constraints and balancing planned orders. Instead, the group needed to model the logistics and
procurement constraints.
A constraint restrictions system output. The constraint acts as a throttle, establishing
an upper limit of the output. The constraint is circumvented by designing a process or
system to work around it or by outsourcing work to another entity that is not subject
to the same constraint.
Today’s approach to planning has many limitations. The first is the visibility of constraints by the
executive team. Constraints shift as the mix of products changes or the market shifts for demand
preferences. As a result, most plans are out of touch with both the process capabilities and market
potential.
A second limitation is the number of optimization engines that need to be aligned. Most organizations
have nine planning engines not connected through a unified data model. For example, the output of
trade promotion optimization in consumer products and demand planning needs to have alignment and
connection. Promotion planning occurs in a silo without agreement on market potential. As a result,
companies primarily shift demand from period to period without shaping demand (increasing demand
lift). Worse still, most large manufacturers don’t use the optimization capabilities focused on checkbook
functionality to control expenditures based on historical spending.
The third issue is the lack of visibility of market potential or baseline demand. Without this visibility,
sales, marketing, and supply chain teams operate in isolation with different and often conflicting process
gyrations. The demand processes are not synchronized and lack a common view of market potential.
The market potential is the demand for products or services without demand shaping.
Demand-shaping activities by sales and marketing include shifts in price, promotion,
placement, advertisement, or excitement through new product launches. Demand
shifting moves an order from period to period without increasing market potential
and driving growth. Demand shifting increases cost and the bullwhip effect.
In the current state, teams work in silos. The work is separated by function, with a heavy dependence on
spreadsheets. The use of spreadsheets stems from the need for more flexibility in current systems to
model and test plan feasibility. During the pandemic, spreadsheets were the primary tool for modeling
driving more than 90% of the decisions.
In the future, with the implementation of outside-in processes, there will be clear visibility of
constraints, demand latency, market potential, and supply chain capabilities. The organization is aligned.
Based on flows, not time-phased data, the plans allow the modeling as markets change. Demand data is
translated into role-based views for aligned consumption by delivery, manufacturing, and procurement
teams. The redefinition enables an adaptive response. A working analogy is a plan much like weather
forecasting: multiple scenarios are visible and consumed by groups as conditions shift.
Figure 7. Development of Future Planning Models from Time-phased Views to Flow
The future state hinges on mining multiple data inputs simultaneously using a learning engine informed
by a planning master data layer. The master data layer ensures that the planning factors like lead times,
conversion rates, and currency valuations are updated based on market shifts.
Figure 8. Redefinition of Planning Engines
At the end of the two years of working together through a series of workshops, the group reflected on
the experience. In Figure 9, we share the learnings. The biggest challenge of this group of experienced
supply chain professionals was unlearning: it is tough to rethink the definition of planning. Surprisingly,
the unlearning was more challenging for consultants and technologists in the workshops than for the
business leaders.
Figure 9. Advisory Group Key Insights at the End of Two Years of Workshops
A critical insight at the end
of two years of work: the
most significant challenge
is unlearning traditional
supply chain processes.
Unlearning is demanding,
requiring education and
rethinking current
definitions.
Methodology
After facilitating workshops with the advisory group, the team compiled the learning into a virtual three-
day seminar. The class, advertised on Linkedin, filled up to capacity in twenty-four hours. During
January-March 2022, forty-eight supply chain leaders from thirty-two companies attended the training
classes. To improve their learning, the attendees were assigned a homework activity at the end of each
day. The two actions were: to draw and share their river of demand and define an opportunity for bi-
directional orchestration.
The river of demand activity designed to help business leaders rethink demand as a flow outside-in and
break the paradigm of inside-out planning based on transactional data with a time-phased output was
the first activity. To help companies understand supply chain principles and similarities, an artist redrew
and anonymized these drawings while matching the artistic rendering to the planner’s voice using QR
codes.
Common issues were the tight coupling of Sales and Operations (S&OP) planning to the budget process
and the constriction as the markets fluctuated. The inability to manage inventory appropriately with
market shifts and the need for organizational alignment.
To drive a feasible plan, the constraints need to be modeled to drive plan feasibility. The constraints
include labor availability in distribution, sourcing supply shortages, manufacturing capacity,
transportation availability, and warehouse storage capacity. Today, the only constraint considered in
Advanced Planning Systems (APS) is manufacturing line capacity. As a result, only 28% of companies feel
their output from their planning solution is feasible.
Figure 10. Drawing of the River of Demand for a Large Consumer Products Company
Insights from the river of
demand activity for this
large consumer goods
company included the vast
amount of unused data,
the disastrous impact of
tight integration of the
budget, the disconnected
management of contract
manufacturing, and the
lack of a sound signal of
demand for logistics and
procurement.
At the end of the class, the participants often cited the river of demand activity as a breakthrough
moment in thinking.
The second activity was to apply the concept of bi-directional orchestration, as shown in Figure 11, to a
business problem in their supply chain. The idea is to use market data—both channel and supply—to
make trade-offs across sell, deliver, make, and source at the speed of business. Bi-directional
orchestration starts with the design of the orchestration levers; augmenting the planning master data
layer with market signals aligns the optimization engines.
In the sessions, the technologists and consultants struggled with the concepts questioning why S&OP
was not sufficient. In contrast, business leaders grasped the concepts more quickly, exhibiting
excitement while pushing to test the ideas.
Figure 11. Bi-Directional Orchestration
The Value Proposition
The shifts to outside-in thinking are not an evolution in thinking. Instead, it is a step change. In the
workshops, the groups refined the concepts of nine new potential software models:
1. Planning Master Data: A data layer to define and align market signals to define planning
parameters to ensure that all optimization engines are aligned based on market shifts.
2. Unified Planning Data Model: A NoSQL layer to harmonize the differences between different
planning models.
3. Form and Function of Inventory: A solution to recommend the form of inventory to be held at
what level based on demand and supply variation.
4. S&OP Playbook Execution: Translation of S&OP plans into playbooks for rationalization
between the tactical and operational planning horizons.
5. Market-driven Demand Management: The broadcasting of demand flows by roles across the
supply chain with visibility of demand and market latency, bullwhip impact, and Forecast Value
Added (FVA) by role.
6. Demand Visibility: A collaborative what-if analysis layer to allow business leaders to analyze
demand flows based on shifts in product mix, demand shaping programs, and the changing
market response.
7. Procurement Buyer Workbench: The translation of demand flows, and bi-directional
orchestration for the procurement buy plan in the tactical planning horizon.
8. Revenue Management Effectiveness (Test & Learn): Demand Shifting Versus Shaping/ Balanced
Scorecard Impact. Continual analysis of baseline demand and making shifts in demand shaping
based on lifts in baseline demand.
9. Bi-directional Orchestration: Trade-offs across deliver, make, and source based on well-defined
orchestration levers in the tactical and operational planning horizon based on market shifts.
To understand the value proposition, the team tested two concepts: market-driven demand
management and bi-directional orchestration in a series of pilots with BSH, Western Digital, Corning,
and LKQ. Key insights included:
1. Reduce Demand, Process, and Market Latency: The order offset from consumption is two to
sixteen weeks based on product velocity and variation. The offset from market shifts to the
order is even longer, up to three-to-six months. Demand and market latency put the supply
chain on the back foot creating a reactive response that is too late to align the enterprise to
market variation.
Earlier signal synchronization of market consumption improves on-shelf availability and reduces
inventory costs.
2. Decrease Process Latency. Organizations need help to align. The need for more demand
visibility for baseline demand, along with clarity of market and demand latency, is an
opportunity. In today’s organization, the greater the market variation, the longer the time to
decide. The time from data to action is process latency.
3. Reduction in Demand Amplification and Improvement in Bias and Forecast Value Added. In
Figure 12, the impact of market signals in more advanced modeling reduced bias and latency
and amplified the bullwhip while improving accuracy.
Figure 12. Market-Driven Demand Management
Using the Approach
At the end of the two years of ideation and experimentation, o9 Solutions hosted a retreat (termed
Blaze) to share the results of two years of testing. In Figure 13, we share the visualization of the critical
discussions from the event.
Figure 13. Artistic Visualization of the Conversation at the Blaze Retreat on September 12th
-14th
, 2022
Insights the Blaze Event included insights on unlearning to rethink planning processes
and alignment on the value of outside-in thinking.
Conclusion
The building of outside-in processes offers great promise for the organization to sense and adapt. The
most significant barrier is unlearning conventional planning concepts to be open to the outcome. A
mistake often made is to use more advanced analytics in traditional advanced planning architectures,
which has minimal value.
The shift from inside-out to outside-in processes is not an evolution. Instead, it is a step change
requiring a redefinition of essential supply chain planning technologies and processes. The opportunity
is to democratize planning and redefine work. The lack of fit of today’s technologies resulted in the
creation of large teams of planners, both inefficient and often self-serving.
The movement from inside-out to outside-in processes improves FVA by 15-20%, decreases demand
latency by 60-80%, and the bullwhip effect by 15-30%. The impact is better to channel fulfillment with
lower costs and inventory to power growth. With heightened demand and supply variability, the work
by Project Zebra offers an excellent opportunity for supply chain teams to power change.
About the Author
Lora Cecere (Twitter ID @lcecere) is the Founder of Supply Chain Insights LLC
and the author of the popular enterprise software blog Supply Chain Shaman.
She also writes as a LinkedIn Influencer and as a contributor to Forbes. Using her
research, she penned twelve books to help business leaders.
With over eighteen years as a research analyst (AMR Research, Altimeter Group,
and Gartner Group) and now as the Founder of Supply Chain Insights, Lora is a
globally recognized supply chain expert and is a frequent speaker on the
evolution of supply chain processes and technologies.

More Related Content

What's hot

8 integrating the supply chain
8 integrating the supply chain8 integrating the supply chain
8 integrating the supply chain
bramali
 
Demand planning session
Demand planning sessionDemand planning session
Demand planning session
AlfaPeople US
 

What's hot (20)

Building Outside-in Supply Chain Processes
Building Outside-in Supply Chain ProcessesBuilding Outside-in Supply Chain Processes
Building Outside-in Supply Chain Processes
 
Playing to-win
Playing to-winPlaying to-win
Playing to-win
 
River of Demand - ALL RIVERS with QR.pdf
River of Demand - ALL RIVERS with QR.pdfRiver of Demand - ALL RIVERS with QR.pdf
River of Demand - ALL RIVERS with QR.pdf
 
10 Key Challenges to S&OP Excellence
10 Key Challenges to S&OP Excellence 10 Key Challenges to S&OP Excellence
10 Key Challenges to S&OP Excellence
 
Supply Chain Management lesson 2
Supply Chain Management lesson 2Supply Chain Management lesson 2
Supply Chain Management lesson 2
 
8 integrating the supply chain
8 integrating the supply chain8 integrating the supply chain
8 integrating the supply chain
 
Chemical Supply Chain
Chemical Supply ChainChemical Supply Chain
Chemical Supply Chain
 
Apics – trends shaping evolution of s&op; integrated business planning final
Apics – trends shaping evolution of s&op; integrated business planning finalApics – trends shaping evolution of s&op; integrated business planning final
Apics – trends shaping evolution of s&op; integrated business planning final
 
Building Responsive Supply Chains
Building Responsive Supply ChainsBuilding Responsive Supply Chains
Building Responsive Supply Chains
 
Data Visualization for Management Consultants & Analyst
Data Visualization for Management Consultants & AnalystData Visualization for Management Consultants & Analyst
Data Visualization for Management Consultants & Analyst
 
Strategic Sourcing and B2B E Commerce Solutions For ASEAN Purchasing Professi...
Strategic Sourcing and B2B E Commerce Solutions For ASEAN Purchasing Professi...Strategic Sourcing and B2B E Commerce Solutions For ASEAN Purchasing Professi...
Strategic Sourcing and B2B E Commerce Solutions For ASEAN Purchasing Professi...
 
Apache Hadoop Summit 2016: The Future of Apache Hadoop an Enterprise Architec...
Apache Hadoop Summit 2016: The Future of Apache Hadoop an Enterprise Architec...Apache Hadoop Summit 2016: The Future of Apache Hadoop an Enterprise Architec...
Apache Hadoop Summit 2016: The Future of Apache Hadoop an Enterprise Architec...
 
Oliver Wyman
Oliver Wyman   Oliver Wyman
Oliver Wyman
 
Operations and Supply Chain Toolkit - Framework, Best Practices and Templates
Operations and Supply Chain Toolkit - Framework, Best Practices and TemplatesOperations and Supply Chain Toolkit - Framework, Best Practices and Templates
Operations and Supply Chain Toolkit - Framework, Best Practices and Templates
 
Demand planning session
Demand planning sessionDemand planning session
Demand planning session
 
Three horizons
Three horizonsThree horizons
Three horizons
 
Best Practices in Demand Planning and Sales Forecasting
Best Practices in Demand Planning and Sales ForecastingBest Practices in Demand Planning and Sales Forecasting
Best Practices in Demand Planning and Sales Forecasting
 
150+ Strategy Frameworks & Templates by a McKinsey Alum
150+ Strategy Frameworks & Templates by a McKinsey Alum150+ Strategy Frameworks & Templates by a McKinsey Alum
150+ Strategy Frameworks & Templates by a McKinsey Alum
 
Implementation methods of continuous improvement
Implementation methods of continuous improvementImplementation methods of continuous improvement
Implementation methods of continuous improvement
 
Management Consulting Toolkit - Framework, Best Practices and Templates
Management Consulting Toolkit - Framework, Best Practices and TemplatesManagement Consulting Toolkit - Framework, Best Practices and Templates
Management Consulting Toolkit - Framework, Best Practices and Templates
 

Similar to Submission to Journal of Logistics

Maximizing the ROI in Supply Chain Planning - Insights from Quantitative Stud...
Maximizing the ROI in Supply Chain Planning - Insights from Quantitative Stud...Maximizing the ROI in Supply Chain Planning - Insights from Quantitative Stud...
Maximizing the ROI in Supply Chain Planning - Insights from Quantitative Stud...
Lora Cecere
 
Inventory Optimization in a Market-Driven World - 27 APR 2015
Inventory Optimization in a Market-Driven World - 27 APR 2015Inventory Optimization in a Market-Driven World - 27 APR 2015
Inventory Optimization in a Market-Driven World - 27 APR 2015
Lora Cecere
 
Putting Together the Pieces - The 2013 Guide to S&OP Technology Selection
Putting Together the Pieces - The 2013 Guide to S&OP Technology SelectionPutting Together the Pieces - The 2013 Guide to S&OP Technology Selection
Putting Together the Pieces - The 2013 Guide to S&OP Technology Selection
Lora Cecere
 
Research in Review - 2014
Research in Review - 2014Research in Review - 2014
Research in Review - 2014
Lora Cecere
 
Imagine the Supply Chain of the Future - 21 OCT 2014
Imagine the Supply Chain of the Future - 21 OCT 2014Imagine the Supply Chain of the Future - 21 OCT 2014
Imagine the Supply Chain of the Future - 21 OCT 2014
Lora Cecere
 
Putting Together the Pieces: Supply Chain Analytics - 2 SEP 2017
Putting Together the Pieces: Supply Chain Analytics - 2 SEP 2017Putting Together the Pieces: Supply Chain Analytics - 2 SEP 2017
Putting Together the Pieces: Supply Chain Analytics - 2 SEP 2017
Lora Cecere
 
Supply chain pdf related
Supply chain pdf relatedSupply chain pdf related
Supply chain pdf related
StudsPlanet.com
 
2014_11_Robles_Severson
2014_11_Robles_Severson2014_11_Robles_Severson
2014_11_Robles_Severson
Alfonso Robles
 

Similar to Submission to Journal of Logistics (20)

Maximizing the ROI in Supply Chain Planning - Insights from Quantitative Stud...
Maximizing the ROI in Supply Chain Planning - Insights from Quantitative Stud...Maximizing the ROI in Supply Chain Planning - Insights from Quantitative Stud...
Maximizing the ROI in Supply Chain Planning - Insights from Quantitative Stud...
 
Inventory Optimization in a Market-Driven World - 27 APR 2015
Inventory Optimization in a Market-Driven World - 27 APR 2015Inventory Optimization in a Market-Driven World - 27 APR 2015
Inventory Optimization in a Market-Driven World - 27 APR 2015
 
Guide to demand planning
Guide to demand planningGuide to demand planning
Guide to demand planning
 
Advanced demand supply integration
Advanced demand supply integrationAdvanced demand supply integration
Advanced demand supply integration
 
Building a Digital Supply Chain - report - 9 APR 2018
Building a Digital Supply Chain - report - 9 APR 2018Building a Digital Supply Chain - report - 9 APR 2018
Building a Digital Supply Chain - report - 9 APR 2018
 
What Drives Inventory Effectiveness in a Market-Driven World?
What Drives Inventory Effectiveness in a Market-Driven World?  What Drives Inventory Effectiveness in a Market-Driven World?
What Drives Inventory Effectiveness in a Market-Driven World?
 
Putting Together the Pieces - The 2013 Guide to S&OP Technology Selection
Putting Together the Pieces - The 2013 Guide to S&OP Technology SelectionPutting Together the Pieces - The 2013 Guide to S&OP Technology Selection
Putting Together the Pieces - The 2013 Guide to S&OP Technology Selection
 
The race for supply chain 2030
The race for supply chain 2030The race for supply chain 2030
The race for supply chain 2030
 
Why Is Supply Chain Planning So Hard? 16 FEB 2016
Why Is Supply Chain Planning So Hard?  16 FEB 2016Why Is Supply Chain Planning So Hard?  16 FEB 2016
Why Is Supply Chain Planning So Hard? 16 FEB 2016
 
Research in Review - 2014
Research in Review - 2014Research in Review - 2014
Research in Review - 2014
 
Imagine the Supply Chain of the Future - 21 OCT 2014
Imagine the Supply Chain of the Future - 21 OCT 2014Imagine the Supply Chain of the Future - 21 OCT 2014
Imagine the Supply Chain of the Future - 21 OCT 2014
 
C-2014-4-Meijer-EN
C-2014-4-Meijer-ENC-2014-4-Meijer-EN
C-2014-4-Meijer-EN
 
supply_chain_management.pdf
supply_chain_management.pdfsupply_chain_management.pdf
supply_chain_management.pdf
 
Driving Supply Chain Agility
Driving Supply Chain AgilityDriving Supply Chain Agility
Driving Supply Chain Agility
 
Driving Supply Chain Agility
Driving Supply Chain AgilityDriving Supply Chain Agility
Driving Supply Chain Agility
 
Putting Together the Pieces: Supply Chain Analytics - 2 SEP 2017
Putting Together the Pieces: Supply Chain Analytics - 2 SEP 2017Putting Together the Pieces: Supply Chain Analytics - 2 SEP 2017
Putting Together the Pieces: Supply Chain Analytics - 2 SEP 2017
 
What is supply chain management program
What is supply chain management programWhat is supply chain management program
What is supply chain management program
 
Supp management
Supp managementSupp management
Supp management
 
Supply chain pdf related
Supply chain pdf relatedSupply chain pdf related
Supply chain pdf related
 
2014_11_Robles_Severson
2014_11_Robles_Severson2014_11_Robles_Severson
2014_11_Robles_Severson
 

More from Lora Cecere

More from Lora Cecere (20)

2023 Reset Report v3.1.pdf
2023 Reset Report v3.1.pdf2023 Reset Report v3.1.pdf
2023 Reset Report v3.1.pdf
 
NOW 2022 Conference Lora Cecere
NOW 2022  Conference Lora CecereNOW 2022  Conference Lora Cecere
NOW 2022 Conference Lora Cecere
 
Digital Transformation Western Digital
Digital Transformation Western DigitalDigital Transformation Western Digital
Digital Transformation Western Digital
 
Imagine 2022 Rick McDonald Content rev5.pptx
Imagine 2022 Rick McDonald Content rev5.pptxImagine 2022 Rick McDonald Content rev5.pptx
Imagine 2022 Rick McDonald Content rev5.pptx
 
Sleep Number Supply Chain's To Admire.pptx
Sleep Number Supply Chain's To Admire.pptxSleep Number Supply Chain's To Admire.pptx
Sleep Number Supply Chain's To Admire.pptx
 
Future of Healthcare--2030
Future of Healthcare--2030Future of Healthcare--2030
Future of Healthcare--2030
 
AmeriCare Royal
AmeriCare RoyalAmeriCare Royal
AmeriCare Royal
 
Supply Chains to Admire Award Winner
Supply Chains to Admire Award Winner Supply Chains to Admire Award Winner
Supply Chains to Admire Award Winner
 
Navigating the Talent Crunch
Navigating the Talent CrunchNavigating the Talent Crunch
Navigating the Talent Crunch
 
Use of Social Tokens in Supply Chain
Use of Social Tokens in Supply ChainUse of Social Tokens in Supply Chain
Use of Social Tokens in Supply Chain
 
Lora Cecere Opening Presentation Imagine 2022.pptx
Lora Cecere Opening Presentation Imagine 2022.pptxLora Cecere Opening Presentation Imagine 2022.pptx
Lora Cecere Opening Presentation Imagine 2022.pptx
 
Rivers of Demand
Rivers of DemandRivers of Demand
Rivers of Demand
 
Building Outside-in Planning Processes
Building Outside-in Planning ProcessesBuilding Outside-in Planning Processes
Building Outside-in Planning Processes
 
Supply Chains to Admire Analysis 2022_2022 presentation.pptx
Supply Chains to Admire Analysis 2022_2022 presentation.pptxSupply Chains to Admire Analysis 2022_2022 presentation.pptx
Supply Chains to Admire Analysis 2022_2022 presentation.pptx
 
The Role of Analytics In Defining The Art Of The Possible
The Role of Analytics In Defining The Art Of The PossibleThe Role of Analytics In Defining The Art Of The Possible
The Role of Analytics In Defining The Art Of The Possible
 
Why is Sales and Operations Planning So Hard?
Why is Sales and Operations Planning So Hard?Why is Sales and Operations Planning So Hard?
Why is Sales and Operations Planning So Hard?
 
Wicked Hyper Presentation: Future of Container Ports
Wicked Hyper Presentation: Future of Container PortsWicked Hyper Presentation: Future of Container Ports
Wicked Hyper Presentation: Future of Container Ports
 
How To Give a Demand Planner Some Love
How To Give a Demand Planner Some LoveHow To Give a Demand Planner Some Love
How To Give a Demand Planner Some Love
 
Lessons on Supply Chain Leadership: Darrell Edwards La-Z-Boy
Lessons on Supply Chain Leadership: Darrell Edwards La-Z-BoyLessons on Supply Chain Leadership: Darrell Edwards La-Z-Boy
Lessons on Supply Chain Leadership: Darrell Edwards La-Z-Boy
 
Desiree Wood imagine event template real women in trucking
Desiree Wood imagine event template real women in truckingDesiree Wood imagine event template real women in trucking
Desiree Wood imagine event template real women in trucking
 

Recently uploaded

Insurers' journeys to build a mastery in the IoT usage
Insurers' journeys to build a mastery in the IoT usageInsurers' journeys to build a mastery in the IoT usage
Insurers' journeys to build a mastery in the IoT usage
Matteo Carbone
 
FULL ENJOY Call Girls In Mahipalpur Delhi Contact Us 8377877756
FULL ENJOY Call Girls In Mahipalpur Delhi Contact Us 8377877756FULL ENJOY Call Girls In Mahipalpur Delhi Contact Us 8377877756
FULL ENJOY Call Girls In Mahipalpur Delhi Contact Us 8377877756
dollysharma2066
 
Call Girls Hebbal Just Call 👗 7737669865 👗 Top Class Call Girl Service Bangalore
Call Girls Hebbal Just Call 👗 7737669865 👗 Top Class Call Girl Service BangaloreCall Girls Hebbal Just Call 👗 7737669865 👗 Top Class Call Girl Service Bangalore
Call Girls Hebbal Just Call 👗 7737669865 👗 Top Class Call Girl Service Bangalore
amitlee9823
 
Russian Call Girls In Gurgaon ❤️8448577510 ⊹Best Escorts Service In 24/7 Delh...
Russian Call Girls In Gurgaon ❤️8448577510 ⊹Best Escorts Service In 24/7 Delh...Russian Call Girls In Gurgaon ❤️8448577510 ⊹Best Escorts Service In 24/7 Delh...
Russian Call Girls In Gurgaon ❤️8448577510 ⊹Best Escorts Service In 24/7 Delh...
lizamodels9
 
Call Girls Electronic City Just Call 👗 7737669865 👗 Top Class Call Girl Servi...
Call Girls Electronic City Just Call 👗 7737669865 👗 Top Class Call Girl Servi...Call Girls Electronic City Just Call 👗 7737669865 👗 Top Class Call Girl Servi...
Call Girls Electronic City Just Call 👗 7737669865 👗 Top Class Call Girl Servi...
amitlee9823
 

Recently uploaded (20)

Famous Olympic Siblings from the 21st Century
Famous Olympic Siblings from the 21st CenturyFamous Olympic Siblings from the 21st Century
Famous Olympic Siblings from the 21st Century
 
HONOR Veterans Event Keynote by Michael Hawkins
HONOR Veterans Event Keynote by Michael HawkinsHONOR Veterans Event Keynote by Michael Hawkins
HONOR Veterans Event Keynote by Michael Hawkins
 
Organizational Transformation Lead with Culture
Organizational Transformation Lead with CultureOrganizational Transformation Lead with Culture
Organizational Transformation Lead with Culture
 
Call Girls in Gomti Nagar - 7388211116 - With room Service
Call Girls in Gomti Nagar - 7388211116  - With room ServiceCall Girls in Gomti Nagar - 7388211116  - With room Service
Call Girls in Gomti Nagar - 7388211116 - With room Service
 
Dr. Admir Softic_ presentation_Green Club_ENG.pdf
Dr. Admir Softic_ presentation_Green Club_ENG.pdfDr. Admir Softic_ presentation_Green Club_ENG.pdf
Dr. Admir Softic_ presentation_Green Club_ENG.pdf
 
Insurers' journeys to build a mastery in the IoT usage
Insurers' journeys to build a mastery in the IoT usageInsurers' journeys to build a mastery in the IoT usage
Insurers' journeys to build a mastery in the IoT usage
 
FULL ENJOY Call Girls In Mahipalpur Delhi Contact Us 8377877756
FULL ENJOY Call Girls In Mahipalpur Delhi Contact Us 8377877756FULL ENJOY Call Girls In Mahipalpur Delhi Contact Us 8377877756
FULL ENJOY Call Girls In Mahipalpur Delhi Contact Us 8377877756
 
Call Girls Hebbal Just Call 👗 7737669865 👗 Top Class Call Girl Service Bangalore
Call Girls Hebbal Just Call 👗 7737669865 👗 Top Class Call Girl Service BangaloreCall Girls Hebbal Just Call 👗 7737669865 👗 Top Class Call Girl Service Bangalore
Call Girls Hebbal Just Call 👗 7737669865 👗 Top Class Call Girl Service Bangalore
 
MONA 98765-12871 CALL GIRLS IN LUDHIANA LUDHIANA CALL GIRL
MONA 98765-12871 CALL GIRLS IN LUDHIANA LUDHIANA CALL GIRLMONA 98765-12871 CALL GIRLS IN LUDHIANA LUDHIANA CALL GIRL
MONA 98765-12871 CALL GIRLS IN LUDHIANA LUDHIANA CALL GIRL
 
The Coffee Bean & Tea Leaf(CBTL), Business strategy case study
The Coffee Bean & Tea Leaf(CBTL), Business strategy case studyThe Coffee Bean & Tea Leaf(CBTL), Business strategy case study
The Coffee Bean & Tea Leaf(CBTL), Business strategy case study
 
The Path to Product Excellence: Avoiding Common Pitfalls and Enhancing Commun...
The Path to Product Excellence: Avoiding Common Pitfalls and Enhancing Commun...The Path to Product Excellence: Avoiding Common Pitfalls and Enhancing Commun...
The Path to Product Excellence: Avoiding Common Pitfalls and Enhancing Commun...
 
How to Get Started in Social Media for Art League City
How to Get Started in Social Media for Art League CityHow to Get Started in Social Media for Art League City
How to Get Started in Social Media for Art League City
 
M.C Lodges -- Guest House in Jhang.
M.C Lodges --  Guest House in Jhang.M.C Lodges --  Guest House in Jhang.
M.C Lodges -- Guest House in Jhang.
 
Yaroslav Rozhankivskyy: Три складові і три передумови максимальної продуктивн...
Yaroslav Rozhankivskyy: Три складові і три передумови максимальної продуктивн...Yaroslav Rozhankivskyy: Три складові і три передумови максимальної продуктивн...
Yaroslav Rozhankivskyy: Три складові і три передумови максимальної продуктивн...
 
Value Proposition canvas- Customer needs and pains
Value Proposition canvas- Customer needs and painsValue Proposition canvas- Customer needs and pains
Value Proposition canvas- Customer needs and pains
 
Russian Call Girls In Gurgaon ❤️8448577510 ⊹Best Escorts Service In 24/7 Delh...
Russian Call Girls In Gurgaon ❤️8448577510 ⊹Best Escorts Service In 24/7 Delh...Russian Call Girls In Gurgaon ❤️8448577510 ⊹Best Escorts Service In 24/7 Delh...
Russian Call Girls In Gurgaon ❤️8448577510 ⊹Best Escorts Service In 24/7 Delh...
 
RSA Conference Exhibitor List 2024 - Exhibitors Data
RSA Conference Exhibitor List 2024 - Exhibitors DataRSA Conference Exhibitor List 2024 - Exhibitors Data
RSA Conference Exhibitor List 2024 - Exhibitors Data
 
Call Girls Electronic City Just Call 👗 7737669865 👗 Top Class Call Girl Servi...
Call Girls Electronic City Just Call 👗 7737669865 👗 Top Class Call Girl Servi...Call Girls Electronic City Just Call 👗 7737669865 👗 Top Class Call Girl Servi...
Call Girls Electronic City Just Call 👗 7737669865 👗 Top Class Call Girl Servi...
 
KYC-Verified Accounts: Helping Companies Handle Challenging Regulatory Enviro...
KYC-Verified Accounts: Helping Companies Handle Challenging Regulatory Enviro...KYC-Verified Accounts: Helping Companies Handle Challenging Regulatory Enviro...
KYC-Verified Accounts: Helping Companies Handle Challenging Regulatory Enviro...
 
Ensure the security of your HCL environment by applying the Zero Trust princi...
Ensure the security of your HCL environment by applying the Zero Trust princi...Ensure the security of your HCL environment by applying the Zero Trust princi...
Ensure the security of your HCL environment by applying the Zero Trust princi...
 

Submission to Journal of Logistics

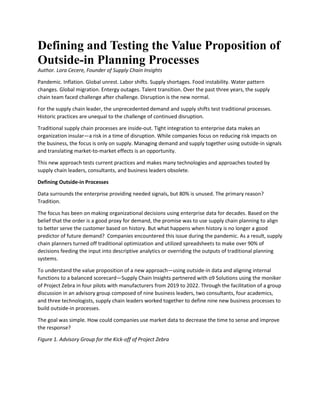
  • 1. Defining and Testing the Value Proposition of Outside-in Planning Processes Author. Lora Cecere, Founder of Supply Chain Insights Pandemic. Inflation. Global unrest. Labor shifts. Supply shortages. Food instability. Water pattern changes. Global migration. Entergy outages. Talent transition. Over the past three years, the supply chain team faced challenge after challenge. Disruption is the new normal. For the supply chain leader, the unprecedented demand and supply shifts test traditional processes. Historic practices are unequal to the challenge of continued disruption. Traditional supply chain processes are inside-out. Tight integration to enterprise data makes an organization insular—a risk in a time of disruption. While companies focus on reducing risk impacts on the business, the focus is only on supply. Managing demand and supply together using outside-in signals and translating market-to-market effects is an opportunity. This new approach tests current practices and makes many technologies and approaches touted by supply chain leaders, consultants, and business leaders obsolete. Defining Outside-in Processes Data surrounds the enterprise providing needed signals, but 80% is unused. The primary reason? Tradition. The focus has been on making organizational decisions using enterprise data for decades. Based on the belief that the order is a good proxy for demand, the promise was to use supply chain planning to align to better serve the customer based on history. But what happens when history is no longer a good predictor of future demand? Companies encountered this issue during the pandemic. As a result, supply chain planners turned off traditional optimization and utilized spreadsheets to make over 90% of decisions feeding the input into descriptive analytics or overriding the outputs of traditional planning systems. To understand the value proposition of a new approach—using outside-in data and aligning internal functions to a balanced scorecard—Supply Chain Insights partnered with o9 Solutions using the moniker of Project Zebra in four pilots with manufacturers from 2019 to 2022. Through the facilitation of a group discussion in an advisory group composed of nine business leaders, two consultants, four academics, and three technologists, supply chain leaders worked together to define nine new business processes to build outside-in processes. The goal was simple. How could companies use market data to decrease the time to sense and improve the response? Figure 1. Advisory Group for the Kick-off of Project Zebra
  • 2. Advisory Board Members First Year of Project Zebra: Phillipe Lambotte, Tonal; Rebecca Vohl, BSH; Dave Winstone, Dow Chemical; Daniel Corsten, IE Business School; Douglas Kent, ASCM; Bob Masching, Trident Seafood; Peter Schram, Independent Consultant; Chris Tyas, Retired Nestle; Jason Robke, Boeing; Stephanie Thomas, University of Arkansas; Steven Daugherty, Samsung; Lora Cecere, Supply Chain Insights; Fred Baumann, o9 Solutions; Lukasz Zieba, o9 Solutions; Tanguy Caillet, o9 Solutions; Olivier Redon, Schneider Electric; Yossi Sheffi, MIT; and Arnd Huchzermeier, WHU. In Figure 2, we depict a pictorial of the group’s work using SCOR methodology at the end of the two-year journey. Figure 2. Overview of an Outside-in Approach Using the SCOR Methodology
  • 3. Starting with Defining the Problems with the Current State The genesis of the Project Zebra work starts with the question, “Can supply chain leaders change their processes and adapt like Zebras changing their stripes in the wild?” Each zebra has unique markings designed to provide camouflage for survival. Initially, the belief was that the Zebra’s patterns were inherited and did not change, but scientists learned that Zebras change their stripes to adapt over time. In contrast, supply chain leaders struggle to adapt their processes and evolve as market conditions change. The term supply chain, as defined in 1982 by Keith Oliver, a British Logistician, is the process of planning, implementing, and controlling the operations of the supply chain with the purpose of satisfying customer requirements as efficiently as possible1 . Today, across organizations, there are many definitions for the supply chain. In Figure 3, we share the response from a recent survey on the reporting relationships within the supply chain organization. Figure 3. Reporting Relationships Within the Supply Chain Organization While organizations bandy-about terms like End-to-End Supply Chain Management, the data models for planning are functional. The transportation, manufacturing, and order management technologies have little in common. End-to-end planning systems are not today’s reality. Instead, today’s systems focus on improving functional optima based on enterprise data. While technologists clearly defined the transactional processes of order-to-cash and procure-to-pay, the decision support processes of market signal-to-buy plan in procurement or plan to commit in customer service needs more clarity, with each organization implementing differently. In addition, with today’s technologies, there is no way to connect optimization outputs to rules and policies effectively. Each system and functional group varies by goal, 1 Keith Oliver - Wikipedia, November 23, 2022
  • 4. sub-optimizing balance sheet results, and throwing the supply chain out of balance. As shown in Figure 4, organizations lack alignment. Most struggle to define supply chain excellence. Figure 4. Supply Chain Alignment Pre-Pandemic In Advanced Planning Systems, optimization engines mine the order patterns with the consumption of this historical representation of demand as an input into the processes of deliver, make and source without bi-directional trade-offs or connection to rules and policies. Traditional optimization approaches focus on improving local optima focused primarily on cost reduction or trade-offs between cost and service without linking to the balance sheet. In this process, inventory is the most critical buffer to absorb demand and supply volatility. The design of these buffers is essential, and a focus only on finished goods safety stock management is insufficient. Ironically, inventory is also the most significant source of waste, or MUDA, in the supply chain creating organizational tension. (The Japanese “Muda” word (無駄) translates as uselessness or futility. In Lean management, Muda represents the changes or actions that do not cause a value-increasing effect on the product or drive improvement that a customer will be happy to pay for.)
  • 5. Table 1. Definition of Form and Function of Inventory While the traditional solutions focused on safety stock, few existing approaches helped business leaders understand the form and function of inventory as defined in Table 1. This gap increased in importance with the impact of the pandemic. (Based on demand and supply variation, the form and function of inventory assess where and how to store inventory and design buffers. For example, as variability increases, companies need to shift from holding finished goods to storing raw materials and semi- finished goods.) In Project Zebra, the measured Coefficient of Variation (COV) differences of the demand signal at each node. By measuring both, the shifts in COV and latency by node and role, the importance of using outside-in signals becomes more apparent, especially in translating a demand signal for manufacturing or procurement processes. Figure 5. Increase in Inventory Across Industry Segments Over Periods from 2004-2021
  • 6. As shown in Figure 5, companies hold 27 more days of inventory in 2022 than at the beginning of the recession in 2007. The reason? There are three. The impact of longer in-transit and manufacturing cycle times increased inventories. (Long global supply chain shipping times increased cycle times while product proliferation on the long tail of products due to item proliferation increased manufacturing cycle stock.) Over the last decade, as supply and demand variability increased, traditional approaches focusing only on safety stock management based on demand variability were insufficient. The Process In the market today, technologists compete with each other, and business leaders adopt existing definitions. As new forms of analytics evolve, the definition of supply chain planning remains rooted in history, despite the explosion of market data, the promise of NoSQL with ontological learning, and graph databases. Figure 6. Capturing the Essence of the Advisory Group Kick-off Using a Visual Facilitator The advisory board exploration to define outside- in processes kicked off in January 2020. The group started by closely examining current processes and asking the questions:  What are the gaps in today’s approaches?  How can the process be improved through the use of market data?  What market data is available? How can it be used?  How do we define the value of process improvement?  With the advancement of analytics, how can different forms of data be used to improve decision support? To help crystallize the learning, a visual artist captured the essence of each advisory group session. The discussion captured in Figure 6 was the start of the effort. In the session, the group agreed to hold themselves to humility, openness, active listening, and openness to the outcome. The largest barrier was unlearning the basics of current processes.
  • 7. Through a series of experiential activities, the group defined the future state of demand as a river with multiple flows based on demand and supply variability and the identification of supply chain constraints. In exploring the topic of constraints, it is clear that the current focus is only on modeling manufacturing constraints and balancing planned orders. Instead, the group needed to model the logistics and procurement constraints. A constraint restrictions system output. The constraint acts as a throttle, establishing an upper limit of the output. The constraint is circumvented by designing a process or system to work around it or by outsourcing work to another entity that is not subject to the same constraint. Today’s approach to planning has many limitations. The first is the visibility of constraints by the executive team. Constraints shift as the mix of products changes or the market shifts for demand preferences. As a result, most plans are out of touch with both the process capabilities and market potential. A second limitation is the number of optimization engines that need to be aligned. Most organizations have nine planning engines not connected through a unified data model. For example, the output of trade promotion optimization in consumer products and demand planning needs to have alignment and connection. Promotion planning occurs in a silo without agreement on market potential. As a result, companies primarily shift demand from period to period without shaping demand (increasing demand lift). Worse still, most large manufacturers don’t use the optimization capabilities focused on checkbook functionality to control expenditures based on historical spending. The third issue is the lack of visibility of market potential or baseline demand. Without this visibility, sales, marketing, and supply chain teams operate in isolation with different and often conflicting process gyrations. The demand processes are not synchronized and lack a common view of market potential. The market potential is the demand for products or services without demand shaping. Demand-shaping activities by sales and marketing include shifts in price, promotion, placement, advertisement, or excitement through new product launches. Demand shifting moves an order from period to period without increasing market potential and driving growth. Demand shifting increases cost and the bullwhip effect. In the current state, teams work in silos. The work is separated by function, with a heavy dependence on spreadsheets. The use of spreadsheets stems from the need for more flexibility in current systems to model and test plan feasibility. During the pandemic, spreadsheets were the primary tool for modeling driving more than 90% of the decisions. In the future, with the implementation of outside-in processes, there will be clear visibility of constraints, demand latency, market potential, and supply chain capabilities. The organization is aligned. Based on flows, not time-phased data, the plans allow the modeling as markets change. Demand data is
  • 8. translated into role-based views for aligned consumption by delivery, manufacturing, and procurement teams. The redefinition enables an adaptive response. A working analogy is a plan much like weather forecasting: multiple scenarios are visible and consumed by groups as conditions shift. Figure 7. Development of Future Planning Models from Time-phased Views to Flow The future state hinges on mining multiple data inputs simultaneously using a learning engine informed by a planning master data layer. The master data layer ensures that the planning factors like lead times, conversion rates, and currency valuations are updated based on market shifts. Figure 8. Redefinition of Planning Engines At the end of the two years of working together through a series of workshops, the group reflected on the experience. In Figure 9, we share the learnings. The biggest challenge of this group of experienced supply chain professionals was unlearning: it is tough to rethink the definition of planning. Surprisingly,
  • 9. the unlearning was more challenging for consultants and technologists in the workshops than for the business leaders. Figure 9. Advisory Group Key Insights at the End of Two Years of Workshops A critical insight at the end of two years of work: the most significant challenge is unlearning traditional supply chain processes. Unlearning is demanding, requiring education and rethinking current definitions. Methodology After facilitating workshops with the advisory group, the team compiled the learning into a virtual three- day seminar. The class, advertised on Linkedin, filled up to capacity in twenty-four hours. During January-March 2022, forty-eight supply chain leaders from thirty-two companies attended the training classes. To improve their learning, the attendees were assigned a homework activity at the end of each day. The two actions were: to draw and share their river of demand and define an opportunity for bi- directional orchestration. The river of demand activity designed to help business leaders rethink demand as a flow outside-in and break the paradigm of inside-out planning based on transactional data with a time-phased output was the first activity. To help companies understand supply chain principles and similarities, an artist redrew and anonymized these drawings while matching the artistic rendering to the planner’s voice using QR codes. Common issues were the tight coupling of Sales and Operations (S&OP) planning to the budget process and the constriction as the markets fluctuated. The inability to manage inventory appropriately with market shifts and the need for organizational alignment. To drive a feasible plan, the constraints need to be modeled to drive plan feasibility. The constraints include labor availability in distribution, sourcing supply shortages, manufacturing capacity, transportation availability, and warehouse storage capacity. Today, the only constraint considered in Advanced Planning Systems (APS) is manufacturing line capacity. As a result, only 28% of companies feel their output from their planning solution is feasible.
  • 10. Figure 10. Drawing of the River of Demand for a Large Consumer Products Company Insights from the river of demand activity for this large consumer goods company included the vast amount of unused data, the disastrous impact of tight integration of the budget, the disconnected management of contract manufacturing, and the lack of a sound signal of demand for logistics and procurement. At the end of the class, the participants often cited the river of demand activity as a breakthrough moment in thinking. The second activity was to apply the concept of bi-directional orchestration, as shown in Figure 11, to a business problem in their supply chain. The idea is to use market data—both channel and supply—to make trade-offs across sell, deliver, make, and source at the speed of business. Bi-directional orchestration starts with the design of the orchestration levers; augmenting the planning master data layer with market signals aligns the optimization engines. In the sessions, the technologists and consultants struggled with the concepts questioning why S&OP was not sufficient. In contrast, business leaders grasped the concepts more quickly, exhibiting excitement while pushing to test the ideas.
  • 11. Figure 11. Bi-Directional Orchestration The Value Proposition The shifts to outside-in thinking are not an evolution in thinking. Instead, it is a step change. In the workshops, the groups refined the concepts of nine new potential software models: 1. Planning Master Data: A data layer to define and align market signals to define planning parameters to ensure that all optimization engines are aligned based on market shifts. 2. Unified Planning Data Model: A NoSQL layer to harmonize the differences between different planning models. 3. Form and Function of Inventory: A solution to recommend the form of inventory to be held at what level based on demand and supply variation. 4. S&OP Playbook Execution: Translation of S&OP plans into playbooks for rationalization between the tactical and operational planning horizons. 5. Market-driven Demand Management: The broadcasting of demand flows by roles across the supply chain with visibility of demand and market latency, bullwhip impact, and Forecast Value Added (FVA) by role. 6. Demand Visibility: A collaborative what-if analysis layer to allow business leaders to analyze demand flows based on shifts in product mix, demand shaping programs, and the changing market response. 7. Procurement Buyer Workbench: The translation of demand flows, and bi-directional orchestration for the procurement buy plan in the tactical planning horizon. 8. Revenue Management Effectiveness (Test & Learn): Demand Shifting Versus Shaping/ Balanced Scorecard Impact. Continual analysis of baseline demand and making shifts in demand shaping based on lifts in baseline demand. 9. Bi-directional Orchestration: Trade-offs across deliver, make, and source based on well-defined orchestration levers in the tactical and operational planning horizon based on market shifts.
  • 12. To understand the value proposition, the team tested two concepts: market-driven demand management and bi-directional orchestration in a series of pilots with BSH, Western Digital, Corning, and LKQ. Key insights included: 1. Reduce Demand, Process, and Market Latency: The order offset from consumption is two to sixteen weeks based on product velocity and variation. The offset from market shifts to the order is even longer, up to three-to-six months. Demand and market latency put the supply chain on the back foot creating a reactive response that is too late to align the enterprise to market variation. Earlier signal synchronization of market consumption improves on-shelf availability and reduces inventory costs. 2. Decrease Process Latency. Organizations need help to align. The need for more demand visibility for baseline demand, along with clarity of market and demand latency, is an opportunity. In today’s organization, the greater the market variation, the longer the time to decide. The time from data to action is process latency. 3. Reduction in Demand Amplification and Improvement in Bias and Forecast Value Added. In Figure 12, the impact of market signals in more advanced modeling reduced bias and latency and amplified the bullwhip while improving accuracy. Figure 12. Market-Driven Demand Management
  • 13. Using the Approach At the end of the two years of ideation and experimentation, o9 Solutions hosted a retreat (termed Blaze) to share the results of two years of testing. In Figure 13, we share the visualization of the critical discussions from the event. Figure 13. Artistic Visualization of the Conversation at the Blaze Retreat on September 12th -14th , 2022
  • 14. Insights the Blaze Event included insights on unlearning to rethink planning processes and alignment on the value of outside-in thinking. Conclusion The building of outside-in processes offers great promise for the organization to sense and adapt. The most significant barrier is unlearning conventional planning concepts to be open to the outcome. A mistake often made is to use more advanced analytics in traditional advanced planning architectures, which has minimal value. The shift from inside-out to outside-in processes is not an evolution. Instead, it is a step change requiring a redefinition of essential supply chain planning technologies and processes. The opportunity is to democratize planning and redefine work. The lack of fit of today’s technologies resulted in the creation of large teams of planners, both inefficient and often self-serving. The movement from inside-out to outside-in processes improves FVA by 15-20%, decreases demand latency by 60-80%, and the bullwhip effect by 15-30%. The impact is better to channel fulfillment with lower costs and inventory to power growth. With heightened demand and supply variability, the work by Project Zebra offers an excellent opportunity for supply chain teams to power change.
  • 15. About the Author Lora Cecere (Twitter ID @lcecere) is the Founder of Supply Chain Insights LLC and the author of the popular enterprise software blog Supply Chain Shaman. She also writes as a LinkedIn Influencer and as a contributor to Forbes. Using her research, she penned twelve books to help business leaders. With over eighteen years as a research analyst (AMR Research, Altimeter Group, and Gartner Group) and now as the Founder of Supply Chain Insights, Lora is a globally recognized supply chain expert and is a frequent speaker on the evolution of supply chain processes and technologies.