
Recommended
More Related Content
What's hot
What's hot (15)
Viewers also liked
Viewers also liked (20)
Similar to Europe Debt Profile
Similar to Europe Debt Profile (20)
Europe Debt Profile
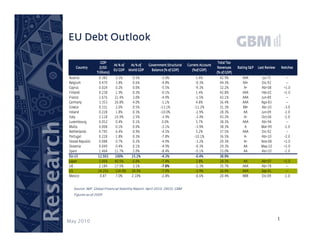
- 1. EU Debt Outlook GDP Total Tax As % of As % of Government Structural Current Account Country (USD Revenues Rating S&P Last Review Notches EU GDP World GDP Balance (% of GDP) (%of GDP) Trillions) (% of GDP) Austria 0.382 3.1% 0.5% -3.0% 1.4% 42.9% AAA Jul-75 -- Belgium 0.470 3.8% 0.6% -4.8% -0.3% 44.3% AA+ Dic-92 -- Cyprus 0.024 0.2% 0.0% -5.5% -9.3% 32.2% A+ Abr-08 +1.0 Finland 0.238 1.9% 0.3% -0.1% 1.4% 42.8% AAA Feb-02 +1.0 France 2.676 21.4% 3.0% -4.9% -1.5% 43.1% AAA Jun-89 -- Germany 3.353 26.8% 4.0% -1.1% 4.8% 36.4% AAA Ago-83 -- Greece 0.331 2.6% 0.5% -13.1% -11.2% 31.3% BB+ Abr-10 -3.0 Ireland 0.228 1.8% 0.3% -10.0% -2.9% 28.3% AA Jun-09 -1.0 Italy 2.118 16.9% 2.5% -3.9% -3.4% 43.2% A+ Oct-06 -1.0 Luxembourg 0.052 0.4% 0.1% 0.0% 5.7% 38.3% AAA Abr-94 -- Research Malta 0.008 0.1% 0.0% -3.1% -3.9% 38.3% A Mar-99 -1.0 Netherlands 0.795 6.4% 0.9% -4.5% 5.2% 37.5% AAA Dic-92 -- Portugal 0.228 1.8% 0.3% -7.8% -10.1% 36.5% A- Abr-10 -2.0 Slovak Republic 0.088 0.7% 0.2% -4.9% -3.2% 29.3% A+ Nov-08 +1.0 Slovenia 0.049 0.4% 0.1% -4.9% -0.3% 29.3% AA May-10 +1.0 Spain 1.464 11.7% 2.0% -8.4% -5.1% 33.0% AA Abr-10 -1.0 EU-15 12.503 100% 15.2% -4.3% -0.4% 38.9% Japan 5.068 40.5% 6.0% -7.4% 2.8% 28.3% AA Abr-07 +1.0 UK 2.184 17.5% 3.1% -7.8% -1.3% 35.7% AAA Abr-78 -- US 14.256 114.0% 20.5% -7.9% -2.9% 26.9% AAA Sep-91 -- Mexico 0.87 7.0% 2.10% -2.8% -0.6% 20.4% BBB Dic-09 -1.0 Source: IMF, Global Financial Stability Report, April 2010, OECD, GBM Figures as of 2009 May 2010 1
- 2. EU Debt Outlook Faces Structural Threats: High Unemployment Total Tax Tax on As % of Total Tax on Income Country Revenue (% Consumption A+B Tax Unemployment (B) of GDP) (A) Revenues Austria 42.9% 11.9% 12.0% 23.9% 55.7% 5.0% Belgium 44.3% 11.4% 17.1% 28.4% 64.2% 8.0% Cyprus 32.2% 8.4% 16.6% 25.0% 77.8% 6.3% Finland 42.8% 13.7% 17.9% 31.6% 73.8% 9.0% France 43.1% 13.7% 17.9% 31.6% 73.3% 10.1% Germany 36.4% 10.2% 10.7% 20.9% 57.4% 7.5% Greece 31.3% 11.4% 8.2% 19.6% 62.6% 10.2% Ireland 28.3% 11.8% 12.6% 24.3% 86.1% 13.2% Italy 43.2% 11.1% 13.6% 24.7% 57.3% 8.5% Luxembourg 38.3% 10.5% 13.2% 23.7% 62.0% 5.5% Malta 38.3% 10.5% 13.2% 23.7% 62.0% 7.1% Netherlands 37.5% 12.0% 10.5% 22.5% 59.8% 4.0% Portugal 36.5% 13.7% 7.7% 21.4% 58.7% 10.3% Slovak Republic 29.3% 12.1% 6.1% 18.3% 62.3% 14.2% Slovenia 29.3% 12.1% 6.1% 18.3% 62.3% 6.1% Spain 33.0% 12.1% 6.1% 18.3% 55.3% 19.0% EU-15 38.9% 11.1% 14.0% 25.1% 64.5% 10.0% Research Japan 28.3% 5.2% 9.5% 14.8% 52.1% 4.9% UK 35.7% 11.3% 5.9% 17.3% 48.3% 8.0% US 26.9% 11.0% 13.8% 24.8% 92.2% 9.9% Mexico 20.4% 10.9% 5.0% 15.9% 77.9% 4.8% Source: OECD, EUROSTAT, GBM Source: EUROSTAT May 2010 2
- 3. Potential spillover effects from EU debt crisis Sensitivity to EU corporate CDS Research Sensitivity to Sovereign CDS Source: IMF, Global Financial Stability Report,changes between October 2009 and February 2010 Regression betas from daily spread abril 2010 Source: IMF, Global Financial Stability Report, April 2010 May 2010 3