SlideShare une entreprise Scribd logo
1  sur  5
Statement Of Cash Flows                                                      The Grape Leaf


BEGINNING CASH BALANCE                 200,000

                                       April        May           June        July       Aug       Sept       Oct       Nov       Dec       Jan       Feb
Inflows from Operations
Sales                                   14,800       14,800         14,800 14,800 14,800           15,096     15,096 15,851 17,119 14,800             14,800
  Total Cash Inflows from Current Sales      0            0              0      0      0                0          0      0      0      0                  0
  Plus: Collections on Prior Sales                   14,800         14,800 14,800 14,800           14,800     15,096 15,096 15,851 17,119             14,800
Total Cash Inflows from Net Sales            0       29,600         29,600 29,600 29,600           29,896     30,192 30,947 32,970 31,919             29,600

Inflows from Financing                 200,000


Total Cash Inflows from Financing      200,000               0           0           0         0          0         0         0         0         0         0

TOTAL CASH INFLOWS                     200,000       14,800         14,800 14,800 14,800           14,800     15,096 15,096 15,851 17,119             14,800

                                      April         May           June        July       Aug       Sept       Oct       Nov       Dec       Jan       Feb
Outflows from Operations
 Wages                                    6,000       6,000          6,000 6,000 6,000              6,000      7,000 8,000 18,000 6,180                6,180
 Payroll Taxes                              960         960            960    960    960              960      1,120 1,280 2,880      989                989
Cost of Sales                             3,700       3,700          3,700 3,700 3,700              3,774      3,774 3,963 4,280 3,700                 3,700
 Supplies                                   148         148            148    148    148              151        151    159    171    148                148
 Insurance                                  300         300            300    300    300              300        300    300    300    300                300
 Rent                                     2,800       2,800          2,800 2,800 2,800              2,800      2,800 2,800 2,800 2,800                 2,800
 Advertising & Promotion                  1,400       1,400          1,400 1,400 1,400              1,400      1,540 1,540 1,540 1,400                 1,400
 Telephone & Utilities                      650         650            650    650    650              650        650    650    650    650                650
 Professional Fees                          600         600            600    600    600              600        600    600    600    600                600
 Miscellaneous                              300         300            300    300    300              300        300    500    500    300                300
Total Outflows from Operations           16,858      16,858         16,858 16,858 16,858           16,935     18,235 19,791 31,721 17,067             17,067

Outflows from Financing
 Loan Payments                            1,499       1,499          1,499     1,499     1,499      1,499     1,499     1,499     1,499     1,499      1,499
Total Outflows from Financing             1,499       1,499          1,499     1,499     1,499      1,499     1,499     1,499     1,499     1,499      1,499

Outflows from Non-Recurring Expenses                                         (One time expense)
 Fixtures & Equipment                25,000                  0           0         0      0               0         0         0         0         0         0
 Leasehold Improvements               5,700                  0           0         0      0               0         0         0         0         0         0
 Utility & Lease Deposits             3,750                  0           0         0      0               0         0         0         0         0         0
Base Inventory                       20,000                  0           0         0      0               0         0         0         0         0         0
Licensing                              2000                  0           0         0      0               0         0         0         0         0         0
Total Non-Recurring Expenses         56,450                  0           0         0      0               0         0         0         0         0         0

TOTAL OUTFLOWS                           74,807      18,357         18,357 18,357 18,357           18,434     19,734 21,290 33,220 18,566             18,566

                                      April         May           June        July August eptember ctober ovember
                                                                                          S       O     N      December JanuaryFebruary
TOTAL INFLOWS                          200,000       14,800         14,800    14,800 14,800 14,800 15,096 15,096 15,851 17,119 14,800
TOTAL OUTFLOWS                          74,807       18,357         18,357    18,357 18,357 18,434 19,734 21,290 33,220 18,566 18,566
NET CASH FLOWS                         125,193       -3,557         -3,557    -3,557 -3,557 -3,634 -4,638 -6,194 -17,369 -1,447 -3,766


Projection of Income and Expenses   1st Year      2nd Year       3rd Year
Esimated Revenue                    $181,562      $372,201       $744,403
Minus Cost of Goods Sold             $45,390       $93,050       $186,101
Estimated Gross Profit              $136,171      $279,151       $558,302
Estimated Operating Expenses        $200,670      $193,056       $117,395
Estimated Profit or Loss            ($64,499)      $86,095       $440,907

        Appendix B: Year One: Projection of Income and Expense

Estimated Sales or Revenue            $181,562
Minus: Cost of Goods Sold              $45,390
Estimated Gross Profit                $136,171

Estimated Operating Expenses
 Wages                                 $87,540
 Payroll Taxes                          14,006
 Supplies                                1,816
Insurance                            3,600
  Rent                                33,600
  Advertising & Promotion             17,220
  Telephone & Utilities                7,800
  Professional Fees                    8,100
  Miscellaneous                        4,000
Interest                             $17,988
Depreciation                          $5,000
  Total Estimated Operating Expenses$200,670

 Estimated Net Profit or Loss         ($64,499)


        Appendix C: Year Two: Projection of Income and Expense
Estimated Sales or Revenue             $372,201
Minus: Cost of Goods Sold               $93,050
Estimated Gross Profit                 $279,151

Estimated Operating Expenses
  Wages                              $84,160
  Payroll Taxes                       13,466
  Supplies                             1,816
  Insurance                            3,780
  Rent                                33,600
  Advertising & Promotion             17,220
  Telephone & Utilities                7,800
  Professional Fees                    8,343
  Miscellaneous                        4,000
Interest                             $13,872
Depreciation                          $5,000
  Total Estimated Operating Expenses$193,056

 Estimated Net Profit or Loss          $86,095


        Appendix D: Year Three Projection: Income and Expense
Estimated Sales or Revenue             $744,403
Minus: Cost of Goods Sold              $186,101
Estimated Gross Profit                 $558,302

Estimated Operating Expenses
  Wages                              $16,365
  Payroll Taxes                        2,618
  Supplies                             1,816
  Insurance                            3,969
  Rent                                35,280
  Advertising & Promotion             18,081
  Telephone & Utilities                7,800
  Professional Fees                    8,593
  Miscellaneous                        4,000
Interest                             $13,872
Depreciation                          $5,000
  Total Estimated Operating Expenses$117,395

 Estimated Net Profit or Loss         $440,907


Break Even Analysis                    Year       Month

Fixed Costs                          $200,670      $15,074

Average Sale Price                         $10         $10
Total Variable Cost                         $2          $2
Total Contribution Margin                   $8          $8

Break Even Point                       25,401        1,908
March TOTAL

14,800    181,562
     0          0
14,800    166,762
29,600    333,523


     0    200,000

14,800    366,762

March TOTAL

 6,180     87,540
   989     14,006
 3,700     45,390
   148      1,816
   300      3,600
 2,800     33,600
 1,400     17,220
   650      7,800
 1,500      8,100
   300      4,000
17,967    223,072


  1,499    17,988
  1,499    17,988


     0     25,000
     0      5,700
     0      3,750
     0     20,000
     0      2,000
     0     56,450

19,466    297,510

March
14,800    366,762
19,466    297,510
 -4,666    69,251
Appendix I & J Current Assets and Liabilities

Current Assets                                            Current Liabilities
Cash                                                ###    Current Portion Long Term Debt
                                                                                       17,988
Inventory                                           ###    Wages                      49,500
                                                           Payroll Taxes               7,920
Total Current Assets                                ###    Rent                        33,600
                                                          Total Current Liabilities


Fixed Assets                                              Long Term Debt                 ###
 Fixtures & Equipment                            15,850
 Leasehold Improvements                           3,750
 Utility & Lease Deposits                         3,750
Base Inventory                                   10,000
Realtor                                               0   Total Debt
Licensing                                         1,000
Total Fixed Assets                               34,350   Owner's Equity               11,209


Total Assets                                        ###   Total Liabilities + Equity

Contenu connexe

Tendances

Wilkins Kennedy - Business Recovery: Early signs a business is in financial t...
Wilkins Kennedy - Business Recovery: Early signs a business is in financial t...Wilkins Kennedy - Business Recovery: Early signs a business is in financial t...
Wilkins Kennedy - Business Recovery: Early signs a business is in financial t...misssarahj
 
Casushandelsgeestblanco
CasushandelsgeestblancoCasushandelsgeestblanco
CasushandelsgeestblancoFlexs bv
 
whole food market fr08_is
whole food market  fr08_iswhole food market  fr08_is
whole food market fr08_isfinance44
 
Successful Cash Management For Your Business
Successful Cash Management For Your BusinessSuccessful Cash Management For Your Business
Successful Cash Management For Your Businessrfarnum
 
6. Seastar 6.5ha Quaterly Report
6. Seastar 6.5ha   Quaterly Report6. Seastar 6.5ha   Quaterly Report
6. Seastar 6.5ha Quaterly Reportericbali
 
Do not submit acc 422 week 3 wiley plus assignment exercises
Do not submit acc 422 week 3 wiley plus assignment    exercisesDo not submit acc 422 week 3 wiley plus assignment    exercises
Do not submit acc 422 week 3 wiley plus assignment exercisesjefferysbush1
 
Financial Plan Profit And Loss Account
Financial Plan Profit And Loss AccountFinancial Plan Profit And Loss Account
Financial Plan Profit And Loss Accountruhma
 
Budget Variance PowerPoint Presentation Slides
Budget Variance PowerPoint Presentation SlidesBudget Variance PowerPoint Presentation Slides
Budget Variance PowerPoint Presentation SlidesSlideTeam
 
BU121 StudentToGo New Venture
BU121 StudentToGo New VentureBU121 StudentToGo New Venture
BU121 StudentToGo New Venturephileverson
 
Finance Budgeting PowerPoint Presentation Slides
Finance Budgeting PowerPoint Presentation SlidesFinance Budgeting PowerPoint Presentation Slides
Finance Budgeting PowerPoint Presentation SlidesSlideTeam
 
Coffee dispenser projection 50 cups eng
Coffee dispenser projection 50 cups   engCoffee dispenser projection 50 cups   eng
Coffee dispenser projection 50 cups engmbarlow939
 
Assign 1 sem 3 11 12-revised
Assign 1  sem 3 11 12-revisedAssign 1  sem 3 11 12-revised
Assign 1 sem 3 11 12-revisednazrinazlan
 
BSB SKY CITY NIGERIA DEVELOPMENT CLUB
BSB SKY CITY NIGERIA DEVELOPMENT CLUBBSB SKY CITY NIGERIA DEVELOPMENT CLUB
BSB SKY CITY NIGERIA DEVELOPMENT CLUBOsa Okundaye Odmd
 
Budget Variance Analysis PowerPoint Presentation Slides
Budget Variance Analysis PowerPoint Presentation SlidesBudget Variance Analysis PowerPoint Presentation Slides
Budget Variance Analysis PowerPoint Presentation SlidesSlideTeam
 
credit suisse Annual Report Part 3 Financial report continued Income statement
 credit suisse Annual Report Part 3 Financial report continued Income statement  credit suisse Annual Report Part 3 Financial report continued Income statement
credit suisse Annual Report Part 3 Financial report continued Income statement QuarterlyEarningsReports2
 
Actual Vs Budget Variance PowerPoint Presentation Slides
Actual Vs Budget Variance PowerPoint Presentation SlidesActual Vs Budget Variance PowerPoint Presentation Slides
Actual Vs Budget Variance PowerPoint Presentation SlidesSlideTeam
 
Budget Projection PowerPoint Presentation Slides
Budget Projection PowerPoint Presentation SlidesBudget Projection PowerPoint Presentation Slides
Budget Projection PowerPoint Presentation SlidesSlideTeam
 

Tendances (19)

Wilkins Kennedy - Business Recovery: Early signs a business is in financial t...
Wilkins Kennedy - Business Recovery: Early signs a business is in financial t...Wilkins Kennedy - Business Recovery: Early signs a business is in financial t...
Wilkins Kennedy - Business Recovery: Early signs a business is in financial t...
 
Casushandelsgeestblanco
CasushandelsgeestblancoCasushandelsgeestblanco
Casushandelsgeestblanco
 
Eden Grove Hotel Projections
Eden Grove Hotel ProjectionsEden Grove Hotel Projections
Eden Grove Hotel Projections
 
whole food market fr08_is
whole food market  fr08_iswhole food market  fr08_is
whole food market fr08_is
 
Successful Cash Management For Your Business
Successful Cash Management For Your BusinessSuccessful Cash Management For Your Business
Successful Cash Management For Your Business
 
6. Seastar 6.5ha Quaterly Report
6. Seastar 6.5ha   Quaterly Report6. Seastar 6.5ha   Quaterly Report
6. Seastar 6.5ha Quaterly Report
 
Do not submit acc 422 week 3 wiley plus assignment exercises
Do not submit acc 422 week 3 wiley plus assignment    exercisesDo not submit acc 422 week 3 wiley plus assignment    exercises
Do not submit acc 422 week 3 wiley plus assignment exercises
 
Financial Plan Profit And Loss Account
Financial Plan Profit And Loss AccountFinancial Plan Profit And Loss Account
Financial Plan Profit And Loss Account
 
Budget Variance PowerPoint Presentation Slides
Budget Variance PowerPoint Presentation SlidesBudget Variance PowerPoint Presentation Slides
Budget Variance PowerPoint Presentation Slides
 
BU121 StudentToGo New Venture
BU121 StudentToGo New VentureBU121 StudentToGo New Venture
BU121 StudentToGo New Venture
 
Finance Budgeting PowerPoint Presentation Slides
Finance Budgeting PowerPoint Presentation SlidesFinance Budgeting PowerPoint Presentation Slides
Finance Budgeting PowerPoint Presentation Slides
 
Coffee dispenser projection 50 cups eng
Coffee dispenser projection 50 cups   engCoffee dispenser projection 50 cups   eng
Coffee dispenser projection 50 cups eng
 
Assign 1 sem 3 11 12-revised
Assign 1  sem 3 11 12-revisedAssign 1  sem 3 11 12-revised
Assign 1 sem 3 11 12-revised
 
BSB SKY CITY NIGERIA DEVELOPMENT CLUB
BSB SKY CITY NIGERIA DEVELOPMENT CLUBBSB SKY CITY NIGERIA DEVELOPMENT CLUB
BSB SKY CITY NIGERIA DEVELOPMENT CLUB
 
Budget Variance Analysis PowerPoint Presentation Slides
Budget Variance Analysis PowerPoint Presentation SlidesBudget Variance Analysis PowerPoint Presentation Slides
Budget Variance Analysis PowerPoint Presentation Slides
 
credit suisse Annual Report Part 3 Financial report continued Income statement
 credit suisse Annual Report Part 3 Financial report continued Income statement  credit suisse Annual Report Part 3 Financial report continued Income statement
credit suisse Annual Report Part 3 Financial report continued Income statement
 
Actual Vs Budget Variance PowerPoint Presentation Slides
Actual Vs Budget Variance PowerPoint Presentation SlidesActual Vs Budget Variance PowerPoint Presentation Slides
Actual Vs Budget Variance PowerPoint Presentation Slides
 
Fluxo de Caixa Nl10
Fluxo de Caixa Nl10Fluxo de Caixa Nl10
Fluxo de Caixa Nl10
 
Budget Projection PowerPoint Presentation Slides
Budget Projection PowerPoint Presentation SlidesBudget Projection PowerPoint Presentation Slides
Budget Projection PowerPoint Presentation Slides
 

Similaire à Grape Leaf Financials

Sgs Sfp 2012 15 C
Sgs Sfp 2012 15 CSgs Sfp 2012 15 C
Sgs Sfp 2012 15 Cmarsfs
 
Westheimer mobil station
Westheimer mobil stationWestheimer mobil station
Westheimer mobil stationrobertday
 
Ignou mcs 035 solved assignment 2012-13
Ignou mcs 035 solved assignment 2012-13Ignou mcs 035 solved assignment 2012-13
Ignou mcs 035 solved assignment 2012-13mohit123456789
 
Ch 10 financial management notes
Ch 10 financial management notesCh 10 financial management notes
Ch 10 financial management notesBabasab Patil
 
Chapter 10generac flujo caja
Chapter 10generac flujo cajaChapter 10generac flujo caja
Chapter 10generac flujo cajafedericoblanco
 
viability-presentation-se-98b.pptx
viability-presentation-se-98b.pptxviability-presentation-se-98b.pptx
viability-presentation-se-98b.pptxSAYKEATTAN
 
Trading summary template
Trading summary templateTrading summary template
Trading summary templatephanquoccuong
 
C Miller Wk5 Project1
C Miller Wk5 Project1C Miller Wk5 Project1
C Miller Wk5 Project1treavor96
 
Case Week 7 Carrie Miller
Case Week 7 Carrie MillerCase Week 7 Carrie Miller
Case Week 7 Carrie Millertreavor96
 
Standard Deduction Table
Standard Deduction TableStandard Deduction Table
Standard Deduction Tabletaxman taxman
 
Bogardus spreadsheet example part 2
Bogardus spreadsheet example part 2Bogardus spreadsheet example part 2
Bogardus spreadsheet example part 2LPE Learning Center
 
Google Q4 2012 Quarterly Earnings Summary
Google Q4 2012 Quarterly Earnings SummaryGoogle Q4 2012 Quarterly Earnings Summary
Google Q4 2012 Quarterly Earnings SummaryKit Seeborg
 
Google Q4 2012 Quarterly Earnings Summary
Google Q4 2012 Quarterly Earnings SummaryGoogle Q4 2012 Quarterly Earnings Summary
Google Q4 2012 Quarterly Earnings SummaryKamaldeep Singh SEO
 
Standard Deduction Table
Standard Deduction TableStandard Deduction Table
Standard Deduction Tabletaxman taxman
 
My Business Project (INVERSE)
My Business Project (INVERSE)My Business Project (INVERSE)
My Business Project (INVERSE)rifasimponi
 

Similaire à Grape Leaf Financials (20)

Sgs Sfp 2012 15 C
Sgs Sfp 2012 15 CSgs Sfp 2012 15 C
Sgs Sfp 2012 15 C
 
Westheimer mobil station
Westheimer mobil stationWestheimer mobil station
Westheimer mobil station
 
Sample Budget
Sample BudgetSample Budget
Sample Budget
 
Ignou mcs 035 solved assignment 2012-13
Ignou mcs 035 solved assignment 2012-13Ignou mcs 035 solved assignment 2012-13
Ignou mcs 035 solved assignment 2012-13
 
Accruals 16.02.09
Accruals 16.02.09Accruals 16.02.09
Accruals 16.02.09
 
Accruals 16.02.09
Accruals 16.02.09Accruals 16.02.09
Accruals 16.02.09
 
Accruals 16.02.09
Accruals 16.02.09Accruals 16.02.09
Accruals 16.02.09
 
Ch 10 financial management notes
Ch 10 financial management notesCh 10 financial management notes
Ch 10 financial management notes
 
Chapter 10generac flujo caja
Chapter 10generac flujo cajaChapter 10generac flujo caja
Chapter 10generac flujo caja
 
viability-presentation-se-98b.pptx
viability-presentation-se-98b.pptxviability-presentation-se-98b.pptx
viability-presentation-se-98b.pptx
 
Trading summary template
Trading summary templateTrading summary template
Trading summary template
 
C Miller Wk5 Project1
C Miller Wk5 Project1C Miller Wk5 Project1
C Miller Wk5 Project1
 
Case Week 7 Carrie Miller
Case Week 7 Carrie MillerCase Week 7 Carrie Miller
Case Week 7 Carrie Miller
 
Standard Deduction Table
Standard Deduction TableStandard Deduction Table
Standard Deduction Table
 
Bogardus spreadsheet example part 2
Bogardus spreadsheet example part 2Bogardus spreadsheet example part 2
Bogardus spreadsheet example part 2
 
Google Q4 2012 Quarterly Earnings Summary
Google Q4 2012 Quarterly Earnings SummaryGoogle Q4 2012 Quarterly Earnings Summary
Google Q4 2012 Quarterly Earnings Summary
 
Google Q4 2012 Quarterly Earnings Summary
Google Q4 2012 Quarterly Earnings SummaryGoogle Q4 2012 Quarterly Earnings Summary
Google Q4 2012 Quarterly Earnings Summary
 
Standard Deduction Table
Standard Deduction TableStandard Deduction Table
Standard Deduction Table
 
Cash Flow Projection
Cash Flow ProjectionCash Flow Projection
Cash Flow Projection
 
My Business Project (INVERSE)
My Business Project (INVERSE)My Business Project (INVERSE)
My Business Project (INVERSE)
 

Grape Leaf Financials

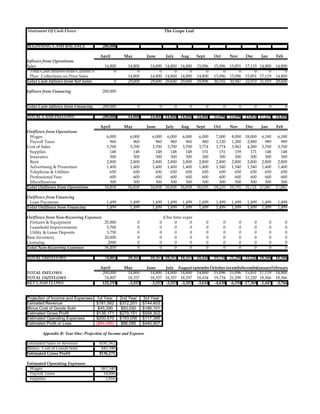
  • 1. Statement Of Cash Flows The Grape Leaf BEGINNING CASH BALANCE 200,000 April May June July Aug Sept Oct Nov Dec Jan Feb Inflows from Operations Sales 14,800 14,800 14,800 14,800 14,800 15,096 15,096 15,851 17,119 14,800 14,800 Total Cash Inflows from Current Sales 0 0 0 0 0 0 0 0 0 0 0 Plus: Collections on Prior Sales 14,800 14,800 14,800 14,800 14,800 15,096 15,096 15,851 17,119 14,800 Total Cash Inflows from Net Sales 0 29,600 29,600 29,600 29,600 29,896 30,192 30,947 32,970 31,919 29,600 Inflows from Financing 200,000 Total Cash Inflows from Financing 200,000 0 0 0 0 0 0 0 0 0 0 TOTAL CASH INFLOWS 200,000 14,800 14,800 14,800 14,800 14,800 15,096 15,096 15,851 17,119 14,800 April May June July Aug Sept Oct Nov Dec Jan Feb Outflows from Operations Wages 6,000 6,000 6,000 6,000 6,000 6,000 7,000 8,000 18,000 6,180 6,180 Payroll Taxes 960 960 960 960 960 960 1,120 1,280 2,880 989 989 Cost of Sales 3,700 3,700 3,700 3,700 3,700 3,774 3,774 3,963 4,280 3,700 3,700 Supplies 148 148 148 148 148 151 151 159 171 148 148 Insurance 300 300 300 300 300 300 300 300 300 300 300 Rent 2,800 2,800 2,800 2,800 2,800 2,800 2,800 2,800 2,800 2,800 2,800 Advertising & Promotion 1,400 1,400 1,400 1,400 1,400 1,400 1,540 1,540 1,540 1,400 1,400 Telephone & Utilities 650 650 650 650 650 650 650 650 650 650 650 Professional Fees 600 600 600 600 600 600 600 600 600 600 600 Miscellaneous 300 300 300 300 300 300 300 500 500 300 300 Total Outflows from Operations 16,858 16,858 16,858 16,858 16,858 16,935 18,235 19,791 31,721 17,067 17,067 Outflows from Financing Loan Payments 1,499 1,499 1,499 1,499 1,499 1,499 1,499 1,499 1,499 1,499 1,499 Total Outflows from Financing 1,499 1,499 1,499 1,499 1,499 1,499 1,499 1,499 1,499 1,499 1,499 Outflows from Non-Recurring Expenses (One time expense) Fixtures & Equipment 25,000 0 0 0 0 0 0 0 0 0 0 Leasehold Improvements 5,700 0 0 0 0 0 0 0 0 0 0 Utility & Lease Deposits 3,750 0 0 0 0 0 0 0 0 0 0 Base Inventory 20,000 0 0 0 0 0 0 0 0 0 0 Licensing 2000 0 0 0 0 0 0 0 0 0 0 Total Non-Recurring Expenses 56,450 0 0 0 0 0 0 0 0 0 0 TOTAL OUTFLOWS 74,807 18,357 18,357 18,357 18,357 18,434 19,734 21,290 33,220 18,566 18,566 April May June July August eptember ctober ovember S O N December JanuaryFebruary TOTAL INFLOWS 200,000 14,800 14,800 14,800 14,800 14,800 15,096 15,096 15,851 17,119 14,800 TOTAL OUTFLOWS 74,807 18,357 18,357 18,357 18,357 18,434 19,734 21,290 33,220 18,566 18,566 NET CASH FLOWS 125,193 -3,557 -3,557 -3,557 -3,557 -3,634 -4,638 -6,194 -17,369 -1,447 -3,766 Projection of Income and Expenses 1st Year 2nd Year 3rd Year Esimated Revenue $181,562 $372,201 $744,403 Minus Cost of Goods Sold $45,390 $93,050 $186,101 Estimated Gross Profit $136,171 $279,151 $558,302 Estimated Operating Expenses $200,670 $193,056 $117,395 Estimated Profit or Loss ($64,499) $86,095 $440,907 Appendix B: Year One: Projection of Income and Expense Estimated Sales or Revenue $181,562 Minus: Cost of Goods Sold $45,390 Estimated Gross Profit $136,171 Estimated Operating Expenses Wages $87,540 Payroll Taxes 14,006 Supplies 1,816
  • 2. Insurance 3,600 Rent 33,600 Advertising & Promotion 17,220 Telephone & Utilities 7,800 Professional Fees 8,100 Miscellaneous 4,000 Interest $17,988 Depreciation $5,000 Total Estimated Operating Expenses$200,670 Estimated Net Profit or Loss ($64,499) Appendix C: Year Two: Projection of Income and Expense Estimated Sales or Revenue $372,201 Minus: Cost of Goods Sold $93,050 Estimated Gross Profit $279,151 Estimated Operating Expenses Wages $84,160 Payroll Taxes 13,466 Supplies 1,816 Insurance 3,780 Rent 33,600 Advertising & Promotion 17,220 Telephone & Utilities 7,800 Professional Fees 8,343 Miscellaneous 4,000 Interest $13,872 Depreciation $5,000 Total Estimated Operating Expenses$193,056 Estimated Net Profit or Loss $86,095 Appendix D: Year Three Projection: Income and Expense Estimated Sales or Revenue $744,403 Minus: Cost of Goods Sold $186,101 Estimated Gross Profit $558,302 Estimated Operating Expenses Wages $16,365 Payroll Taxes 2,618 Supplies 1,816 Insurance 3,969 Rent 35,280 Advertising & Promotion 18,081 Telephone & Utilities 7,800 Professional Fees 8,593 Miscellaneous 4,000 Interest $13,872 Depreciation $5,000 Total Estimated Operating Expenses$117,395 Estimated Net Profit or Loss $440,907 Break Even Analysis Year Month Fixed Costs $200,670 $15,074 Average Sale Price $10 $10 Total Variable Cost $2 $2 Total Contribution Margin $8 $8 Break Even Point 25,401 1,908
  • 3. March TOTAL 14,800 181,562 0 0 14,800 166,762 29,600 333,523 0 200,000 14,800 366,762 March TOTAL 6,180 87,540 989 14,006 3,700 45,390 148 1,816 300 3,600 2,800 33,600 1,400 17,220 650 7,800 1,500 8,100 300 4,000 17,967 223,072 1,499 17,988 1,499 17,988 0 25,000 0 5,700 0 3,750 0 20,000 0 2,000 0 56,450 19,466 297,510 March 14,800 366,762 19,466 297,510 -4,666 69,251
  • 4.
  • 5. Appendix I & J Current Assets and Liabilities Current Assets Current Liabilities Cash ### Current Portion Long Term Debt 17,988 Inventory ### Wages 49,500 Payroll Taxes 7,920 Total Current Assets ### Rent 33,600 Total Current Liabilities Fixed Assets Long Term Debt ### Fixtures & Equipment 15,850 Leasehold Improvements 3,750 Utility & Lease Deposits 3,750 Base Inventory 10,000 Realtor 0 Total Debt Licensing 1,000 Total Fixed Assets 34,350 Owner's Equity 11,209 Total Assets ### Total Liabilities + Equity