APM Welcome, APM North West Network Conference, Synergies Across Sectors
Latihan spss correlation-fani
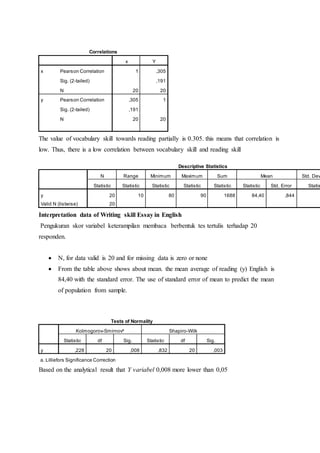
1. Correlations
x Y
x Pearson Correlation 1 ,305
Sig. (2-tailed) ,191
N 20 20
y Pearson Correlation ,305 1
Sig. (2-tailed) ,191
N 20 20
The value of vocabulary skill towards reading partially is 0.305. this means that correlation is
low. Thus, there is a low correlation between vocabulary skill and reading skill
Descriptive Statistics
N Range Minimum Maximum Sum Mean Std. Dev
Statistic Statistic Statistic Statistic Statistic Statistic Std. Error Statis
y 20 10 80 90 1688 84,40 ,844
Valid N (listwise) 20
Interpretation data of Writing skill Essay in English
Pengukuran skor variabel keterampilan membaca berbentuk tes tertulis terhadap 20
responden.
N, for data valid is 20 and for missing data is zero or none
From the table above shows about mean. the mean average of reading (y) English is
84,40 with the standard error. The use of standard error of mean to predict the mean
of population from sample.
Tests of Normality
Kolmogorov-Smirnova
Shapiro-Wilk
Statistic df Sig. Statistic df Sig.
y ,228 20 ,008 ,832 20 ,003
a. Lilliefors Significance Correction
Based on the analytical result that Y variabel 0,008 more lower than 0,05