SlideShare a Scribd company logo
1 of 14
Usage, Usability, and Utility of 3D City Models, 02008 (2012)
DOI: 10.1051/3u3d/201202008
C Owned by the authors, published by EDP Sciences, 2012
EnVIE project: A framework to produce urban data at
large scale
V. Tourre1
, P. Cadio2
, G. Caniot3
and C. Papin4
1 LUNAM Université, École Centrale de Nantes, CERMA UMR CNRS 1563, 1, rue de la Noë,
BP. 92101, 44321 Nantes Cedex 3, France
2 MGDIS, Parc d’Innovation Bretagne Sud, CP 10, 56038 Vannes, France
3 MeteoDyn, 14 Bd. Winston Churchill, 44100 Nantes, France
4 SIRADEL, 3 allée Adolphe Bobierre 35043 Rennes, France
Abstract. The decision making process related to urban areas synthetizes a lot of data taking into account
numerous parameters. The indicators produced from simulations or data mining on 3D city models (3DCM)
can be a great help into these decision-making processes. The problem is to acquire and process the 3DCM
in order to produce these indicators at city scale. The EnVIE project proposes a framework to perform the
acquisition of 3DCM and then to produce 3D or 2D metadata on these models. As several city councils have
been interviewed in the scope of the project to describe their real needs, the computed metadata are directly
usable into the decision-making process. The main contribution of this framework is to merge existing
techniques to build a pipeline allowing to compute lighting and wind simulation, and to extract socio-
economic metadata with data-mining techniques. This on-going work builds a link between indicators at
the building scale and 2D indicators at larger scale from GIS, and therefore is a step towards an indicator
production process at full-scale range.
1. INTRODUCTION
Thinking, refurbishing or building the city of tomorrow remains a tricky issue. More and more people
live in urban areas worldwide and want an improved quality of life: more work, better facilities, etc.
In parallel, most of the cities see their environmental, socioeconomic and socio-demographic indicators
negatively impacted since they are affected by too many rapid changes: pollutions, waste and energy
consumption, traffics, type and geographical distribution of population. . .
In that context, the 3D modeling of complex urban communities is a well-known and powerful
tool for decision-making and communication. It allows displaying and interacting with city features
at different scales (buildings, trees, road network, street furniture. . . ), simulating some scenarios
(urban planning, deployment or optimization of telecom, energy or transport infrastructures, risks
management. . . ) while making participating citizens to decision-making or just raising public awareness
of public programs and expenses.
However, it still lacks a way to seamlessly product, integrate and merge into such a 3D
representation some heterogeneous data that would bring more value to the 3D model. Such
complementary attributes are for instance outcomes from simulation tools that use 3D data as
inputs (wind resource mapping and forecasting, radio propagation models, noise pollution, street
lighting, etc.), but also from results of detection or classification algorithms based on processing of
aerial, satellite or terrestrial High Resolution (HR) imagery and LIDAR. 3D city models (3DCM)
can also be enriched with higher level (semantic) descriptors of the environment or with some
understandable eco-labels obtained through cross-data analysis: e.g. the global heat losses in 3D,
This is an Open Access article distributed under the terms of the Creative Commons Attribution License 2.0, which permits
unrestricted use, distribution, and reproduction in any medium, provided the original work is properly cited.
Article published by EDP Sciences and available at http://3u3d.edpsciences.org or http://dx.doi.org/10.1051/3u3d/201202008
Usage, Usability, and Utility of 3D City Models
Figure 1. Illustrations of some topics addressed as part of the EnVIE project: at top, potential energy (sun exposure,
wind), at bottom, heat losses combined with socioeconomic data and environmental quality indicators.
i.e. a unique tag encompassing both losses at the roof and façades levels (aerial and terrestrial
thermal imaging), but also taking into account the building superstructures so as to refine the
analysis. Another class of high level descriptors attempts to qualify and rank the human perception
and acceptability of his surrounding environment (comfort or stress). It is based on the combined
use of features from 3D geometry (visibility, pavement width, building height. . . ) and additional
inputs like the presence of trees, the wind and temperature fields, lighting, the noise pollution or
others.
The next step consists in combining those outcomes with some socioeconomic and demographic
attributes (land registry, census data or from geo-marketing data mining. . . ). This ultimate goal
is straight addressed by the EnVIE project (“Enrichment of digital 3D cities with environmental
eco-indicators”). This 2-years long project started in 2011 and addresses the four following
topics:
• 3D modeling of urban areas.
• Potential energy (contributions and losses).
• Environmental quality (human perception of comfort).
• Economic and social situation.
All these individual outcomes are merged and finally integrated into the 3D model to offer much more
possibilities to analyze and understand the city. This will result in an enriched 3DCM allowing multi-
scale and multi-criteria representation and analysis for decision-making and communication purposes.
A working group that encompasses different urban communities and cities (Rennes Métropole,
Nantes Métropole, Sant-Grégoire and Cesson-Sévigné) has been established at the project start. It
allowed the EnVIE Consortium to gather a wide range of expressed needs from various technical
services (GIS, Environment...) and elected representatives.
This paper describes in section 2 the state of the art before introducing the overall EnVIE framework
in section 3. The first results are illustrated in section 4 and discussed in section 5. Finally, section 6
concludes.
02008-p.2
European COST Action TU0801
2. PREVIOUS WORKS
2.1 3D model acquisition
Many markets ask for more immersivity and 3D city models gains always more traction. 3D models
can also be used as a powerful interface to aggregate and display multiples levels of information. This
requires an accurate building modeling, texture mapping (aerial or terrestrial images or results from
scientific computations), insertion of various additional 3D objects, but also managing data complexity,
structure and source-channel coding for enabling real-time navigation whatever the network and the
rendering device is. In particular, more and more stakeholders ask for navigation at the street level
and not only a simple bird’s eyes view (communication, virtual tourism, Location-Based B2B or B2C
Services...) associated with the need of both data fidelity and a strong feeling of realism.
3D city models can be obtained by means of photogrammetry from aerial or satellite stereo images.
3D vectors or 3D coordinates of key points characterizing roofs, terrain or some infrastructures like
roads are determined. For more realism, the Digital Terrain Model (DTM) as well as the roofs and the
building’s façades can be mapped with image textures. When pedestrian navigation is targeted, aerial
imagery becomes not enough to achieve realistic façade texturing. A new type of acquisition systems
is gaining traction: the Mobile Mapping Systems (MMS). MMS has been evolving quickly and can
embed highly accurate multi-sensor platforms, equipped for instance with GPS/IMU/DMI localization
systems, high-resolution RGB cameras, terrestrial LIDAR... As an example, the production chain of the
SIRADEL’s MMS [1] includes 3 successive stages: 3D model registration using laser data, occlusion
detection using both laser and imagery sensors, and finally image merging. Figure 2 shows the MMS
system once deployed over the vehicle roof.
The simplest class of 3D building models consists of grey walls and flat roofs extruded from 2D
building outlines. They are quite simple to handle at a wide scale and are well-suited for GIS-oriented
applications or simulation purposes (e.g. Computational Fluid Dynamics or CFD, radio propagation...).
More realism can be achieved both in geometry (roof superstructures, recesses in building façades,
balconies...), and through texture mapping. Figure 2 shows that roofs can be modeled very accurately
from high resolution aerial pictures (5 cm in the example at middle). This is of importance for instance
when evaluating the potential energy of solar panel. The second step consisted in projecting aerial ortho-
imagery onto the roof. The use of aerial imagery is still relevant for façade texturing since resolution is
getting better (ground point size less than 10 cm is now quite common, cf. Figure 2 below from 5 cm
images). Generic (geo-typical) textures or aerial oblique (or not if overlapping between images is high)
imagery can be used. But even whether the image resolution has getting better over the years, only
using aerial images to texture façades appears to be not enough and perspective discrepancies at the
street level are visually unpleasant. A terrestrial image-based approach has to be preferred, especially
for street view navigation or monitoring.
As regards geometry, some past studies proposed algorithms for automatic computation of generic
roofs based on Digital Elevation Model (DEM). More recently, façade segmentation and window
detection techniques based on oblique aerial images have been proposed to improve the façade
rendering, like in [2]. However, due to perspective and image resolution, this does not appear relevant for
ensuring an accurate detection and extraction of objects that are not located in the plane of the façade,
like balcony. Again, a terrestrial approach should be privileged.
2.2 Large scale simulation
Authors in [3] proposed a method for planning and optimization of new wideband radio networks over
large geographical areas with deterministic tools. They presented a fast and robust propagation model
that computes 3-D ray contributions using 3-D urban model. Experiments were conducted on an area of
64 km2
.
02008-p.3
Usage, Usability, and Utility of 3D City Models
Figure 2. Limitations when texturing façades from aerial imagery. On the left: comparison between a façade
textured with terrestrial images (see section 2.1) at the left side and aerial pictures −15 cm- on the right (city
of Rennes). At middle: accurate roof modeling and texturing from 5 cm images (data is property of the city of
Nîmes, France). At right: SIRADEL’s MMS.
Figure 3. Wind Comfort map before urban renewal.
Meteodyn [4] has a broad experience in wind and solar simulation over a large domain. For example,
wind comfort and insulation frequency was computed in Saint-Brieuc district:
2.3 Indicator production
In order to aid the decision making process, the results of the preceding simulations have to be translated
into understandable indicators for the urban community managers. The ADEQUA [5] project have
proposed a methodology to aid the decision making process during the building or the renewing of
a residential area. The goal is to clearly present various indicators in order to show the complexity and
the underlying mechanisms of the sustainable development. Following the same sustainable approach,
the PACIBA project [6] presents a methodology and software in order to handle the early stages of
conceptual design. Several physical phenomena are taken into account to preview what could be the
energetic qualities of a small city area.
02008-p.4
European COST Action TU0801
Figure 4. Wind Comfort map after urban renewal.
Figure 5. Annual Insulation Frequency before urban renewal.
Figure 6. Annual Insulation Frequency after urban renewal.
02008-p.5
Usage, Usability, and Utility of 3D City Models
Figure 7. Overall EnVIE workflow.
3. FRAMEWORK
3.1 3D city modeling
The 3D city model is the common base on which all EnVIE metadata has been aggregated. For partners,
3DCM is used in different ways: extracting descriptors of the city environment, input data for simulation
or 3D container allowing displaying multiple data. For end-users, when combined with real-time 3D
navigation capabilities, it enables benefiting from a smart user interface for interactive access to eco-
labels. The 3D city model encompasses the terrain, the buildings (in LOD1), the vegetation, the street
furniture and some administrative borders.
SIRADEL produced distinct city models from two representative areas, located respectively in
Rennes and in Saint-Grégoire. These 2 samples are large enough to validate different use cases and
are complementary in terms of contents (residential area, houses, tower blocks. . . )
As an example, the Figure below illustrates different levels of city modeling.
3.2 Data exchange
The interoperability problem is to exchange geometric data, to add metadata related to this geometric
data, and then to exchange this metadata. So on one side, we have to send 2D or 3D geometric data to
perform simulations and analysis, and on the other side, we have to keep semantic attributes in order
to build a hierarchic structure of the city model. We have chosen to have two distinct data processes
depending on the metadata dimensions, and two distinct files.
3.3 3D metadata – simulation
The STL format is highly recognized for several simulators and has been chosen as the simulation
format. The CityGML format adds a semantic level and hierarchic structure needed for using the
metadata. We add a linking file to explicitly describe the relationship between STL triangle patches and
CityGML entities; in order to retrieve the CityGML entities triangle patches belongs to. This linking file
is a kind of “CityGML light” format containing a simple 3D geometric hierarchic structure, each entity
embedding the set of STL triangle patch identifier and the CityGML entity identifier.
Therefore the STL file can be used to perform simulations onto the 3DCM and produce metadata
over each triangle patches. Then, thanks to the linking file, the computed metadata can be associated to
the corresponding CityGML entity.
02008-p.6
European COST Action TU0801
Figure 8. Different level of city modeling. At top, San Francisco, one of the thousands of cities in LOD11
produced
by SIRADEL all around the world. At bottom-left, realistic 3D model of Rennes (France) in LOD2 and LOD3 with
terrestrial texture acquired by a Mobile Mapping System (MMS) from SIRADEL. At bottom-right, 3D landmark
and enrichment with street furniture.
3.3.1 Metadata related to lighting and energy
Wind characteristics and solar energy are computed using simulation software called Urbawind. Thanks
to its powerful CFD (Computational Fluid Dynamics) solver, wind characteristics such as wind speed,
wind direction and wind energy can be assessed over a large domain such as a district.
In order to compute direct solar energy for a very large domain, an optimized structure of the
geometric objects (thanks to Bounding Volume Hierarchy) combined with fast computation on GPU
(Graphical Processor Unit) gives us a shadow map for a sun position. By summing over a period, a
frequency of shadow (or light) can be assessed. Solar energy from direct lighting can be computed from
summing all beans taking into account energy a beam at each time step.
From the CAD file in STL format, wind and solar results are computed over roofs, façades and
streets. Thanks to “CityGML light” format, as described below, the energy and lighting metadata related
to CityGML entity can be sorted it out.
3.3.2 Metadata related to pedestrian perception
The STL data is converted into the specific data format needed by Solene. Solene is a lighting and
thermic simulator based on radiosity, and able to handle visibility and comfort problems [7]. In the
EnVIE project, the Solene simulator is used to compute indirect lighting used in lighting and energy
metadata, but also the pedestrian visibility of specific buildings or vegetation, and the pedestrian thermic
comfort.
1 LOD: Level of Detail.
02008-p.7
Usage, Usability, and Utility of 3D City Models
The challenge of these metadata based on the pedestrian perception is describing a local perception
represented in a 3D scene. A local perception is situated in space; this is the easy part to represent on
a map or in a 3D scene, but also in time. The pedestrian perception depends on what the pedestrian
has done before, and sometimes, on what he will do later or what he has planed to do. As the time
dimension is difficult to take into account without any walkway or path clues, in this paper we focus on
the visibility of specific building, because this indicator is less biased without the time dimension.
3.4 2D metadata – City inhabitants
The aim of this project is to provide socio-demographic data within spatial environmental data. MGDIS
applies their expertise in the value-addition on public data. Starting from public information made
available by institutions (INSEE, Government-owned agencies, etc.), MGDIS is able to compute
populations from areas, and to localize the profiles of people in their residence.
The advantage of this approach is to provide a detailed knowledge of population and housing
currently present in the territory, in order to facilitate interpretation and diagnostic. This also enables an
organization to identify possible actions toward population in the concerned living areas. For example,
a tenant is not supposed to be contacted by a city for additional ecological equipment.
3.4.1 Buildings identification from the 3D representation
The development of a parcel layer (data from the cadastre) is necessary to precisely locate 3D buildings
in the city. This parcel identification allows the linking of a 3D representation of the building with
cadastral information listed by the municipality. From this information, a profile of inhabiting is
determined and thus allows identifying a population potentially present in the living area.
The algorithm consists in matching the map of parcels (land register), used to identify housing, with
the actual map of the buildings, taking into account the constraints linked to the 3D representation of
the city (joint ownership of buildings, etc.).
3.4.2 The granularity of information
Socio-demographic data can then be piled on this new 3D base map, which respects the city morphology
and its cadastral representation.
To this date, providers of public data in France, such as INSEE, must respect the constraints of
privacy edited by the national numeric privacy agency (CNIL), and publish aggregate data on the level
of a territory. The finest geographical level published by INSEE is the IRIS, an infra-municipal territory
representing a population of roughly 2,000 inhabitants, for municipalities with more than 10 000
inhabitants. For municipalities with fewer than 10 000 inhabitants, the level is the basic geographic
Township.
In order to refine the result and correctly affect the inhabitants in the 3D city, information must
be analyzed some more to obtain a given granularity. This granularity of information is obtained from
algorithms developed by MGDIS, allowing the correspondence between the cadastral information at the
address, and demographic information in IRIS. In the end, this allows the identification of populations
present on that territory, together with the type of housing, and indicates to the user the level of
robustness in the results.
4. FIRST RESULTS
This section illustrates some preliminary outcomes. Data integration in the final system is not taken into
account at this rate.
02008-p.8
European COST Action TU0801
Figure 9. (left) Hedge extraction in a laser point cloud. Low vegetation points are represented in green and final
hedges are in red, (right) Tree extraction in a laser point cloud. Green shows the top of the detected trees.
4.1 Vegetation detection
Detection and classification of the vegetation are commonly achieved using aerial imagery: e.g. near-
infrared imagery for detection and DEM for classification (high vegetation or low vegetation). For some
objects, a terrestrial-based approach can be relevant as well. For example, trunks of trees are not visible
from aerial views. In general, the tree location is assigned to the middle of the canopy and not to the
middle of the trunk.
SIRADEL implemented a tree and hedges detection method from input data acquired on ground.
Regarding hedge, “green areas” are first detected from terrestrial images. Then, hedges are geometrically
extracted from the terrestrial laser points. The main issue in this step is to select only vegetation
pixels from winter images, where branch and shadow colors are quite similar. The second stage
consists in analyzing the geometrical characteristics of each individual hedge. Results are shown in
Figure 9 (left).
The most common way to detect trees in terrestrial laser data is to extract their trunks by finding
cylinders in the laser points [8, 9]. However, trunks are often hidden behind hedges in residential areas.
Our method includes a first filtering of potential tree points by analyzing a point projection image onto
the ground. Results are shown in Figure 9 (right).
A terrestrial approach, when considered alone, is not enough but can complement well another
processing. Aerial detection can be considered as a global method, while terrestrial detection helps
improving accuracy in terms of position and dimension, at least when the object is visible from the
street.
4.2 Thermal imagery
The MMS can provide a lot of information about the environment, especially thanks to additional
sensors. This represents a unique capability to collect a wide amount of data from the ground. This
allows adding knowledge into the 3D database. We focus here on thermal imagery. As well, these inputs
will be combined with aerial imagery or simulation tools in order to derive eco-indicators (like insulation
fault) that are embedded into the 3D city model.
4.3 Lighting and Wind data
The computed insulation frequency is displayed here using Red color as the maximum and Purple color
as the minimum of insulation frequency for Saint-Grégoire neighborhood (Figures 10 and 11). Wind
characteristics are also accessible here in a 2D plan. Results are shown figures 12 and 13.
02008-p.9
Usage, Usability, and Utility of 3D City Models
Figure 10. Daily Insulation frequency on the streets of Saint-Grégoire.
Figure 11. Daily Insulation frequency on building’s facades of Saint-Grégoire.
4.4 Interviews
A working group that encompasses different urban communities and cities (Rennes Métropole, Nantes
Métropole, Saint-Grégoire and Cesson-Sévigné) has been established at the beginning of the project.
It allowed us to gather a wide range of expressed needs from various technical services (SIG,
Environment...) and elected representatives.
A questionnaire has been sent to these end-users. It included three distinct parts: the first part
provided a set of eco-indicators that could be derived and explored as part of EnVIE, with the possibility
to rank each of them according to 5 levels. The second part proposed some combinations of eco-
indicators given specific uses. A ranking of such different use cases and combinations was also asked for.
The last part of the questionnaire was an open section in order to freely express any kind of comments.
As regards to the eco-indicators themselves, heat losses, the distance to services and urban climate
comfort have been aroused the most interest. Some particular use cases were also preferred by the end-
users. For instance, let us mention the analysis of the daily commute between home and work, local
energy policy or the qualification of existing or new districts. All end-users favor smart but simple tools,
easy-to-use and business-oriented.
02008-p.10
European COST Action TU0801
Figure 12. Directional Wind velocity on 2D Horizontal Plan on the streets of Saint-Grégoire.
Figure 13. Directional Wind velocity on 2D Vertical Plan on the streets of Saint-Grégoire.
4.5 First 2D metadata computations
MGDIS currently works with communities by providing all the information needed for analysis and
diagnosis of territories, starting from the data of institutions (INSEE, local authorities...). This data
is structured and given added value by MGDIS, making them usable and understandable for elected
members working in the definition of public policies.
Data extractions from this heap of public data identify the description of housing and
population, by geographical level, as well as the IRIS (infra-communal INSEE) and policy-related
territories (Agglomerations, departments, regions ...).
Following this approach, MGDIS has been working on algorithms in order to determine the
population potentially present in housing. The example above is used to indicate that an apartment of
50 m2
, built before 1949 in Vannes (intramural), identified on the 3D map (cadastre and 3D
representation), has a probability of 64% of using an electricity-based heating.
02008-p.11
Usage, Usability, and Utility of 3D City Models
Figure 14. Screenshot of the MGDIS solution, enabling population localization from housing type.
Figure 15. Screenshot of the MGDIS solution, enabling population localization from housing type.
5. DISCUSSION
At present, software solutions for communities help elected agents to define public policies by informing
them about strengths and weaknesses in the territory. Through project EnVIE, fine-grained public data,
together with a 3D representation of the territory and environmental constraints, allow precise actions
to be taken, in order to reach goals defined in the community leading plan.
The EnVIE project aims at assisting institutional decision makers in framing and defining policies.
Data collected by each partner will enable decision makers to conduct public policy for sustainable
development, consistent with the needs of the population:
• Analysis of health risks: from environmental information (wind, sun exposure, building insulation)
and demographic information (ages, isolation of the elderly...), elected members can identify
02008-p.12
European COST Action TU0801
risk areas and thus get closer to population during unexpected weather events (heat waves/cold
weather).
• Energy efficiency: communities can identify buildings with low energy performance and help
people equip themselves, with the goals of reducing the energy bill of the population and meeting
the challenges defined in their sustainable development policy.
• Social mix: from this information, policymakers can foster communities in creating social mix of
neighborhoods, thus maintaining a balance between all categories of people and all housing types.
6. CONCLUSION
The EnVIE project merges several techniques in order to produce critical indicators intended to be
used into decision-making processes. A semi-automatic 3D acquisition technique produces a geometric
3DCM in CityGML format. This model is used to compute 3D metadata related to wind, lighting
and thermic phenomenon. Data mining techniques are used to produce 2D metadata related socio-
economic data. The geometric model and the metadata are merged into a full 3DCM in order to build
clear indicators. The main contribution of this project is to setup a full process from acquisition to
visualization, and to mix metadata of various types.
All the processes have now to be automated through web services between projects partners. That is
to say that each process will be seen as a web service, and therefore we will be able to produce any kind
of metadata set from an unique portal, assuming the 3D data acquisition is done.
Where further works are concerned, the maintenance of the 3D data of the 3DCM is very challenging
as the city is a dynamic entity in constant evolution. This challenge could be addressed with semantic
model embedding the full history of the city allowing to represent all the changes that could occurs into
a 3DCM.
This project is funded by Région Bretagne et Région Pays de Loire (Oséo).
References
[1] Bénitez, S., Denis, E., Baillard, C. (2010): “Automated Production of Occlusion-Free Rectified
Façade Textures using Vehicle-based Imagery”, Photogrammetric Computer Vision and Image
Analysis, pp. 275.
[2] Meixner, M., Leberl, F. (2011): “3-Dimensional Building Details from Aerial Photography for
Internet Maps”, Remote Sensing 2011, pp. 721-751.
[3] Corre, Y., Lostanlen, Y. (2009): “Three-Dimensional Urban EM Wave Propagation Model for
Radio Network Planning and Optimization Over Large Areas”, IEEE Transactions on Vehicular
Technology, Vol. 58, No. 7, Sep. 2009, pp. 3112-3123.
[4] Caniot, G., Li, W., Dupont, G. (2011): “Validations and applications of a CFD tool dedicated to
wind assessment in urban areas”, 13th International Conference on Wind Engineering, 2011.
[5] Cherqui F., Groleau D., Wurtz E. et Allard F. (2005): “A step toward the global assessment
of district projects: solar indicators and way to quantify them”. Ninth International IBPSA
Conference, Montreìal, Canada, Organizing Committee Building Simulation 2005, 15–18 aout
2005, p. 167-174.
[6] PACIBA: Progiciels d’Aide à la Conception Intégrée des Bâtiments, AAP ANR 2006 - Programme
de Recherche sur l’Energie dans le Bâtiment (PREBAT).
[7] Miguet, F. & Groleau, D. (2007): “Urban bioclimatic indicators for urban planers with the sofware
tool SOLENE”. in: Luis, B., Manuel, P., Said, J., Ricardo, M. & Rogério, A., (editors). Portugal
02008-p.13
Usage, Usability, and Utility of 3D City Models
SB07 Sustainable Construction, materials and practices: challenges of the industry for the new
millenium, Lisbonne, 12-14. Amsterdam: IOS PRESS. p. 348-355.
[8] Király, G., Brolly, G. (2007): “Tree height estimation methods for terrestrial laser scanning
in a forest reserve”. International Archives of Photogrammetry, Remote Sensing and Spatial
Information Sciences, Vol. 3 (Part 3/W52), pp. 211-215.
[9] Liberge, S., Soheilian, B., Chehata, N., Paparoditis, N. (2010): “Extraction of vertical posts in
3D laser point clouds acquired in dense urban areas by a mobile mapping system”. International
Archives of Photogrammetry, Remote Sensing and Spatial Information Sciences, Vol. 38(Part 3B),
pp. 126-130.
02008-p.14

More Related Content

More from Stephane Meteodyn

Calibrating a CFD canopy model with the EC1 vertical profiles of mean wind sp...
Calibrating a CFD canopy model with the EC1 vertical profiles of mean wind sp...Calibrating a CFD canopy model with the EC1 vertical profiles of mean wind sp...
Calibrating a CFD canopy model with the EC1 vertical profiles of mean wind sp...
Stephane Meteodyn
 
A combined cfd network method for the natural air ventilation - icwe13
A combined cfd network method for the natural air ventilation - icwe13A combined cfd network method for the natural air ventilation - icwe13
A combined cfd network method for the natural air ventilation - icwe13
Stephane Meteodyn
 
UrbaWind, a Computational Fluid Dynamics tool to predict wind resource in urb...
UrbaWind, a Computational Fluid Dynamics tool to predict wind resource in urb...UrbaWind, a Computational Fluid Dynamics tool to predict wind resource in urb...
UrbaWind, a Computational Fluid Dynamics tool to predict wind resource in urb...
Stephane Meteodyn
 

More from Stephane Meteodyn (14)

Numerical tools dedicated to wind engineering Meteodyn
Numerical tools dedicated to wind engineering MeteodynNumerical tools dedicated to wind engineering Meteodyn
Numerical tools dedicated to wind engineering Meteodyn
 
WInd resource assessment in urban areas for sustainable development
WInd resource assessment in urban areas for sustainable developmentWInd resource assessment in urban areas for sustainable development
WInd resource assessment in urban areas for sustainable development
 
Wind-induced pressure coefficients on buildings dedicated to air change rate ...
Wind-induced pressure coefficients on buildings dedicated to air change rate ...Wind-induced pressure coefficients on buildings dedicated to air change rate ...
Wind-induced pressure coefficients on buildings dedicated to air change rate ...
 
Pedestrian wind comfort in urban area with numerical tools
Pedestrian wind comfort in urban area with numerical toolsPedestrian wind comfort in urban area with numerical tools
Pedestrian wind comfort in urban area with numerical tools
 
Urba wind planning and building design
Urba wind planning and building designUrba wind planning and building design
Urba wind planning and building design
 
Calibrating a CFD canopy model with the EC1 vertical profiles of mean wind sp...
Calibrating a CFD canopy model with the EC1 vertical profiles of mean wind sp...Calibrating a CFD canopy model with the EC1 vertical profiles of mean wind sp...
Calibrating a CFD canopy model with the EC1 vertical profiles of mean wind sp...
 
Validations and applications of a CFD tool dedicated to wind assessment in ur...
Validations and applications of a CFD tool dedicated to wind assessment in ur...Validations and applications of a CFD tool dedicated to wind assessment in ur...
Validations and applications of a CFD tool dedicated to wind assessment in ur...
 
Example of natural air ventilation using CFD modelling
Example of natural air ventilation using CFD modellingExample of natural air ventilation using CFD modelling
Example of natural air ventilation using CFD modelling
 
Example of Pedestrian Comfort & Safety study using CFD modelling software Urb...
Example of Pedestrian Comfort & Safety study using CFD modelling software Urb...Example of Pedestrian Comfort & Safety study using CFD modelling software Urb...
Example of Pedestrian Comfort & Safety study using CFD modelling software Urb...
 
Combined CFD-Mean energy balance methode to thermal comfort assessment of bui...
Combined CFD-Mean energy balance methode to thermal comfort assessment of bui...Combined CFD-Mean energy balance methode to thermal comfort assessment of bui...
Combined CFD-Mean energy balance methode to thermal comfort assessment of bui...
 
A combined cfd network method for the natural air ventilation - icwe13
A combined cfd network method for the natural air ventilation - icwe13A combined cfd network method for the natural air ventilation - icwe13
A combined cfd network method for the natural air ventilation - icwe13
 
Validations and applications of a CFD tool dedicated to wind assessment in ur...
Validations and applications of a CFD tool dedicated to wind assessment in ur...Validations and applications of a CFD tool dedicated to wind assessment in ur...
Validations and applications of a CFD tool dedicated to wind assessment in ur...
 
UrbaWind, a Computational Fluid Dynamics tool to predict wind resource in urb...
UrbaWind, a Computational Fluid Dynamics tool to predict wind resource in urb...UrbaWind, a Computational Fluid Dynamics tool to predict wind resource in urb...
UrbaWind, a Computational Fluid Dynamics tool to predict wind resource in urb...
 
Envie project 3_d_city_models_urban_micro_climate
Envie project 3_d_city_models_urban_micro_climateEnvie project 3_d_city_models_urban_micro_climate
Envie project 3_d_city_models_urban_micro_climate
 

Recently uploaded

Artificial Intelligence: Facts and Myths
Artificial Intelligence: Facts and MythsArtificial Intelligence: Facts and Myths
Artificial Intelligence: Facts and Myths
Joaquim Jorge
 
+971581248768>> SAFE AND ORIGINAL ABORTION PILLS FOR SALE IN DUBAI AND ABUDHA...
+971581248768>> SAFE AND ORIGINAL ABORTION PILLS FOR SALE IN DUBAI AND ABUDHA...+971581248768>> SAFE AND ORIGINAL ABORTION PILLS FOR SALE IN DUBAI AND ABUDHA...
+971581248768>> SAFE AND ORIGINAL ABORTION PILLS FOR SALE IN DUBAI AND ABUDHA...
?#DUbAI#??##{{(☎️+971_581248768%)**%*]'#abortion pills for sale in dubai@
 
Cloud Frontiers: A Deep Dive into Serverless Spatial Data and FME
Cloud Frontiers:  A Deep Dive into Serverless Spatial Data and FMECloud Frontiers:  A Deep Dive into Serverless Spatial Data and FME
Cloud Frontiers: A Deep Dive into Serverless Spatial Data and FME
Safe Software
 

Recently uploaded (20)

Top 5 Benefits OF Using Muvi Live Paywall For Live Streams
Top 5 Benefits OF Using Muvi Live Paywall For Live StreamsTop 5 Benefits OF Using Muvi Live Paywall For Live Streams
Top 5 Benefits OF Using Muvi Live Paywall For Live Streams
 
Top 10 Most Downloaded Games on Play Store in 2024
Top 10 Most Downloaded Games on Play Store in 2024Top 10 Most Downloaded Games on Play Store in 2024
Top 10 Most Downloaded Games on Play Store in 2024
 
Artificial Intelligence: Facts and Myths
Artificial Intelligence: Facts and MythsArtificial Intelligence: Facts and Myths
Artificial Intelligence: Facts and Myths
 
Partners Life - Insurer Innovation Award 2024
Partners Life - Insurer Innovation Award 2024Partners Life - Insurer Innovation Award 2024
Partners Life - Insurer Innovation Award 2024
 
🐬 The future of MySQL is Postgres 🐘
🐬  The future of MySQL is Postgres   🐘🐬  The future of MySQL is Postgres   🐘
🐬 The future of MySQL is Postgres 🐘
 
From Event to Action: Accelerate Your Decision Making with Real-Time Automation
From Event to Action: Accelerate Your Decision Making with Real-Time AutomationFrom Event to Action: Accelerate Your Decision Making with Real-Time Automation
From Event to Action: Accelerate Your Decision Making with Real-Time Automation
 
Boost PC performance: How more available memory can improve productivity
Boost PC performance: How more available memory can improve productivityBoost PC performance: How more available memory can improve productivity
Boost PC performance: How more available memory can improve productivity
 
MINDCTI Revenue Release Quarter One 2024
MINDCTI Revenue Release Quarter One 2024MINDCTI Revenue Release Quarter One 2024
MINDCTI Revenue Release Quarter One 2024
 
Powerful Google developer tools for immediate impact! (2023-24 C)
Powerful Google developer tools for immediate impact! (2023-24 C)Powerful Google developer tools for immediate impact! (2023-24 C)
Powerful Google developer tools for immediate impact! (2023-24 C)
 
Data Cloud, More than a CDP by Matt Robison
Data Cloud, More than a CDP by Matt RobisonData Cloud, More than a CDP by Matt Robison
Data Cloud, More than a CDP by Matt Robison
 
Automating Google Workspace (GWS) & more with Apps Script
Automating Google Workspace (GWS) & more with Apps ScriptAutomating Google Workspace (GWS) & more with Apps Script
Automating Google Workspace (GWS) & more with Apps Script
 
+971581248768>> SAFE AND ORIGINAL ABORTION PILLS FOR SALE IN DUBAI AND ABUDHA...
+971581248768>> SAFE AND ORIGINAL ABORTION PILLS FOR SALE IN DUBAI AND ABUDHA...+971581248768>> SAFE AND ORIGINAL ABORTION PILLS FOR SALE IN DUBAI AND ABUDHA...
+971581248768>> SAFE AND ORIGINAL ABORTION PILLS FOR SALE IN DUBAI AND ABUDHA...
 
Workshop - Best of Both Worlds_ Combine KG and Vector search for enhanced R...
Workshop - Best of Both Worlds_ Combine  KG and Vector search for  enhanced R...Workshop - Best of Both Worlds_ Combine  KG and Vector search for  enhanced R...
Workshop - Best of Both Worlds_ Combine KG and Vector search for enhanced R...
 
Scaling API-first – The story of a global engineering organization
Scaling API-first – The story of a global engineering organizationScaling API-first – The story of a global engineering organization
Scaling API-first – The story of a global engineering organization
 
Real Time Object Detection Using Open CV
Real Time Object Detection Using Open CVReal Time Object Detection Using Open CV
Real Time Object Detection Using Open CV
 
TrustArc Webinar - Unlock the Power of AI-Driven Data Discovery
TrustArc Webinar - Unlock the Power of AI-Driven Data DiscoveryTrustArc Webinar - Unlock the Power of AI-Driven Data Discovery
TrustArc Webinar - Unlock the Power of AI-Driven Data Discovery
 
Apidays New York 2024 - The value of a flexible API Management solution for O...
Apidays New York 2024 - The value of a flexible API Management solution for O...Apidays New York 2024 - The value of a flexible API Management solution for O...
Apidays New York 2024 - The value of a flexible API Management solution for O...
 
Cloud Frontiers: A Deep Dive into Serverless Spatial Data and FME
Cloud Frontiers:  A Deep Dive into Serverless Spatial Data and FMECloud Frontiers:  A Deep Dive into Serverless Spatial Data and FME
Cloud Frontiers: A Deep Dive into Serverless Spatial Data and FME
 
Artificial Intelligence Chap.5 : Uncertainty
Artificial Intelligence Chap.5 : UncertaintyArtificial Intelligence Chap.5 : Uncertainty
Artificial Intelligence Chap.5 : Uncertainty
 
Manulife - Insurer Innovation Award 2024
Manulife - Insurer Innovation Award 2024Manulife - Insurer Innovation Award 2024
Manulife - Insurer Innovation Award 2024
 

En vie project_framework_to_produce_urban_data_at_large_scale

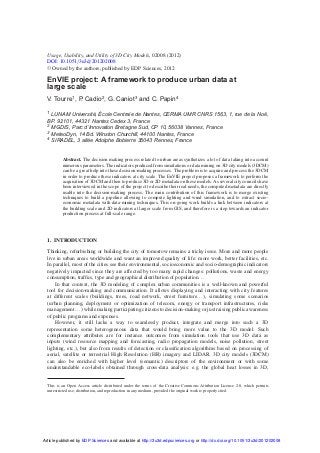
  • 1. Usage, Usability, and Utility of 3D City Models, 02008 (2012) DOI: 10.1051/3u3d/201202008 C Owned by the authors, published by EDP Sciences, 2012 EnVIE project: A framework to produce urban data at large scale V. Tourre1 , P. Cadio2 , G. Caniot3 and C. Papin4 1 LUNAM Université, École Centrale de Nantes, CERMA UMR CNRS 1563, 1, rue de la Noë, BP. 92101, 44321 Nantes Cedex 3, France 2 MGDIS, Parc d’Innovation Bretagne Sud, CP 10, 56038 Vannes, France 3 MeteoDyn, 14 Bd. Winston Churchill, 44100 Nantes, France 4 SIRADEL, 3 allée Adolphe Bobierre 35043 Rennes, France Abstract. The decision making process related to urban areas synthetizes a lot of data taking into account numerous parameters. The indicators produced from simulations or data mining on 3D city models (3DCM) can be a great help into these decision-making processes. The problem is to acquire and process the 3DCM in order to produce these indicators at city scale. The EnVIE project proposes a framework to perform the acquisition of 3DCM and then to produce 3D or 2D metadata on these models. As several city councils have been interviewed in the scope of the project to describe their real needs, the computed metadata are directly usable into the decision-making process. The main contribution of this framework is to merge existing techniques to build a pipeline allowing to compute lighting and wind simulation, and to extract socio- economic metadata with data-mining techniques. This on-going work builds a link between indicators at the building scale and 2D indicators at larger scale from GIS, and therefore is a step towards an indicator production process at full-scale range. 1. INTRODUCTION Thinking, refurbishing or building the city of tomorrow remains a tricky issue. More and more people live in urban areas worldwide and want an improved quality of life: more work, better facilities, etc. In parallel, most of the cities see their environmental, socioeconomic and socio-demographic indicators negatively impacted since they are affected by too many rapid changes: pollutions, waste and energy consumption, traffics, type and geographical distribution of population. . . In that context, the 3D modeling of complex urban communities is a well-known and powerful tool for decision-making and communication. It allows displaying and interacting with city features at different scales (buildings, trees, road network, street furniture. . . ), simulating some scenarios (urban planning, deployment or optimization of telecom, energy or transport infrastructures, risks management. . . ) while making participating citizens to decision-making or just raising public awareness of public programs and expenses. However, it still lacks a way to seamlessly product, integrate and merge into such a 3D representation some heterogeneous data that would bring more value to the 3D model. Such complementary attributes are for instance outcomes from simulation tools that use 3D data as inputs (wind resource mapping and forecasting, radio propagation models, noise pollution, street lighting, etc.), but also from results of detection or classification algorithms based on processing of aerial, satellite or terrestrial High Resolution (HR) imagery and LIDAR. 3D city models (3DCM) can also be enriched with higher level (semantic) descriptors of the environment or with some understandable eco-labels obtained through cross-data analysis: e.g. the global heat losses in 3D, This is an Open Access article distributed under the terms of the Creative Commons Attribution License 2.0, which permits unrestricted use, distribution, and reproduction in any medium, provided the original work is properly cited. Article published by EDP Sciences and available at http://3u3d.edpsciences.org or http://dx.doi.org/10.1051/3u3d/201202008
  • 2. Usage, Usability, and Utility of 3D City Models Figure 1. Illustrations of some topics addressed as part of the EnVIE project: at top, potential energy (sun exposure, wind), at bottom, heat losses combined with socioeconomic data and environmental quality indicators. i.e. a unique tag encompassing both losses at the roof and façades levels (aerial and terrestrial thermal imaging), but also taking into account the building superstructures so as to refine the analysis. Another class of high level descriptors attempts to qualify and rank the human perception and acceptability of his surrounding environment (comfort or stress). It is based on the combined use of features from 3D geometry (visibility, pavement width, building height. . . ) and additional inputs like the presence of trees, the wind and temperature fields, lighting, the noise pollution or others. The next step consists in combining those outcomes with some socioeconomic and demographic attributes (land registry, census data or from geo-marketing data mining. . . ). This ultimate goal is straight addressed by the EnVIE project (“Enrichment of digital 3D cities with environmental eco-indicators”). This 2-years long project started in 2011 and addresses the four following topics: • 3D modeling of urban areas. • Potential energy (contributions and losses). • Environmental quality (human perception of comfort). • Economic and social situation. All these individual outcomes are merged and finally integrated into the 3D model to offer much more possibilities to analyze and understand the city. This will result in an enriched 3DCM allowing multi- scale and multi-criteria representation and analysis for decision-making and communication purposes. A working group that encompasses different urban communities and cities (Rennes Métropole, Nantes Métropole, Sant-Grégoire and Cesson-Sévigné) has been established at the project start. It allowed the EnVIE Consortium to gather a wide range of expressed needs from various technical services (GIS, Environment...) and elected representatives. This paper describes in section 2 the state of the art before introducing the overall EnVIE framework in section 3. The first results are illustrated in section 4 and discussed in section 5. Finally, section 6 concludes. 02008-p.2
  • 3. European COST Action TU0801 2. PREVIOUS WORKS 2.1 3D model acquisition Many markets ask for more immersivity and 3D city models gains always more traction. 3D models can also be used as a powerful interface to aggregate and display multiples levels of information. This requires an accurate building modeling, texture mapping (aerial or terrestrial images or results from scientific computations), insertion of various additional 3D objects, but also managing data complexity, structure and source-channel coding for enabling real-time navigation whatever the network and the rendering device is. In particular, more and more stakeholders ask for navigation at the street level and not only a simple bird’s eyes view (communication, virtual tourism, Location-Based B2B or B2C Services...) associated with the need of both data fidelity and a strong feeling of realism. 3D city models can be obtained by means of photogrammetry from aerial or satellite stereo images. 3D vectors or 3D coordinates of key points characterizing roofs, terrain or some infrastructures like roads are determined. For more realism, the Digital Terrain Model (DTM) as well as the roofs and the building’s façades can be mapped with image textures. When pedestrian navigation is targeted, aerial imagery becomes not enough to achieve realistic façade texturing. A new type of acquisition systems is gaining traction: the Mobile Mapping Systems (MMS). MMS has been evolving quickly and can embed highly accurate multi-sensor platforms, equipped for instance with GPS/IMU/DMI localization systems, high-resolution RGB cameras, terrestrial LIDAR... As an example, the production chain of the SIRADEL’s MMS [1] includes 3 successive stages: 3D model registration using laser data, occlusion detection using both laser and imagery sensors, and finally image merging. Figure 2 shows the MMS system once deployed over the vehicle roof. The simplest class of 3D building models consists of grey walls and flat roofs extruded from 2D building outlines. They are quite simple to handle at a wide scale and are well-suited for GIS-oriented applications or simulation purposes (e.g. Computational Fluid Dynamics or CFD, radio propagation...). More realism can be achieved both in geometry (roof superstructures, recesses in building façades, balconies...), and through texture mapping. Figure 2 shows that roofs can be modeled very accurately from high resolution aerial pictures (5 cm in the example at middle). This is of importance for instance when evaluating the potential energy of solar panel. The second step consisted in projecting aerial ortho- imagery onto the roof. The use of aerial imagery is still relevant for façade texturing since resolution is getting better (ground point size less than 10 cm is now quite common, cf. Figure 2 below from 5 cm images). Generic (geo-typical) textures or aerial oblique (or not if overlapping between images is high) imagery can be used. But even whether the image resolution has getting better over the years, only using aerial images to texture façades appears to be not enough and perspective discrepancies at the street level are visually unpleasant. A terrestrial image-based approach has to be preferred, especially for street view navigation or monitoring. As regards geometry, some past studies proposed algorithms for automatic computation of generic roofs based on Digital Elevation Model (DEM). More recently, façade segmentation and window detection techniques based on oblique aerial images have been proposed to improve the façade rendering, like in [2]. However, due to perspective and image resolution, this does not appear relevant for ensuring an accurate detection and extraction of objects that are not located in the plane of the façade, like balcony. Again, a terrestrial approach should be privileged. 2.2 Large scale simulation Authors in [3] proposed a method for planning and optimization of new wideband radio networks over large geographical areas with deterministic tools. They presented a fast and robust propagation model that computes 3-D ray contributions using 3-D urban model. Experiments were conducted on an area of 64 km2 . 02008-p.3
  • 4. Usage, Usability, and Utility of 3D City Models Figure 2. Limitations when texturing façades from aerial imagery. On the left: comparison between a façade textured with terrestrial images (see section 2.1) at the left side and aerial pictures −15 cm- on the right (city of Rennes). At middle: accurate roof modeling and texturing from 5 cm images (data is property of the city of Nîmes, France). At right: SIRADEL’s MMS. Figure 3. Wind Comfort map before urban renewal. Meteodyn [4] has a broad experience in wind and solar simulation over a large domain. For example, wind comfort and insulation frequency was computed in Saint-Brieuc district: 2.3 Indicator production In order to aid the decision making process, the results of the preceding simulations have to be translated into understandable indicators for the urban community managers. The ADEQUA [5] project have proposed a methodology to aid the decision making process during the building or the renewing of a residential area. The goal is to clearly present various indicators in order to show the complexity and the underlying mechanisms of the sustainable development. Following the same sustainable approach, the PACIBA project [6] presents a methodology and software in order to handle the early stages of conceptual design. Several physical phenomena are taken into account to preview what could be the energetic qualities of a small city area. 02008-p.4
  • 5. European COST Action TU0801 Figure 4. Wind Comfort map after urban renewal. Figure 5. Annual Insulation Frequency before urban renewal. Figure 6. Annual Insulation Frequency after urban renewal. 02008-p.5
  • 6. Usage, Usability, and Utility of 3D City Models Figure 7. Overall EnVIE workflow. 3. FRAMEWORK 3.1 3D city modeling The 3D city model is the common base on which all EnVIE metadata has been aggregated. For partners, 3DCM is used in different ways: extracting descriptors of the city environment, input data for simulation or 3D container allowing displaying multiple data. For end-users, when combined with real-time 3D navigation capabilities, it enables benefiting from a smart user interface for interactive access to eco- labels. The 3D city model encompasses the terrain, the buildings (in LOD1), the vegetation, the street furniture and some administrative borders. SIRADEL produced distinct city models from two representative areas, located respectively in Rennes and in Saint-Grégoire. These 2 samples are large enough to validate different use cases and are complementary in terms of contents (residential area, houses, tower blocks. . . ) As an example, the Figure below illustrates different levels of city modeling. 3.2 Data exchange The interoperability problem is to exchange geometric data, to add metadata related to this geometric data, and then to exchange this metadata. So on one side, we have to send 2D or 3D geometric data to perform simulations and analysis, and on the other side, we have to keep semantic attributes in order to build a hierarchic structure of the city model. We have chosen to have two distinct data processes depending on the metadata dimensions, and two distinct files. 3.3 3D metadata – simulation The STL format is highly recognized for several simulators and has been chosen as the simulation format. The CityGML format adds a semantic level and hierarchic structure needed for using the metadata. We add a linking file to explicitly describe the relationship between STL triangle patches and CityGML entities; in order to retrieve the CityGML entities triangle patches belongs to. This linking file is a kind of “CityGML light” format containing a simple 3D geometric hierarchic structure, each entity embedding the set of STL triangle patch identifier and the CityGML entity identifier. Therefore the STL file can be used to perform simulations onto the 3DCM and produce metadata over each triangle patches. Then, thanks to the linking file, the computed metadata can be associated to the corresponding CityGML entity. 02008-p.6
  • 7. European COST Action TU0801 Figure 8. Different level of city modeling. At top, San Francisco, one of the thousands of cities in LOD11 produced by SIRADEL all around the world. At bottom-left, realistic 3D model of Rennes (France) in LOD2 and LOD3 with terrestrial texture acquired by a Mobile Mapping System (MMS) from SIRADEL. At bottom-right, 3D landmark and enrichment with street furniture. 3.3.1 Metadata related to lighting and energy Wind characteristics and solar energy are computed using simulation software called Urbawind. Thanks to its powerful CFD (Computational Fluid Dynamics) solver, wind characteristics such as wind speed, wind direction and wind energy can be assessed over a large domain such as a district. In order to compute direct solar energy for a very large domain, an optimized structure of the geometric objects (thanks to Bounding Volume Hierarchy) combined with fast computation on GPU (Graphical Processor Unit) gives us a shadow map for a sun position. By summing over a period, a frequency of shadow (or light) can be assessed. Solar energy from direct lighting can be computed from summing all beans taking into account energy a beam at each time step. From the CAD file in STL format, wind and solar results are computed over roofs, façades and streets. Thanks to “CityGML light” format, as described below, the energy and lighting metadata related to CityGML entity can be sorted it out. 3.3.2 Metadata related to pedestrian perception The STL data is converted into the specific data format needed by Solene. Solene is a lighting and thermic simulator based on radiosity, and able to handle visibility and comfort problems [7]. In the EnVIE project, the Solene simulator is used to compute indirect lighting used in lighting and energy metadata, but also the pedestrian visibility of specific buildings or vegetation, and the pedestrian thermic comfort. 1 LOD: Level of Detail. 02008-p.7
  • 8. Usage, Usability, and Utility of 3D City Models The challenge of these metadata based on the pedestrian perception is describing a local perception represented in a 3D scene. A local perception is situated in space; this is the easy part to represent on a map or in a 3D scene, but also in time. The pedestrian perception depends on what the pedestrian has done before, and sometimes, on what he will do later or what he has planed to do. As the time dimension is difficult to take into account without any walkway or path clues, in this paper we focus on the visibility of specific building, because this indicator is less biased without the time dimension. 3.4 2D metadata – City inhabitants The aim of this project is to provide socio-demographic data within spatial environmental data. MGDIS applies their expertise in the value-addition on public data. Starting from public information made available by institutions (INSEE, Government-owned agencies, etc.), MGDIS is able to compute populations from areas, and to localize the profiles of people in their residence. The advantage of this approach is to provide a detailed knowledge of population and housing currently present in the territory, in order to facilitate interpretation and diagnostic. This also enables an organization to identify possible actions toward population in the concerned living areas. For example, a tenant is not supposed to be contacted by a city for additional ecological equipment. 3.4.1 Buildings identification from the 3D representation The development of a parcel layer (data from the cadastre) is necessary to precisely locate 3D buildings in the city. This parcel identification allows the linking of a 3D representation of the building with cadastral information listed by the municipality. From this information, a profile of inhabiting is determined and thus allows identifying a population potentially present in the living area. The algorithm consists in matching the map of parcels (land register), used to identify housing, with the actual map of the buildings, taking into account the constraints linked to the 3D representation of the city (joint ownership of buildings, etc.). 3.4.2 The granularity of information Socio-demographic data can then be piled on this new 3D base map, which respects the city morphology and its cadastral representation. To this date, providers of public data in France, such as INSEE, must respect the constraints of privacy edited by the national numeric privacy agency (CNIL), and publish aggregate data on the level of a territory. The finest geographical level published by INSEE is the IRIS, an infra-municipal territory representing a population of roughly 2,000 inhabitants, for municipalities with more than 10 000 inhabitants. For municipalities with fewer than 10 000 inhabitants, the level is the basic geographic Township. In order to refine the result and correctly affect the inhabitants in the 3D city, information must be analyzed some more to obtain a given granularity. This granularity of information is obtained from algorithms developed by MGDIS, allowing the correspondence between the cadastral information at the address, and demographic information in IRIS. In the end, this allows the identification of populations present on that territory, together with the type of housing, and indicates to the user the level of robustness in the results. 4. FIRST RESULTS This section illustrates some preliminary outcomes. Data integration in the final system is not taken into account at this rate. 02008-p.8
  • 9. European COST Action TU0801 Figure 9. (left) Hedge extraction in a laser point cloud. Low vegetation points are represented in green and final hedges are in red, (right) Tree extraction in a laser point cloud. Green shows the top of the detected trees. 4.1 Vegetation detection Detection and classification of the vegetation are commonly achieved using aerial imagery: e.g. near- infrared imagery for detection and DEM for classification (high vegetation or low vegetation). For some objects, a terrestrial-based approach can be relevant as well. For example, trunks of trees are not visible from aerial views. In general, the tree location is assigned to the middle of the canopy and not to the middle of the trunk. SIRADEL implemented a tree and hedges detection method from input data acquired on ground. Regarding hedge, “green areas” are first detected from terrestrial images. Then, hedges are geometrically extracted from the terrestrial laser points. The main issue in this step is to select only vegetation pixels from winter images, where branch and shadow colors are quite similar. The second stage consists in analyzing the geometrical characteristics of each individual hedge. Results are shown in Figure 9 (left). The most common way to detect trees in terrestrial laser data is to extract their trunks by finding cylinders in the laser points [8, 9]. However, trunks are often hidden behind hedges in residential areas. Our method includes a first filtering of potential tree points by analyzing a point projection image onto the ground. Results are shown in Figure 9 (right). A terrestrial approach, when considered alone, is not enough but can complement well another processing. Aerial detection can be considered as a global method, while terrestrial detection helps improving accuracy in terms of position and dimension, at least when the object is visible from the street. 4.2 Thermal imagery The MMS can provide a lot of information about the environment, especially thanks to additional sensors. This represents a unique capability to collect a wide amount of data from the ground. This allows adding knowledge into the 3D database. We focus here on thermal imagery. As well, these inputs will be combined with aerial imagery or simulation tools in order to derive eco-indicators (like insulation fault) that are embedded into the 3D city model. 4.3 Lighting and Wind data The computed insulation frequency is displayed here using Red color as the maximum and Purple color as the minimum of insulation frequency for Saint-Grégoire neighborhood (Figures 10 and 11). Wind characteristics are also accessible here in a 2D plan. Results are shown figures 12 and 13. 02008-p.9
  • 10. Usage, Usability, and Utility of 3D City Models Figure 10. Daily Insulation frequency on the streets of Saint-Grégoire. Figure 11. Daily Insulation frequency on building’s facades of Saint-Grégoire. 4.4 Interviews A working group that encompasses different urban communities and cities (Rennes Métropole, Nantes Métropole, Saint-Grégoire and Cesson-Sévigné) has been established at the beginning of the project. It allowed us to gather a wide range of expressed needs from various technical services (SIG, Environment...) and elected representatives. A questionnaire has been sent to these end-users. It included three distinct parts: the first part provided a set of eco-indicators that could be derived and explored as part of EnVIE, with the possibility to rank each of them according to 5 levels. The second part proposed some combinations of eco- indicators given specific uses. A ranking of such different use cases and combinations was also asked for. The last part of the questionnaire was an open section in order to freely express any kind of comments. As regards to the eco-indicators themselves, heat losses, the distance to services and urban climate comfort have been aroused the most interest. Some particular use cases were also preferred by the end- users. For instance, let us mention the analysis of the daily commute between home and work, local energy policy or the qualification of existing or new districts. All end-users favor smart but simple tools, easy-to-use and business-oriented. 02008-p.10
  • 11. European COST Action TU0801 Figure 12. Directional Wind velocity on 2D Horizontal Plan on the streets of Saint-Grégoire. Figure 13. Directional Wind velocity on 2D Vertical Plan on the streets of Saint-Grégoire. 4.5 First 2D metadata computations MGDIS currently works with communities by providing all the information needed for analysis and diagnosis of territories, starting from the data of institutions (INSEE, local authorities...). This data is structured and given added value by MGDIS, making them usable and understandable for elected members working in the definition of public policies. Data extractions from this heap of public data identify the description of housing and population, by geographical level, as well as the IRIS (infra-communal INSEE) and policy-related territories (Agglomerations, departments, regions ...). Following this approach, MGDIS has been working on algorithms in order to determine the population potentially present in housing. The example above is used to indicate that an apartment of 50 m2 , built before 1949 in Vannes (intramural), identified on the 3D map (cadastre and 3D representation), has a probability of 64% of using an electricity-based heating. 02008-p.11
  • 12. Usage, Usability, and Utility of 3D City Models Figure 14. Screenshot of the MGDIS solution, enabling population localization from housing type. Figure 15. Screenshot of the MGDIS solution, enabling population localization from housing type. 5. DISCUSSION At present, software solutions for communities help elected agents to define public policies by informing them about strengths and weaknesses in the territory. Through project EnVIE, fine-grained public data, together with a 3D representation of the territory and environmental constraints, allow precise actions to be taken, in order to reach goals defined in the community leading plan. The EnVIE project aims at assisting institutional decision makers in framing and defining policies. Data collected by each partner will enable decision makers to conduct public policy for sustainable development, consistent with the needs of the population: • Analysis of health risks: from environmental information (wind, sun exposure, building insulation) and demographic information (ages, isolation of the elderly...), elected members can identify 02008-p.12
  • 13. European COST Action TU0801 risk areas and thus get closer to population during unexpected weather events (heat waves/cold weather). • Energy efficiency: communities can identify buildings with low energy performance and help people equip themselves, with the goals of reducing the energy bill of the population and meeting the challenges defined in their sustainable development policy. • Social mix: from this information, policymakers can foster communities in creating social mix of neighborhoods, thus maintaining a balance between all categories of people and all housing types. 6. CONCLUSION The EnVIE project merges several techniques in order to produce critical indicators intended to be used into decision-making processes. A semi-automatic 3D acquisition technique produces a geometric 3DCM in CityGML format. This model is used to compute 3D metadata related to wind, lighting and thermic phenomenon. Data mining techniques are used to produce 2D metadata related socio- economic data. The geometric model and the metadata are merged into a full 3DCM in order to build clear indicators. The main contribution of this project is to setup a full process from acquisition to visualization, and to mix metadata of various types. All the processes have now to be automated through web services between projects partners. That is to say that each process will be seen as a web service, and therefore we will be able to produce any kind of metadata set from an unique portal, assuming the 3D data acquisition is done. Where further works are concerned, the maintenance of the 3D data of the 3DCM is very challenging as the city is a dynamic entity in constant evolution. This challenge could be addressed with semantic model embedding the full history of the city allowing to represent all the changes that could occurs into a 3DCM. This project is funded by Région Bretagne et Région Pays de Loire (Oséo). References [1] Bénitez, S., Denis, E., Baillard, C. (2010): “Automated Production of Occlusion-Free Rectified Façade Textures using Vehicle-based Imagery”, Photogrammetric Computer Vision and Image Analysis, pp. 275. [2] Meixner, M., Leberl, F. (2011): “3-Dimensional Building Details from Aerial Photography for Internet Maps”, Remote Sensing 2011, pp. 721-751. [3] Corre, Y., Lostanlen, Y. (2009): “Three-Dimensional Urban EM Wave Propagation Model for Radio Network Planning and Optimization Over Large Areas”, IEEE Transactions on Vehicular Technology, Vol. 58, No. 7, Sep. 2009, pp. 3112-3123. [4] Caniot, G., Li, W., Dupont, G. (2011): “Validations and applications of a CFD tool dedicated to wind assessment in urban areas”, 13th International Conference on Wind Engineering, 2011. [5] Cherqui F., Groleau D., Wurtz E. et Allard F. (2005): “A step toward the global assessment of district projects: solar indicators and way to quantify them”. Ninth International IBPSA Conference, Montreìal, Canada, Organizing Committee Building Simulation 2005, 15–18 aout 2005, p. 167-174. [6] PACIBA: Progiciels d’Aide à la Conception Intégrée des Bâtiments, AAP ANR 2006 - Programme de Recherche sur l’Energie dans le Bâtiment (PREBAT). [7] Miguet, F. & Groleau, D. (2007): “Urban bioclimatic indicators for urban planers with the sofware tool SOLENE”. in: Luis, B., Manuel, P., Said, J., Ricardo, M. & Rogério, A., (editors). Portugal 02008-p.13
  • 14. Usage, Usability, and Utility of 3D City Models SB07 Sustainable Construction, materials and practices: challenges of the industry for the new millenium, Lisbonne, 12-14. Amsterdam: IOS PRESS. p. 348-355. [8] Király, G., Brolly, G. (2007): “Tree height estimation methods for terrestrial laser scanning in a forest reserve”. International Archives of Photogrammetry, Remote Sensing and Spatial Information Sciences, Vol. 3 (Part 3/W52), pp. 211-215. [9] Liberge, S., Soheilian, B., Chehata, N., Paparoditis, N. (2010): “Extraction of vertical posts in 3D laser point clouds acquired in dense urban areas by a mobile mapping system”. International Archives of Photogrammetry, Remote Sensing and Spatial Information Sciences, Vol. 38(Part 3B), pp. 126-130. 02008-p.14