1) In 2014, 22% of Israelis lived in poverty, including 31% of children. 19% of families lived in poverty.
2) Poverty rates were highest among Arab families, Haredi families, families with 4 or more children, and families with an unemployed head. These groups experienced poverty rates much higher than the national average.
3) Arab families and Haredi families made up a larger percentage of poor families than their percentage of the overall population, showing they were overrepresented among poor families.
Call On 6297143586 Yerwada Call Girls In All Pune 24/7 Provide Call With Bes...
Poverty in Israel 2015 Facts and Figures
1. MJB Data Snapshot: Poverty in Israel (December 2015)
Source: All information in this document comes from the 2014 Annual Report on Poverty and
Social Gaps, of the National Insurance Institute of Israel (Social Security Administration),
Research and Planning Administration.
Rates of Poverty
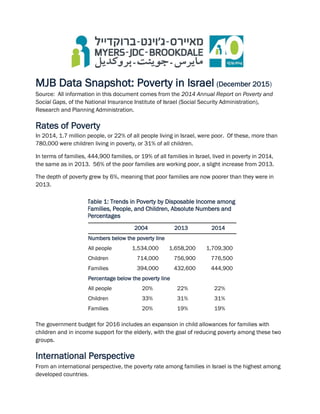
In 2014, 1.7 million people, or 22% of all people living in Israel, were poor. Of these, more than
780,000 were children living in poverty, or 31% of all children.
In terms of families, 444,900 families, or 19% of all families in Israel, lived in poverty in 2014,
the same as in 2013. 56% of the poor families are working poor, a slight increase from 2013.
The depth of poverty grew by 6%, meaning that poor families are now poorer than they were in
2013.
Table 1: Trends in Poverty by Disposable Income among
Families, People, and Children, Absolute Numbers and
Percentages
2004 2013 2014
Numbers below the poverty line
All people 1,534,000 1,658,200 1,709,300
Children 714,000 756,900 776,500
Families 394,000 432,600 444,900
Percentage below the poverty line
All people 20% 22% 22%
Children 33% 31% 31%
Families 20% 19% 19%
The government budget for 2016 includes an expansion in child allowances for families with
children and in income support for the elderly, with the goal of reducing poverty among these two
groups.
International Perspective
From an international perspective, the poverty rate among families in Israel is the highest among
developed countries.
2. 2
The Poverty Line
In Israel, the poverty line is defined as 50% of the disposable median income (including transfer
payments and after deduction of taxes), adjusted to family size.
In 2014, the monthly poverty line for a couple was 4,923 NIS or US$1,277 (exchange rate in
December 2014: $1=3.90 NIS).
The monthly poverty rate for a couple with two children was 7,876 NIS or US$2,043.
Table 2 below shows the percentage of poor families in the overall population according to
different family types.
Table 2: The Percentage of Families below the Poverty Line According To
Different Family Types, 2014
* Defined according to their last institution of education.
** Age 60+ for women and age 65+ for men.
Of note:
Poverty rates are highest among Arab families, Haredi families, families with 4+ children, and
families with an unemployed head of family — all much higher than the national average. The
high rates of poverty among Arab and Haredi families are related to the large family sizes, lower
rates of employment and lower wages among the employed.
Poverty rates for elderly families and single-parent families are somewhat higher than the
national average.
Poverty rates for Jewish families and families with an employed head of families are below the
national poverty rate.
68%
13%
53%
18%
25%
23%
18%
52%
53%
14%
19%
0% 20% 40% 60% 80%
Unemployed of working age
Employed
4+ children
1-3 children
Single parent
Elderly**
Immigrants (since 1990)
Haredim*
Arabs
Jews
Overall
3. 3
The Representation of Subgroups within the Poor Population
Table 3 indicates the share of each type of family among the poor population. The level of
representation of each group is determined not only by their rate of poverty but also by the size
of the group in the overall population.
Although all major population groups are significantly represented among the poor, some groups
are overrepresented — meaning that their percentage within all poor families is higher than their
percentage in the overall population.
Table 3: The Representation of Different Family Types among the Poor in Comparison to
their Representation among All Families, 2014
Population Group % of all families % of all poor families # of poor families
Jews 87% 63% 278,500
Arabs 13% 37% 166,400
Haredim* 4% 11% 47,800
Immigrants (since 1990) 20% 19% 84,600
Elderly** 21% 26% 116,000
Single parent 5% 7% 31,700
1-3 children 38% 36% 160,800
4+ children 7% 20% 87,400
Employed 80% 56% 247,800
Unemployed of working age 5% 20% 87,500
* Defined according to their last institution of education.
** Age 60+ for women and age 65+ for men
Of note:
Arab families, Haredi families, the elderly, families with 4+ children, and families with an
unemployed head of family are all overrepresented among the population living in poverty.
By contrast, Jewish families and families with an employed head of family are
underrepresented among the population living in poverty.