SlideShare a Scribd company logo
1 of 96
Download to read offline
GROWTH ASSESSMENT
Dr. Mohan.T.Shenoy
DM Resident in Endocrinology
Amrita Institute of Medical Sciences
Objectives of this study module






Why should we assess growth?
What are the parameters ?
How to interpret ?
When to measure?
Clinical implications
INTRODUCTION


Growth and development are sometimes used interchangeably.



Growth is defined as net increase in the size or mass of tissues. It is largely due
to multiplication of cells,increase in the intracellular substance (quantitative )



Development is defined as maturation of functions and acquisition of skills.
(qualitative growth)






Early childhood : Cognitive growth and development difficult to differentiate from
neurologic and behavioural maturation.
Later childhood, it can be measured by communicative skills and cognitive abilities
influenced by the physical, emotional and social environment.

Myelination of the nervous system and denotes acquistion of a variety of
competences for optimal functioning of the individual.
The ICP growth model for height for boys
(Karlberg, 1989)
Changes in bodily proportions with age

Predictable Sequence
-Cephalo-caudal (head down to toes)
- Proximodistal (center of the body to peripheral)
- General to specific
Principles of Growth
1. Continous process from conception onward
Orderly - definite time limits for growth. Any time lost during a
rapid growth period may prevent catch-up growth.
2. Unique for each individual - genetic and environment factors
3. Growth is governed by complex chain of hormonal interactions. The
growth in the first year is mainly controlled by inherent potential of
the cells and later by several factors (environmental and genetic).
4. First 3 years of life, curvilinear pattern ; Later it is linear.
Principles of Growth


5. Growth spurts occur in late foetal period ; pubertal period.

It is a dynamic process





Phase I – Hyperplasia
Phase II - Hyperplasia + Hypertrophy
Phase III - Hypertrophy alone
Phase IV – Maturity

•

6. Growth does not follow normal distribution curve.

•

7. Each stage of G&D is affected by the preceding types of
development ;
Differential growth

•

Each child grows in his/her own
unique way.

•

Not all body parts grow in the same
rate at the same time



CNS : Neuronal division essentially
complete by 1 year,



Bone, Muscle, and Fat cells continue
to divide until later in childhood.



Other - Skin, gastrointestinal
epithelial cells, and liver retain the
capacity for hyperplasia throughout
life.

•

Don’t progress at the same rate
(↑ periods of GR in early childhood
and adolescents & ↓ periods of GR in
middle childhood)
Stages of Growth and Development


Infancy


Neonate




Birth to 1 month



Toddler




1-3 years

Preschool


3-6 years

School age



1 month to 1 year

Early Childhood

Middle Childhood


Infancy






6 to 10 years (Girls)
6 to 12 years (Boys)



Late Childhood (Adolescent)



Prepubescent : 10-12 yrs () 12-14 yrs ()



Pubescent : 12- 14 yrs(ƒ); 14-16 yrs ()



Post Pubescent : 14 -18 yrs(ƒ); 16- 20 yrs ()
MEASUREMENT PARAMETERS
Postnatal growth patterns of normal children are
well characterized, resulting in several clinical
parameters for assessment of growth.
1. Linear growth (Length/Height)
2. Weight and body mass index
3. Weight/Height
4. Head circumference ; HC/CC ratio
5. Mid arm circumference
6. Body proportions (arm span and upper-to-lower segment ratio)
7. Growth velocity
8. Growth patterns
9. Dentition
10. Bone Age
Intrauterine growth charts
Calculation formulae
Weight gain
•Newborn1st 3 months - 200 gm/ week
•Next 3 months – 150 gm/ week
•Next 6 months – 100 gm/ week
•Doubles by 4 months; Triples by 1 year
•Quadruples by 2 years;
•Thereafter 2kg /yr added on till 6 years
•Threafter 3 kg/yr added till puberty
Length gain
Doubles ( ie.. 100 cm) by 4 years
6 cm / year till puberty
Triples by 12 years
Head circumference
1st 3 months: 2cm/month
Next 3 months: 1cm/month
Next 6 months : 0.5 cm/month
Weight
measurement


Weighing scales are of 3 types:



A) Beam balance





B) Spring Balance





Platform scale
Beam scale/ TANSI scale

Salters weighing scale
Bathroom scale

C) Electronic scale

Measure to the nearest 10 gm for infants and 100 gm for children. Weighing together with mother.
Weight categorisation/ classification
IAP Classification system
Normal:
> 80% of
expected
Wt/Age

Grade IV PEM
< 50 % of
expected Wt
/Age

Grade II PEM :
61- 70 % of
expected Wt /Age

Grade I PEM :
71- 80 % of
expected Wt
/Age

Grade III PEM
: 51- 60 % of
expected Wt
/Age
Welcome trust classification of PEM (1970)
>80% of expected weight

Normal
60 – 80% of expected weight
With edema : Kwashiorkor
Without edema : Underweight
<60% of expected weight
With edema: Marasmic kwashiorkor
Without edema : Marasmus

Other systems of classification : Gomez and Jellife’s
LENGTH/ HEIGHT

Below 2 yrs- supine length with infantometer.
For older children- Harpenden
Stadiometer
Prerequisites


Without footwear



Heels & back touching
the wall



Looking straight ahead
in frankfurt plane.



Gentle but firm
pressure upwards
applied to the
mastoids from
underneath



Record to last 0.1cm
Sitting height

Equipment:
sitting base of a known height (e.g., 50 cm x 40 cm x 30 cm) and a wall-mounted stadiometer
Technique:
The child is placed as erect as possible with buttocks, shoulders, and head in contact with
backboard of the stadiometer. Total height is measured. The height of the sitting surface is then
subtracted from the total height.
Plotting and Interpretation:
The measurement can be plotted on the CDC charts for stature-for-age.
Even if measurements fall below the 5th percentile, they establish a growth pattern over time.
Height measurements








Iliac Height (IH)
The distance between the summit of the iliac crest and the floor.
Subischial Leg Length (SLL)
The difference between stature and sitting height.
It assumes that in a seated position the proximal landmark corresponds to
the hip joint, which is very difficult to locate.
Useful to measure upper to lower body proportions
Calculation of Target Height and Target Height Centile

Measure the parent’s heights and
make a note of their heights on the
chart.
Calculate the child’s target height (TH)
and plot it at 18 years and mark it
with an arrow on the growth chart.

Cowell CT. Short Stature. In: Clinical Pediatric
Endocrinology, 3rd edn. Ed. Brook CGD. London,
Blackwell Science, 1995; pp 136-172.

This represents the child’s projected
height and the target range is
produced by plotting two points
7.5 cms above and below for a boy
and 6 cm above and below for a girl
(representing the 10th and the 90th
centile for that child).
WATERLOW Classification

Weight

Waterlow

>= 80 %

Classification
Height for

>= 90 %

Normal

Age

< 90 %

Stunted

for

Height
< 80 %
Wasted
Wasted and stunted
WHO Classification
Wt/ Age

Ht/ Age

Wt/Ht

Intepretation

Normal

Normal

Normal

Normal

Decreased

Normal

Decreased

Acute Malnutrition

Decreased

Decreased

Normal

Chronic Malnutrition

Decreased

Decreased

Decreased

Acute on Chronic
Malnutrition
GROWTH VELOCITY


The most critical factor in evaluating
the growth is determining
GROWTH VELOCITY.



Observation of child’s height pattern
in the form of “CROSSING
PERCENTILE LINES” on a linear
growth curve is the simplest method
of observing abnormal growth
velocity.



Atleast 3 measurements with
preferably 6 months interval in
between is necessary to comment
on growth pattern.
Growth patterns **


From the end of infancy until puberty begins, growth normally proceeds along a
channel that closely corresponds to a given height-attained percentile on crosssectional growth standards. A child normally establishes this channel by 2 to 3 years
age, although, on rare occasions, a gradual drift by as many as 40 percentile positions in
height attained may occur over a period of several years in normal children.



The velocity of growth (cm per year) actually decelerates slightly during this period
and averages about 6 cm per year in midchildhood.However, normal children cross
height-velocity percentiles to maintain their height channel.



A growth velocity that is consistently along the third percentile will lead to a
subnormal height. The growth channel seems to be genetically determined. Children
grow as if to reach a genetically predetermined height.



This target height, which represents the child’s genetic potential, can be
approximated by calculating the MPH.
Weight Velocity
1st year : 6 kg
Pre-school: 2kg/year
School : 3 kg/yr till puberty
Growth velocity


Sequential height measurements
and can be plotted on growth
velocity charts.



A minimum interval of 6 months is
needed for meaningful assessments
of growth velocity
Head Circumference
Brain growth is rapid during infancy and it is
unaffected by mild to moderate degree of
malnutrition

Should not be measured within 24 hrs after birth
Bony land marks – superior orbital ridge (ant),
external occipital protuberance (post)
Place the measuring tape around the largest circumference of the infant's head, across the occiput
and the forehead.
Chest circumference

Not used universally

Useful measurement for comparison with the head circumference
when a problem is suspected with either the head size or chest size.
Wrap the measuring tape around the infant's chest ideally taken at
xiphisternum / substernal notch just below the nipple line, midway
between inspiration and expiration firmly but not tight enough to
cause an indentation of the skin. read to the nearest 0.5 cm
Internipple distance


Trunk physical parameter as in special situations



Internipple distance calculated by using Sliding callipers with
child at rest and at end of expiration.



Internipple Index = Internipple distance X 100
Chest circumference
Value > 28 % diagnostic
Upper-to-Lower Segment Ratio
The upper-to-lower segment ratio is calculated when a child's body may have
inappropriate proportions between the head and trunk to the extremities.
Measure the lower body segment (distance from the symphysis pubis to the floor
when a child stands).
Calculate the upper body segment by subtracting the lower body
segment from the total height. Then divide the upper body segment by
the lower body segment to calculate the ratio.
Expected ratios by age are
♦ At birth—1.7
Increase: Rickets, achondroplasia, Untreated hypothyroidism
♦ At 3 years—1.3
Decrease: spondyloepiphyseal dysplasia, vertebral anomalies
♦ After 7 years—1.0
By about 11 years of age, adult proportions are reached

A higher upper-to-lower body segment ratio than expected may be associated
with dwarfism or bone disorders.
Individual components


Arm length – Acromion to tip of 3rd finger with arm in full
extension and parallel to the body.



Upper segment of arm – Acromion to Olecranon with elbow
bent at 90Âş



Foream / Lower segment of arm – Olecranon process to distal
end of styloid process of radius with elbow bent at 90Âş



Hand length – Distal wrist crease to tip of 3rd finger



Palm length – Distal wrist crease to prox. Crease of 3rd finger
Skeletal dysplasia



Rhizomelia (Upper arm / Proximal shortening)



Mesomelia (Forearm / Middle shortening)



Acromelia (Palm &Fingers / Distal shortening)
Acromesomelia (Forearm, Palm, fingers /Middle & distal)
Micromelia (Whole upper limb shortening)



Percentile Rank Nutrition- Related Health Concern
Anthropometric Index

Percentile Cut-off Value

Nutritional Status
Indicator

BMI-for-Age

≥ 95th

Obese

BMI-for-Age

≥ 85th and < 95th

Overweight

Weight-for-Length

< 5th

Underweight

Head Circumference-for-Age

< 5th and > 95th

Developmental Problems

Growth parameters and their interpretation for the World Health Organization
charts
Age independent Anthropometric
indicators


Labile tissues like subcutaneous fat and muscle are
more reduced in malnutrition than skeleton



Bangle test: If a bangle of 4 cm Internal diameter crosses elbow
Shakir’s tape: Plastic tape with color zones – Red if < 12.5 cm
Quac stick : Rod with markings for Height and Arm circumference.
Nabarrow’s thinness chart : Graphic chart for Wt/Ht







MAC:HC (Kanawati) ratio: 0.28- 0.314 : Mild ; <0.249 : Severe
MAC : Height ratio : Normal if >0.32 ; Severe malnutrition if <0.29



Ponderal index : Weight (in kg)/ length 3 (in cm) x 100 ;



Normal if >2.5 ; Symmetrical IUGR 2.0 -2.5 ; Asymmetric IUGR < 2.0


Dughadale ratio : Weight (in kg)/ height

1.6 ;

Normal if >0.79 ;
Mid Upper arm circumference
(MUAC)
Steps of MUAC measurement
Ask the mother to remove any clothing that covers the
child’s arm. If possible the child should stand erect and
sideways to the measurer.
Estimate the mid-point of the left arm.
Straighten the child’s arm and wrap the tape around at the
mid-point. Make sure that the numbers are right side up. Make
sure the tape is flat around the skin.
Inspect the tension of the tape on the child’s arm. Make sure
the tape has the proper tension and is not too tight or too
loose. Repeat any step as necessary.
When the tape is in the correct position and correct tension
on the arm, read and call out the measurement to the nearest
0.1 cm.
Immediately record the measurement.
Skinfold thickness
Skinfold thickness by age and sex, as
measured by Harpenden skinfold calipers
over triceps and under scapula.
The lines shown are the 50th percentiles
for British children. Scale is in millimeters
on the left side and logarithmic
transformation units on the right side.
Usually gives a better estimate of adiposity,
although considerable experience is needed
for accuracy, and variability in fat
distribution may confound the
measurement.
Waist circumference and waist-hip ratio:


Both waist circumference (WC) and waist-hip ratio are
indicators of visceral fat or abdominal obesity in children and
adolescents age 2–19 years.



Increased visceral adiposity measured by WC increases the risk
of obesity-related morbidity and mortality.



WC should be measured at the highest point of the iliac crest
when the individual is standing and at minimal respiration.



Waist-hip ratio is calculated as a ratio of waist circumference
(cm) and hip circumference (cm).
Males
200

78
+2

190

0

170

-1

Height (cm)

Growth should be measured and compared
statistical norms in a standard fashion on

70
66

-2

160



74

+1

180

62

with

150
140

58
54

growth charts.
130

50

120

46

110

Growth charts are visible display of child’s physical growth
and development.

42

100

38

90

34

80

30

70
2

4

6

8

10 12
Age (y)

14

16

18

20

Also called as “road-to-health" chart. It was first designed by
David Morley and was later modified by WHO.


Growth is assessed by plotting accurate measurements on growth charts and
comparing each set of measurements with previous measurements obtained at
health maintenance visits or at other visits if there is a concern over the child's
growth pattern.



Serial measurements more useful than single measurements to detect deviations
from a particular child's growth pattern even if the value remains within statistically
defined normal limits (percentiles)

Height (in)

GROWTH MONITORING
Growth standard vs. reference
Rate of growth of children is one of the finest indicators of the health of a
community. Growth monitoring followed by suitable action prevents illness,
malnutrition and even death. It provides reassurance about child’s health and prevents
parental anxiety.
A growth reference simply describes the growth of a sample of individuals,
whereas a standard describes the growth of a healthy population and suggests an
aspirational model.
WHO growth charts are growth standards. A reference is representative of the
existing growth pattern of children and allows us to study the secular trends in height,
weight and obesity.
On community and national level it helps identify children at risk of morbidity and
mortality. It thus helps in implementation of national programmes for nutritional and
medical interventions like supplementary feeding, foods to vulnerable group,
underprivileged school children, etc. It is also a method to evaluate programs for
improving child health and nutrition and can form the basis for policy making.
Z-score


It is another way of expressing a child’s height in comparison
with the mean for child’s age.
Child’s Height- Mean Height for age in the reference chart
1 SD of height for that age in the reference data

The resultant value is a number without units.
Advantage: Children of different ages and gender can be compared
GROWTH CHARTS AND REFERENCE DATA
 Ideally constructed growth charts depict the longitudinal growth of a
cohort of children from birth to maturity. Many logistic difficulties as it
would entail a prolonged study.
 50th percentile of Harvard Standards (1970s) is considered 100% for
Indian children. If a child is at 5th percentile it means 5% children of that
age have less weight or growing less fast than this child.
Many international reference standards NCHS (US National centre
for Health Statistics, Boston) have been obtained from cross-sectional or
semi-longitudinal studies ; Pubertal spurt gets blunted in these charts.
Separate reference standards for different ethnic groups derived from
studying growth of children living in an optimal environment with
adequate nutrition.
BACKGROUND


The ICMR undertook a nationwide cross sectional study during 1956-1965
to establish indian referance charts. Irrelevant now as they were done on
lower socio-economic class.



Indian context Multicenter study : Agarwal et al. (1992,1994); Khadilkar et al.
(2009); Marwaha et al. (2011)



The growth charts compiled by Agarwal et al were based on affluent
urban children from all major zones of India measured 1989-1991. The data
is now 20 years old.



WHO recommends that each country should update its growth references
every decade and hence new growth references were produced in 2009.



Khadilkar et al have published the growth charts on affluent children 5-18
years and have also compared the growth of 2-5 years old indian children
with the new WHO growth charts. These are the most modern national
growth references available now at present.
WHO growth chart:
8500 children - 6 countries
(2006)
MGRS study design
Longitudinal (0-24 months)
year 1

year 2

year 3

Cross-sectional (18-71 mo)

After the age of 5 years, the WHO extended the MGRS chart till 18 yrs by appending
NCHS data and extrapolating the MGRS percentile lines.
Many countries choose to use WHO charts only for toddlers {upto 2 yrs in USA}
[upto 4 yrs in UK] and their own national charts for older children.

WHO Multicentre Growth Reference Study (2006)
WHO - MGRS / reference indicators
n

Attained growth
•
•
•
•
•
•
•
•

n

weight-for-age
length/height-for-age
weight-for-length/height
head circumference-for-age
mid-upper arm circumference-for-age
triceps skinfold-for-age
subscapular skinfold-for-age
body mass index-for-age

Velocity

• weight
• length
• head circumference
• arm circumference
• body mass index
GROWTH MONITORING


Deviations in growth patterns may be nonspecific or may be important
indicators of serious and chronic medical disorders.



An accurate measurement of length/height, weight, and head circumference
should be obtained at every health supervision visit.
Time schedule child anthropometry
Frequency No. of visits
Once
1
4
Bi-weekly
Monthly
10
Bi-monthly
6

Measurement
Weight, length, head
circumference

Time frame
Birth
Weeks 2-8
3-12 months
14-24 months

Arm circumference
Skinfold thicknesses

3-12 months Monthly
14-24 months Bi-monthly

10
6

WHO Multicentre Growth Reference Study (2006)
Criteria for referral

Indian Pediatrics 2007; 44:187-197

IAP Growth Monitoring Guidelines for Children from Birth to 18 Years

(i) First three years
† Length/height, weight or head circumference below 3rd percentile or above 97th percentile
on growth chart.
† Crossing of two major percentile lines (upward or downward) e.g., going from above 75th
percentile to below 50th percentile on height or weight chart.
† A child below or above mid parental range for height/length
† Weight loss or lack of weight gain for a month in the first 6 months.
† Absence of weight gain for 2-3 months from 6-12 months of age.
† Micropenis.
† Unilateral or bilateral undescended testis.
† Ambiguous genitals.

(ii) Three to nine years
Âť Length/Height below 3rd percentile or above 97th percentile on growth chart.

Âť Crossing of two major percentile lines (upward or downward)
Âť A child below or above mid parental range for height .
Âť BMI over the 85th percentile at all ages.
Âť Rate of growth less than 5 cm/year.
Criteria for referral

Indian Pediatrics 2007; 44:187-197

IAP Growth Monitoring Guidelines for Children from Birth to 18 Years

(ii) Three to nine years (Continued)
ÂťGirls with axillary, pubic hair growth or breast budding before 8 years and boys with axillary,
pubic hair growth, genital growth or and testicular enlargement before 9 years.
ÂťChildren with craniospinal irradiation or surgery for brain tumors.
ÂťMicropenis.

(iii) Nine to eighteen years
Height below 3rd percentile or above 97th percentile on growth chart.
Crossing of two major percentile lines (upward or downward)
A child below or above mid parental range for height.
BMI over the 85th percentile at all ages.
Arrest at the same stage of puberty for more than 2 years.
Micropenis.
Unilateral or bilateral Gynecomastia in boys.
Hirsuitism and Menstrual irregularities in girls.
Delayed puberty that is girls with no breast budding by 14 years or no menarche by 15 years
and boys with no signs of puberty by 16 years.
WEIGHT AND STATURE CHARTS
BMI Changes with Age

Age
BMI
Value

2

4

9

13

19.3 17.8 21.0 25.1

Example: Child’s growth tracking along 95th percentile
Body mass index for boys and girls 2-17 years.

Redesigned by Agarwal KN, Agarwal DK, Bansal AK for the
Indian Academy of Pediatrics
CDC Percentile chart
BODY MASS INDEX
G & P Method
Patient’s film is
compared with the
standard of the
same sex and
nearest age
It is next
compared with
adjacent standard,
both older and
younger to get the
closest match
TW Method - 13 Bones
Bone age
Better correlate with SMR
Predictor of future height

Delayed bone age
Constitutional short stature
Hypothyroidism
Celiac disease
GH deficiency
Bone age: an
algorithm for boys

Unnikrishnan AG, Kumar H, Jayakumar RV.
Bone age in a minute: a simple algorithm.
Amrita J Med 2006; 2:39-41
Bone age: an
algorithm for girls

Unnikrishnan AG, Kumar H, Jayakumar RV.
Bone age in a minute: a simple algorithm.
Amrita J Med 2006; 2:39-41
CAVEATS TO INFORMATION IN BONE AGE
Subjectivity: Interobserver variation
Normal children radiographs comparability ; Non-applicability to spl.
context- skeletal dysplasias, genetic causes .

BAYLEY-PINNEAU and RWT (Roche,Wainer,Thissen)
CHARTS
Dental development
Dental development


Dental development includes mineralization, eruption, and exfoliation.



Initial mineralization begins as early as the second trimester (mean age
for central incisors, 14 wk) and continues through 3 yr of age for the
primary (deciduous) teeth and 25 yr of age for the permanent teeth.



Mineralization begins at the crown and progresses toward the root.



Eruption begins with the central incisors and progresses laterally.



Exfoliation begins at about 6 yr of age and continues through 12 yr of
age. Eruption of the permanent teeth may follow exfoliation
immediately or may lag by 4-5 mo. The timing of dental development is
poorly correlated with other processes of growth and maturation.
Growth charts for special populations:


a. Down syndrome:



b. Turner syndrome:



c. Achondroplasia:



d. Prader-Willi Syndrome



e. Silver–Russell syndrome
Down syndrome

Height and weight centiles for boys with trisomy 21
syndrome aged 2–18 years. The gray-shaded areas
represent the comparable values for the 3rd to 97th
centiles for normal children.
Adapted from Cronk C, Crocker A,Peuschel S et al.
Growth charts for children with Down syndrome.
Pediatrics 1988; 81: 102–10.
Turner
syndrome

Height centiles for girls with untreated Turner
syndrome aged 1–20 years.

The gray-shaded area
represents the 3rd to
97th centiles for
normal girls.
Pubertal staging is for
normal girls

Adapted from Lyon A, Preece M, Grant D.
Growth curves for girls with Turner syndrome. Arch Dis Child 1985; 60: 932–935.
Achondroplasia

Height centiles for boys
with achondroplasia
(mean Âą 2 SD) compared
with normal standard
curves (dashed lines).

Data derived
from 189 males.

Adapted from Horton W, Rotter J, Rimoin D et al.
Standard growth curves for achondroplasia.
J Pediatr 1978; 93: 435–8.
Prader-Willi Syndrome
Silver–Russell syndrome

Height centiles for boys with Silver–Russell
syndrome .The grayshaded area indicates
normal boys Âą2 standard deviations (SD).
Adapted from Wollman H, Kirchner T, Enders H
et al. Growth and symptoms in Silver–Russell
syndrome: review on the basis of 386 patients.
Eur J Pediatr 1995; 154: 958–68.
Always Perform Sexual Maturity
Rating
Sequence of maturational events
MALES

FEMALES

Adapted from Marshall WA,Tanner JM:Variations in the pattern of pubertal changes
in boys. Arch Dis Child 1970;45:13
Child survival
Physical growth
Child development
Growth measures in Clinical Practice

More Related Content

What's hot

Short stature
Short statureShort stature
Short staturefarranajwa
 
Growth and Development
Growth and DevelopmentGrowth and Development
Growth and DevelopmentNAHOMWRK
 
Follow up of High Risk Neonates.. Dr.Padmesh
Follow up of High Risk Neonates.. Dr.Padmesh Follow up of High Risk Neonates.. Dr.Padmesh
Follow up of High Risk Neonates.. Dr.Padmesh Dr Padmesh Vadakepat
 
Growth Charts Interpretation DrMajdi
Growth Charts Interpretation DrMajdiGrowth Charts Interpretation DrMajdi
Growth Charts Interpretation DrMajdiDr. Majdi Al Jasim
 
Approach to a child with Hepatosplenomegaly
Approach to a child with HepatosplenomegalyApproach to a child with Hepatosplenomegaly
Approach to a child with HepatosplenomegalySunil Agrawal
 
Basic approach on short stature in children
Basic approach on short stature in childrenBasic approach on short stature in children
Basic approach on short stature in childrenAzad Haleem
 
Approach to a child with failure to thrive
Approach to a child with failure to thriveApproach to a child with failure to thrive
Approach to a child with failure to thriveSingaram_Paed
 
IAP Growth Monitoring Guidelines for Children from Birth to 18 Years
IAP Growth Monitoring Guidelines for Children from Birth to 18 YearsIAP Growth Monitoring Guidelines for Children from Birth to 18 Years
IAP Growth Monitoring Guidelines for Children from Birth to 18 Yearsmandar haval
 
Normal growth in pediatrics
Normal growth in pediatricsNormal growth in pediatrics
Normal growth in pediatricsDr,Kaushik Barot
 
Approach to a child with short stature AG
Approach to a child with short stature AGApproach to a child with short stature AG
Approach to a child with short stature AGAkshay Golwalkar
 
Pediatrics History Taking and Physical Examination.pptx
Pediatrics History Taking and Physical Examination.pptxPediatrics History Taking and Physical Examination.pptx
Pediatrics History Taking and Physical Examination.pptxAJAY MANDAL
 
Growth Hormone Deficiency in Children
Growth Hormone Deficiency in ChildrenGrowth Hormone Deficiency in Children
Growth Hormone Deficiency in ChildrenDr. Aryan (Anish Dhakal)
 
Childhood hypertension
Childhood  hypertensionChildhood  hypertension
Childhood hypertensionHemraj Soni
 
Development and-assessment
Development and-assessmentDevelopment and-assessment
Development and-assessmentMahishmaKonidala1
 
The pediatric history and physical examination
The pediatric history and physical examinationThe pediatric history and physical examination
The pediatric history and physical examinationPave Medicine
 

What's hot (20)

Growth assesment in children
Growth assesment in childrenGrowth assesment in children
Growth assesment in children
 
Short stature
Short statureShort stature
Short stature
 
Growth chart
Growth chartGrowth chart
Growth chart
 
Growth charts
Growth chartsGrowth charts
Growth charts
 
Growth and Development
Growth and DevelopmentGrowth and Development
Growth and Development
 
Follow up of High Risk Neonates.. Dr.Padmesh
Follow up of High Risk Neonates.. Dr.Padmesh Follow up of High Risk Neonates.. Dr.Padmesh
Follow up of High Risk Neonates.. Dr.Padmesh
 
Growth Charts Interpretation DrMajdi
Growth Charts Interpretation DrMajdiGrowth Charts Interpretation DrMajdi
Growth Charts Interpretation DrMajdi
 
Approach to a child with Hepatosplenomegaly
Approach to a child with HepatosplenomegalyApproach to a child with Hepatosplenomegaly
Approach to a child with Hepatosplenomegaly
 
Basic approach on short stature in children
Basic approach on short stature in childrenBasic approach on short stature in children
Basic approach on short stature in children
 
Approach to a child with failure to thrive
Approach to a child with failure to thriveApproach to a child with failure to thrive
Approach to a child with failure to thrive
 
Pediatric Obesity
Pediatric ObesityPediatric Obesity
Pediatric Obesity
 
IAP Growth Monitoring Guidelines for Children from Birth to 18 Years
IAP Growth Monitoring Guidelines for Children from Birth to 18 YearsIAP Growth Monitoring Guidelines for Children from Birth to 18 Years
IAP Growth Monitoring Guidelines for Children from Birth to 18 Years
 
Normal growth in pediatrics
Normal growth in pediatricsNormal growth in pediatrics
Normal growth in pediatrics
 
Approach to a child with short stature AG
Approach to a child with short stature AGApproach to a child with short stature AG
Approach to a child with short stature AG
 
Pediatrics History Taking and Physical Examination.pptx
Pediatrics History Taking and Physical Examination.pptxPediatrics History Taking and Physical Examination.pptx
Pediatrics History Taking and Physical Examination.pptx
 
Growth Hormone Deficiency in Children
Growth Hormone Deficiency in ChildrenGrowth Hormone Deficiency in Children
Growth Hormone Deficiency in Children
 
Childhood hypertension
Childhood  hypertensionChildhood  hypertension
Childhood hypertension
 
Development and-assessment
Development and-assessmentDevelopment and-assessment
Development and-assessment
 
The pediatric history and physical examination
The pediatric history and physical examinationThe pediatric history and physical examination
The pediatric history and physical examination
 
Bind
BindBind
Bind
 

Viewers also liked

Growth charts santosh mogali
Growth charts santosh mogaliGrowth charts santosh mogali
Growth charts santosh mogaliSantosh Mogali
 
Growth monitoring, screening and survillence
Growth monitoring, screening and survillenceGrowth monitoring, screening and survillence
Growth monitoring, screening and survillenceRakesh Verma
 
Growth monitoring
Growth monitoringGrowth monitoring
Growth monitoringNovmeet Sharma
 
WHO Growth Chart
WHO Growth ChartWHO Growth Chart
WHO Growth ChartKunal Modak
 

Viewers also liked (6)

IAP Growth Charts 2015
IAP Growth Charts 2015IAP Growth Charts 2015
IAP Growth Charts 2015
 
Growth charts santosh mogali
Growth charts santosh mogaliGrowth charts santosh mogali
Growth charts santosh mogali
 
Growth monitoring, screening and survillence
Growth monitoring, screening and survillenceGrowth monitoring, screening and survillence
Growth monitoring, screening and survillence
 
Growth monitoring
Growth monitoringGrowth monitoring
Growth monitoring
 
Who growth chart
Who growth chartWho growth chart
Who growth chart
 
WHO Growth Chart
WHO Growth ChartWHO Growth Chart
WHO Growth Chart
 

Similar to Growth measures in Clinical Practice

DIFFERENT TYPES OF ANTHROPOMETERY MEASURMENT.pptx
DIFFERENT TYPES OF ANTHROPOMETERY MEASURMENT.pptxDIFFERENT TYPES OF ANTHROPOMETERY MEASURMENT.pptx
DIFFERENT TYPES OF ANTHROPOMETERY MEASURMENT.pptxAnkitaMishra271
 
Paediatric Anthropometry
Paediatric AnthropometryPaediatric Anthropometry
Paediatric AnthropometryAbhinav Kumar
 
Pain management and anthropometry (Yosra Raziani)
Pain management and anthropometry (Yosra Raziani)Pain management and anthropometry (Yosra Raziani)
Pain management and anthropometry (Yosra Raziani)Yosra Raziani
 
Anthropometry measurement
 Anthropometry measurement Anthropometry measurement
Anthropometry measurementKalpanaKawan1
 
Guide line for groth and development
Guide line for groth and developmentGuide line for groth and development
Guide line for groth and developmentDR.MANOJ KR VERMA
 
Anthropometry Pediatrics
Anthropometry PediatricsAnthropometry Pediatrics
Anthropometry PediatricsDR MUKESH SAH
 
Developmental milestones 1.pptx
Developmental milestones 1.pptxDevelopmental milestones 1.pptx
Developmental milestones 1.pptxHarshitaCool1
 
Seminar short stature
Seminar short statureSeminar short stature
Seminar short statureRakesh Verma
 
Lecture 2 Physical development.pptx
Lecture 2 Physical development.pptxLecture 2 Physical development.pptx
Lecture 2 Physical development.pptxssuser52b9c8
 
Growth and development monitoring.ppt
Growth and development monitoring.pptGrowth and development monitoring.ppt
Growth and development monitoring.pptMelba Shaya Sweety
 
Growth
GrowthGrowth
Growthpune2013
 
Physical development of children. Semiotics violation of physical development...
Physical development of children. Semiotics violation of physical development...Physical development of children. Semiotics violation of physical development...
Physical development of children. Semiotics violation of physical development...Eneutron
 
Growth and development
Growth and developmentGrowth and development
Growth and developmentDr.Manojit Sarkar
 
Growth &amp; development file
Growth &amp; development fileGrowth &amp; development file
Growth &amp; development fileresma behera
 
Growth and development monitoring
Growth and development monitoringGrowth and development monitoring
Growth and development monitoringChinna Chadayan
 
assessment of growth and development.pptx
assessment of growth and development.pptxassessment of growth and development.pptx
assessment of growth and development.pptxNithinKumar188
 
3- Post natal Development.pptx
3- Post natal Development.pptx3- Post natal Development.pptx
3- Post natal Development.pptxMOHAMED402937
 

Similar to Growth measures in Clinical Practice (20)

DIFFERENT TYPES OF ANTHROPOMETERY MEASURMENT.pptx
DIFFERENT TYPES OF ANTHROPOMETERY MEASURMENT.pptxDIFFERENT TYPES OF ANTHROPOMETERY MEASURMENT.pptx
DIFFERENT TYPES OF ANTHROPOMETERY MEASURMENT.pptx
 
Paediatric Anthropometry
Paediatric AnthropometryPaediatric Anthropometry
Paediatric Anthropometry
 
Pain management and anthropometry (Yosra Raziani)
Pain management and anthropometry (Yosra Raziani)Pain management and anthropometry (Yosra Raziani)
Pain management and anthropometry (Yosra Raziani)
 
Anthropometry measurement
 Anthropometry measurement Anthropometry measurement
Anthropometry measurement
 
Lecture-2. Normal Growth
Lecture-2. Normal GrowthLecture-2. Normal Growth
Lecture-2. Normal Growth
 
Guide line for groth and development
Guide line for groth and developmentGuide line for groth and development
Guide line for groth and development
 
Anthropometry Pediatrics
Anthropometry PediatricsAnthropometry Pediatrics
Anthropometry Pediatrics
 
Growth chart
Growth chartGrowth chart
Growth chart
 
Developmental milestones 1.pptx
Developmental milestones 1.pptxDevelopmental milestones 1.pptx
Developmental milestones 1.pptx
 
Seminar short stature
Seminar short statureSeminar short stature
Seminar short stature
 
Technique of assessment of growth
Technique of assessment of growthTechnique of assessment of growth
Technique of assessment of growth
 
Lecture 2 Physical development.pptx
Lecture 2 Physical development.pptxLecture 2 Physical development.pptx
Lecture 2 Physical development.pptx
 
Growth and development monitoring.ppt
Growth and development monitoring.pptGrowth and development monitoring.ppt
Growth and development monitoring.ppt
 
Growth
GrowthGrowth
Growth
 
Physical development of children. Semiotics violation of physical development...
Physical development of children. Semiotics violation of physical development...Physical development of children. Semiotics violation of physical development...
Physical development of children. Semiotics violation of physical development...
 
Growth and development
Growth and developmentGrowth and development
Growth and development
 
Growth &amp; development file
Growth &amp; development fileGrowth &amp; development file
Growth &amp; development file
 
Growth and development monitoring
Growth and development monitoringGrowth and development monitoring
Growth and development monitoring
 
assessment of growth and development.pptx
assessment of growth and development.pptxassessment of growth and development.pptx
assessment of growth and development.pptx
 
3- Post natal Development.pptx
3- Post natal Development.pptx3- Post natal Development.pptx
3- Post natal Development.pptx
 

Recently uploaded

Call Girl Bangalore Nandini 7001305949 Independent Escort Service Bangalore
Call Girl Bangalore Nandini 7001305949 Independent Escort Service BangaloreCall Girl Bangalore Nandini 7001305949 Independent Escort Service Bangalore
Call Girl Bangalore Nandini 7001305949 Independent Escort Service Bangalorenarwatsonia7
 
Call Girls Thane Just Call 9910780858 Get High Class Call Girls Service
Call Girls Thane Just Call 9910780858 Get High Class Call Girls ServiceCall Girls Thane Just Call 9910780858 Get High Class Call Girls Service
Call Girls Thane Just Call 9910780858 Get High Class Call Girls Servicesonalikaur4
 
Kolkata Call Girls Services 9907093804 @24x7 High Class Babes Here Call Now
Kolkata Call Girls Services 9907093804 @24x7 High Class Babes Here Call NowKolkata Call Girls Services 9907093804 @24x7 High Class Babes Here Call Now
Kolkata Call Girls Services 9907093804 @24x7 High Class Babes Here Call NowNehru place Escorts
 
Call Girls Electronic City Just Call 7001305949 Top Class Call Girl Service A...
Call Girls Electronic City Just Call 7001305949 Top Class Call Girl Service A...Call Girls Electronic City Just Call 7001305949 Top Class Call Girl Service A...
Call Girls Electronic City Just Call 7001305949 Top Class Call Girl Service A...narwatsonia7
 
Call Girls Hosur Just Call 7001305949 Top Class Call Girl Service Available
Call Girls Hosur Just Call 7001305949 Top Class Call Girl Service AvailableCall Girls Hosur Just Call 7001305949 Top Class Call Girl Service Available
Call Girls Hosur Just Call 7001305949 Top Class Call Girl Service Availablenarwatsonia7
 
call girls in Connaught Place DELHI 🔝 >༒9540349809 🔝 genuine Escort Service ...
call girls in Connaught Place  DELHI 🔝 >༒9540349809 🔝 genuine Escort Service ...call girls in Connaught Place  DELHI 🔝 >༒9540349809 🔝 genuine Escort Service ...
call girls in Connaught Place DELHI 🔝 >༒9540349809 🔝 genuine Escort Service ...saminamagar
 
VIP Call Girls Lucknow Nandini 7001305949 Independent Escort Service Lucknow
VIP Call Girls Lucknow Nandini 7001305949 Independent Escort Service LucknowVIP Call Girls Lucknow Nandini 7001305949 Independent Escort Service Lucknow
VIP Call Girls Lucknow Nandini 7001305949 Independent Escort Service Lucknownarwatsonia7
 
Russian Call Girls in Pune Riya 9907093804 Short 1500 Night 6000 Best call gi...
Russian Call Girls in Pune Riya 9907093804 Short 1500 Night 6000 Best call gi...Russian Call Girls in Pune Riya 9907093804 Short 1500 Night 6000 Best call gi...
Russian Call Girls in Pune Riya 9907093804 Short 1500 Night 6000 Best call gi...Miss joya
 
Call Girls Service Noida Maya 9711199012 Independent Escort Service Noida
Call Girls Service Noida Maya 9711199012 Independent Escort Service NoidaCall Girls Service Noida Maya 9711199012 Independent Escort Service Noida
Call Girls Service Noida Maya 9711199012 Independent Escort Service NoidaPooja Gupta
 
VIP Call Girls Mumbai Arpita 9910780858 Independent Escort Service Mumbai
VIP Call Girls Mumbai Arpita 9910780858 Independent Escort Service MumbaiVIP Call Girls Mumbai Arpita 9910780858 Independent Escort Service Mumbai
VIP Call Girls Mumbai Arpita 9910780858 Independent Escort Service Mumbaisonalikaur4
 
Call Girls Kanakapura Road Just Call 7001305949 Top Class Call Girl Service A...
Call Girls Kanakapura Road Just Call 7001305949 Top Class Call Girl Service A...Call Girls Kanakapura Road Just Call 7001305949 Top Class Call Girl Service A...
Call Girls Kanakapura Road Just Call 7001305949 Top Class Call Girl Service A...narwatsonia7
 
Glomerular Filtration rate and its determinants.pptx
Glomerular Filtration rate and its determinants.pptxGlomerular Filtration rate and its determinants.pptx
Glomerular Filtration rate and its determinants.pptxDr.Nusrat Tariq
 
Call Girls Whitefield Just Call 7001305949 Top Class Call Girl Service Available
Call Girls Whitefield Just Call 7001305949 Top Class Call Girl Service AvailableCall Girls Whitefield Just Call 7001305949 Top Class Call Girl Service Available
Call Girls Whitefield Just Call 7001305949 Top Class Call Girl Service Availablenarwatsonia7
 
Housewife Call Girls Hsr Layout - Call 7001305949 Rs-3500 with A/C Room Cash ...
Housewife Call Girls Hsr Layout - Call 7001305949 Rs-3500 with A/C Room Cash ...Housewife Call Girls Hsr Layout - Call 7001305949 Rs-3500 with A/C Room Cash ...
Housewife Call Girls Hsr Layout - Call 7001305949 Rs-3500 with A/C Room Cash ...narwatsonia7
 
College Call Girls Pune Mira 9907093804 Short 1500 Night 6000 Best call girls...
College Call Girls Pune Mira 9907093804 Short 1500 Night 6000 Best call girls...College Call Girls Pune Mira 9907093804 Short 1500 Night 6000 Best call girls...
College Call Girls Pune Mira 9907093804 Short 1500 Night 6000 Best call girls...Miss joya
 
Call Girls Hsr Layout Just Call 7001305949 Top Class Call Girl Service Available
Call Girls Hsr Layout Just Call 7001305949 Top Class Call Girl Service AvailableCall Girls Hsr Layout Just Call 7001305949 Top Class Call Girl Service Available
Call Girls Hsr Layout Just Call 7001305949 Top Class Call Girl Service Availablenarwatsonia7
 
Call Girls Jp Nagar Just Call 7001305949 Top Class Call Girl Service Available
Call Girls Jp Nagar Just Call 7001305949 Top Class Call Girl Service AvailableCall Girls Jp Nagar Just Call 7001305949 Top Class Call Girl Service Available
Call Girls Jp Nagar Just Call 7001305949 Top Class Call Girl Service Availablenarwatsonia7
 
Mumbai Call Girls Service 9910780858 Real Russian Girls Looking Models
Mumbai Call Girls Service 9910780858 Real Russian Girls Looking ModelsMumbai Call Girls Service 9910780858 Real Russian Girls Looking Models
Mumbai Call Girls Service 9910780858 Real Russian Girls Looking Modelssonalikaur4
 
Call Girls Service Nandiambakkam | 7001305949 At Low Cost Cash Payment Booking
Call Girls Service Nandiambakkam | 7001305949 At Low Cost Cash Payment BookingCall Girls Service Nandiambakkam | 7001305949 At Low Cost Cash Payment Booking
Call Girls Service Nandiambakkam | 7001305949 At Low Cost Cash Payment BookingNehru place Escorts
 

Recently uploaded (20)

Call Girl Bangalore Nandini 7001305949 Independent Escort Service Bangalore
Call Girl Bangalore Nandini 7001305949 Independent Escort Service BangaloreCall Girl Bangalore Nandini 7001305949 Independent Escort Service Bangalore
Call Girl Bangalore Nandini 7001305949 Independent Escort Service Bangalore
 
Call Girls Thane Just Call 9910780858 Get High Class Call Girls Service
Call Girls Thane Just Call 9910780858 Get High Class Call Girls ServiceCall Girls Thane Just Call 9910780858 Get High Class Call Girls Service
Call Girls Thane Just Call 9910780858 Get High Class Call Girls Service
 
Kolkata Call Girls Services 9907093804 @24x7 High Class Babes Here Call Now
Kolkata Call Girls Services 9907093804 @24x7 High Class Babes Here Call NowKolkata Call Girls Services 9907093804 @24x7 High Class Babes Here Call Now
Kolkata Call Girls Services 9907093804 @24x7 High Class Babes Here Call Now
 
sauth delhi call girls in Bhajanpura 🔝 9953056974 🔝 escort Service
sauth delhi call girls in Bhajanpura 🔝 9953056974 🔝 escort Servicesauth delhi call girls in Bhajanpura 🔝 9953056974 🔝 escort Service
sauth delhi call girls in Bhajanpura 🔝 9953056974 🔝 escort Service
 
Call Girls Electronic City Just Call 7001305949 Top Class Call Girl Service A...
Call Girls Electronic City Just Call 7001305949 Top Class Call Girl Service A...Call Girls Electronic City Just Call 7001305949 Top Class Call Girl Service A...
Call Girls Electronic City Just Call 7001305949 Top Class Call Girl Service A...
 
Call Girls Hosur Just Call 7001305949 Top Class Call Girl Service Available
Call Girls Hosur Just Call 7001305949 Top Class Call Girl Service AvailableCall Girls Hosur Just Call 7001305949 Top Class Call Girl Service Available
Call Girls Hosur Just Call 7001305949 Top Class Call Girl Service Available
 
call girls in Connaught Place DELHI 🔝 >༒9540349809 🔝 genuine Escort Service ...
call girls in Connaught Place  DELHI 🔝 >༒9540349809 🔝 genuine Escort Service ...call girls in Connaught Place  DELHI 🔝 >༒9540349809 🔝 genuine Escort Service ...
call girls in Connaught Place DELHI 🔝 >༒9540349809 🔝 genuine Escort Service ...
 
VIP Call Girls Lucknow Nandini 7001305949 Independent Escort Service Lucknow
VIP Call Girls Lucknow Nandini 7001305949 Independent Escort Service LucknowVIP Call Girls Lucknow Nandini 7001305949 Independent Escort Service Lucknow
VIP Call Girls Lucknow Nandini 7001305949 Independent Escort Service Lucknow
 
Russian Call Girls in Pune Riya 9907093804 Short 1500 Night 6000 Best call gi...
Russian Call Girls in Pune Riya 9907093804 Short 1500 Night 6000 Best call gi...Russian Call Girls in Pune Riya 9907093804 Short 1500 Night 6000 Best call gi...
Russian Call Girls in Pune Riya 9907093804 Short 1500 Night 6000 Best call gi...
 
Call Girls Service Noida Maya 9711199012 Independent Escort Service Noida
Call Girls Service Noida Maya 9711199012 Independent Escort Service NoidaCall Girls Service Noida Maya 9711199012 Independent Escort Service Noida
Call Girls Service Noida Maya 9711199012 Independent Escort Service Noida
 
VIP Call Girls Mumbai Arpita 9910780858 Independent Escort Service Mumbai
VIP Call Girls Mumbai Arpita 9910780858 Independent Escort Service MumbaiVIP Call Girls Mumbai Arpita 9910780858 Independent Escort Service Mumbai
VIP Call Girls Mumbai Arpita 9910780858 Independent Escort Service Mumbai
 
Call Girls Kanakapura Road Just Call 7001305949 Top Class Call Girl Service A...
Call Girls Kanakapura Road Just Call 7001305949 Top Class Call Girl Service A...Call Girls Kanakapura Road Just Call 7001305949 Top Class Call Girl Service A...
Call Girls Kanakapura Road Just Call 7001305949 Top Class Call Girl Service A...
 
Glomerular Filtration rate and its determinants.pptx
Glomerular Filtration rate and its determinants.pptxGlomerular Filtration rate and its determinants.pptx
Glomerular Filtration rate and its determinants.pptx
 
Call Girls Whitefield Just Call 7001305949 Top Class Call Girl Service Available
Call Girls Whitefield Just Call 7001305949 Top Class Call Girl Service AvailableCall Girls Whitefield Just Call 7001305949 Top Class Call Girl Service Available
Call Girls Whitefield Just Call 7001305949 Top Class Call Girl Service Available
 
Housewife Call Girls Hsr Layout - Call 7001305949 Rs-3500 with A/C Room Cash ...
Housewife Call Girls Hsr Layout - Call 7001305949 Rs-3500 with A/C Room Cash ...Housewife Call Girls Hsr Layout - Call 7001305949 Rs-3500 with A/C Room Cash ...
Housewife Call Girls Hsr Layout - Call 7001305949 Rs-3500 with A/C Room Cash ...
 
College Call Girls Pune Mira 9907093804 Short 1500 Night 6000 Best call girls...
College Call Girls Pune Mira 9907093804 Short 1500 Night 6000 Best call girls...College Call Girls Pune Mira 9907093804 Short 1500 Night 6000 Best call girls...
College Call Girls Pune Mira 9907093804 Short 1500 Night 6000 Best call girls...
 
Call Girls Hsr Layout Just Call 7001305949 Top Class Call Girl Service Available
Call Girls Hsr Layout Just Call 7001305949 Top Class Call Girl Service AvailableCall Girls Hsr Layout Just Call 7001305949 Top Class Call Girl Service Available
Call Girls Hsr Layout Just Call 7001305949 Top Class Call Girl Service Available
 
Call Girls Jp Nagar Just Call 7001305949 Top Class Call Girl Service Available
Call Girls Jp Nagar Just Call 7001305949 Top Class Call Girl Service AvailableCall Girls Jp Nagar Just Call 7001305949 Top Class Call Girl Service Available
Call Girls Jp Nagar Just Call 7001305949 Top Class Call Girl Service Available
 
Mumbai Call Girls Service 9910780858 Real Russian Girls Looking Models
Mumbai Call Girls Service 9910780858 Real Russian Girls Looking ModelsMumbai Call Girls Service 9910780858 Real Russian Girls Looking Models
Mumbai Call Girls Service 9910780858 Real Russian Girls Looking Models
 
Call Girls Service Nandiambakkam | 7001305949 At Low Cost Cash Payment Booking
Call Girls Service Nandiambakkam | 7001305949 At Low Cost Cash Payment BookingCall Girls Service Nandiambakkam | 7001305949 At Low Cost Cash Payment Booking
Call Girls Service Nandiambakkam | 7001305949 At Low Cost Cash Payment Booking
 

Growth measures in Clinical Practice

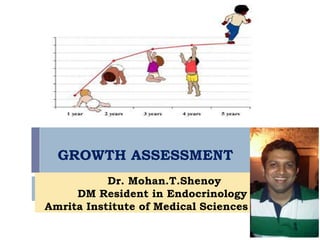
  • 1. GROWTH ASSESSMENT Dr. Mohan.T.Shenoy DM Resident in Endocrinology Amrita Institute of Medical Sciences
  • 2. Objectives of this study module      Why should we assess growth? What are the parameters ? How to interpret ? When to measure? Clinical implications
  • 3. INTRODUCTION  Growth and development are sometimes used interchangeably.  Growth is defined as net increase in the size or mass of tissues. It is largely due to multiplication of cells,increase in the intracellular substance (quantitative )  Development is defined as maturation of functions and acquisition of skills. (qualitative growth)    Early childhood : Cognitive growth and development difficult to differentiate from neurologic and behavioural maturation. Later childhood, it can be measured by communicative skills and cognitive abilities influenced by the physical, emotional and social environment. Myelination of the nervous system and denotes acquistion of a variety of competences for optimal functioning of the individual.
  • 4. The ICP growth model for height for boys (Karlberg, 1989)
  • 5. Changes in bodily proportions with age Predictable Sequence -Cephalo-caudal (head down to toes) - Proximodistal (center of the body to peripheral) - General to specific
  • 6. Principles of Growth 1. Continous process from conception onward Orderly - definite time limits for growth. Any time lost during a rapid growth period may prevent catch-up growth. 2. Unique for each individual - genetic and environment factors 3. Growth is governed by complex chain of hormonal interactions. The growth in the first year is mainly controlled by inherent potential of the cells and later by several factors (environmental and genetic). 4. First 3 years of life, curvilinear pattern ; Later it is linear.
  • 7. Principles of Growth  5. Growth spurts occur in late foetal period ; pubertal period. It is a dynamic process     Phase I – Hyperplasia Phase II - Hyperplasia + Hypertrophy Phase III - Hypertrophy alone Phase IV – Maturity • 6. Growth does not follow normal distribution curve. • 7. Each stage of G&D is affected by the preceding types of development ;
  • 8. Differential growth • Each child grows in his/her own unique way. • Not all body parts grow in the same rate at the same time  CNS : Neuronal division essentially complete by 1 year,  Bone, Muscle, and Fat cells continue to divide until later in childhood.  Other - Skin, gastrointestinal epithelial cells, and liver retain the capacity for hyperplasia throughout life. • Don’t progress at the same rate (↑ periods of GR in early childhood and adolescents & ↓ periods of GR in middle childhood)
  • 9. Stages of Growth and Development  Infancy  Neonate   Birth to 1 month  Toddler   1-3 years Preschool  3-6 years School age   1 month to 1 year Early Childhood Middle Childhood  Infancy    6 to 10 years (Girls) 6 to 12 years (Boys)  Late Childhood (Adolescent)  Prepubescent : 10-12 yrs () 12-14 yrs ()  Pubescent : 12- 14 yrs(ƒ); 14-16 yrs ()  Post Pubescent : 14 -18 yrs(ƒ); 16- 20 yrs ()
  • 10. MEASUREMENT PARAMETERS Postnatal growth patterns of normal children are well characterized, resulting in several clinical parameters for assessment of growth. 1. Linear growth (Length/Height) 2. Weight and body mass index 3. Weight/Height 4. Head circumference ; HC/CC ratio 5. Mid arm circumference 6. Body proportions (arm span and upper-to-lower segment ratio) 7. Growth velocity 8. Growth patterns 9. Dentition 10. Bone Age
  • 12.
  • 13. Calculation formulae Weight gain •Newborn1st 3 months - 200 gm/ week •Next 3 months – 150 gm/ week •Next 6 months – 100 gm/ week •Doubles by 4 months; Triples by 1 year •Quadruples by 2 years; •Thereafter 2kg /yr added on till 6 years •Threafter 3 kg/yr added till puberty Length gain Doubles ( ie.. 100 cm) by 4 years 6 cm / year till puberty Triples by 12 years Head circumference 1st 3 months: 2cm/month Next 3 months: 1cm/month Next 6 months : 0.5 cm/month
  • 14. Weight measurement  Weighing scales are of 3 types:  A) Beam balance    B) Spring Balance    Platform scale Beam scale/ TANSI scale Salters weighing scale Bathroom scale C) Electronic scale Measure to the nearest 10 gm for infants and 100 gm for children. Weighing together with mother.
  • 15. Weight categorisation/ classification IAP Classification system Normal: > 80% of expected Wt/Age Grade IV PEM < 50 % of expected Wt /Age Grade II PEM : 61- 70 % of expected Wt /Age Grade I PEM : 71- 80 % of expected Wt /Age Grade III PEM : 51- 60 % of expected Wt /Age
  • 16. Welcome trust classification of PEM (1970) >80% of expected weight Normal 60 – 80% of expected weight With edema : Kwashiorkor Without edema : Underweight <60% of expected weight With edema: Marasmic kwashiorkor Without edema : Marasmus Other systems of classification : Gomez and Jellife’s
  • 17. LENGTH/ HEIGHT Below 2 yrs- supine length with infantometer. For older children- Harpenden Stadiometer
  • 18.
  • 19. Prerequisites  Without footwear  Heels & back touching the wall  Looking straight ahead in frankfurt plane.  Gentle but firm pressure upwards applied to the mastoids from underneath  Record to last 0.1cm
  • 20. Sitting height Equipment: sitting base of a known height (e.g., 50 cm x 40 cm x 30 cm) and a wall-mounted stadiometer Technique: The child is placed as erect as possible with buttocks, shoulders, and head in contact with backboard of the stadiometer. Total height is measured. The height of the sitting surface is then subtracted from the total height. Plotting and Interpretation: The measurement can be plotted on the CDC charts for stature-for-age. Even if measurements fall below the 5th percentile, they establish a growth pattern over time.
  • 21. Height measurements       Iliac Height (IH) The distance between the summit of the iliac crest and the floor. Subischial Leg Length (SLL) The difference between stature and sitting height. It assumes that in a seated position the proximal landmark corresponds to the hip joint, which is very difficult to locate. Useful to measure upper to lower body proportions
  • 22.
  • 23. Calculation of Target Height and Target Height Centile Measure the parent’s heights and make a note of their heights on the chart. Calculate the child’s target height (TH) and plot it at 18 years and mark it with an arrow on the growth chart. Cowell CT. Short Stature. In: Clinical Pediatric Endocrinology, 3rd edn. Ed. Brook CGD. London, Blackwell Science, 1995; pp 136-172. This represents the child’s projected height and the target range is produced by plotting two points 7.5 cms above and below for a boy and 6 cm above and below for a girl (representing the 10th and the 90th centile for that child).
  • 24. WATERLOW Classification Weight Waterlow >= 80 % Classification Height for >= 90 % Normal Age < 90 % Stunted for Height < 80 % Wasted Wasted and stunted
  • 25. WHO Classification Wt/ Age Ht/ Age Wt/Ht Intepretation Normal Normal Normal Normal Decreased Normal Decreased Acute Malnutrition Decreased Decreased Normal Chronic Malnutrition Decreased Decreased Decreased Acute on Chronic Malnutrition
  • 26. GROWTH VELOCITY  The most critical factor in evaluating the growth is determining GROWTH VELOCITY.  Observation of child’s height pattern in the form of “CROSSING PERCENTILE LINES” on a linear growth curve is the simplest method of observing abnormal growth velocity.  Atleast 3 measurements with preferably 6 months interval in between is necessary to comment on growth pattern.
  • 27. Growth patterns **  From the end of infancy until puberty begins, growth normally proceeds along a channel that closely corresponds to a given height-attained percentile on crosssectional growth standards. A child normally establishes this channel by 2 to 3 years age, although, on rare occasions, a gradual drift by as many as 40 percentile positions in height attained may occur over a period of several years in normal children.  The velocity of growth (cm per year) actually decelerates slightly during this period and averages about 6 cm per year in midchildhood.However, normal children cross height-velocity percentiles to maintain their height channel.  A growth velocity that is consistently along the third percentile will lead to a subnormal height. The growth channel seems to be genetically determined. Children grow as if to reach a genetically predetermined height.  This target height, which represents the child’s genetic potential, can be approximated by calculating the MPH.
  • 28. Weight Velocity 1st year : 6 kg Pre-school: 2kg/year School : 3 kg/yr till puberty
  • 29. Growth velocity  Sequential height measurements and can be plotted on growth velocity charts.  A minimum interval of 6 months is needed for meaningful assessments of growth velocity
  • 30. Head Circumference Brain growth is rapid during infancy and it is unaffected by mild to moderate degree of malnutrition Should not be measured within 24 hrs after birth Bony land marks – superior orbital ridge (ant), external occipital protuberance (post) Place the measuring tape around the largest circumference of the infant's head, across the occiput and the forehead.
  • 31. Chest circumference Not used universally Useful measurement for comparison with the head circumference when a problem is suspected with either the head size or chest size. Wrap the measuring tape around the infant's chest ideally taken at xiphisternum / substernal notch just below the nipple line, midway between inspiration and expiration firmly but not tight enough to cause an indentation of the skin. read to the nearest 0.5 cm
  • 32. Internipple distance  Trunk physical parameter as in special situations  Internipple distance calculated by using Sliding callipers with child at rest and at end of expiration.  Internipple Index = Internipple distance X 100 Chest circumference Value > 28 % diagnostic
  • 33. Upper-to-Lower Segment Ratio The upper-to-lower segment ratio is calculated when a child's body may have inappropriate proportions between the head and trunk to the extremities. Measure the lower body segment (distance from the symphysis pubis to the floor when a child stands). Calculate the upper body segment by subtracting the lower body segment from the total height. Then divide the upper body segment by the lower body segment to calculate the ratio. Expected ratios by age are ♦ At birth—1.7 Increase: Rickets, achondroplasia, Untreated hypothyroidism ♦ At 3 years—1.3 Decrease: spondyloepiphyseal dysplasia, vertebral anomalies ♦ After 7 years—1.0 By about 11 years of age, adult proportions are reached A higher upper-to-lower body segment ratio than expected may be associated with dwarfism or bone disorders.
  • 34. Individual components  Arm length – Acromion to tip of 3rd finger with arm in full extension and parallel to the body.  Upper segment of arm – Acromion to Olecranon with elbow bent at 90Âş  Foream / Lower segment of arm – Olecranon process to distal end of styloid process of radius with elbow bent at 90Âş  Hand length – Distal wrist crease to tip of 3rd finger  Palm length – Distal wrist crease to prox. Crease of 3rd finger
  • 35. Skeletal dysplasia  Rhizomelia (Upper arm / Proximal shortening)  Mesomelia (Forearm / Middle shortening)  Acromelia (Palm &Fingers / Distal shortening) Acromesomelia (Forearm, Palm, fingers /Middle & distal) Micromelia (Whole upper limb shortening)  
  • 36.
  • 37.
  • 38. Percentile Rank Nutrition- Related Health Concern Anthropometric Index Percentile Cut-off Value Nutritional Status Indicator BMI-for-Age ≥ 95th Obese BMI-for-Age ≥ 85th and < 95th Overweight Weight-for-Length < 5th Underweight Head Circumference-for-Age < 5th and > 95th Developmental Problems Growth parameters and their interpretation for the World Health Organization charts
  • 39. Age independent Anthropometric indicators  Labile tissues like subcutaneous fat and muscle are more reduced in malnutrition than skeleton  Bangle test: If a bangle of 4 cm Internal diameter crosses elbow Shakir’s tape: Plastic tape with color zones – Red if < 12.5 cm Quac stick : Rod with markings for Height and Arm circumference. Nabarrow’s thinness chart : Graphic chart for Wt/Ht     MAC:HC (Kanawati) ratio: 0.28- 0.314 : Mild ; <0.249 : Severe MAC : Height ratio : Normal if >0.32 ; Severe malnutrition if <0.29  Ponderal index : Weight (in kg)/ length 3 (in cm) x 100 ;  Normal if >2.5 ; Symmetrical IUGR 2.0 -2.5 ; Asymmetric IUGR < 2.0  Dughadale ratio : Weight (in kg)/ height 1.6 ; Normal if >0.79 ;
  • 40. Mid Upper arm circumference (MUAC) Steps of MUAC measurement Ask the mother to remove any clothing that covers the child’s arm. If possible the child should stand erect and sideways to the measurer. Estimate the mid-point of the left arm. Straighten the child’s arm and wrap the tape around at the mid-point. Make sure that the numbers are right side up. Make sure the tape is flat around the skin. Inspect the tension of the tape on the child’s arm. Make sure the tape has the proper tension and is not too tight or too loose. Repeat any step as necessary. When the tape is in the correct position and correct tension on the arm, read and call out the measurement to the nearest 0.1 cm. Immediately record the measurement.
  • 41. Skinfold thickness Skinfold thickness by age and sex, as measured by Harpenden skinfold calipers over triceps and under scapula. The lines shown are the 50th percentiles for British children. Scale is in millimeters on the left side and logarithmic transformation units on the right side. Usually gives a better estimate of adiposity, although considerable experience is needed for accuracy, and variability in fat distribution may confound the measurement.
  • 42. Waist circumference and waist-hip ratio:  Both waist circumference (WC) and waist-hip ratio are indicators of visceral fat or abdominal obesity in children and adolescents age 2–19 years.  Increased visceral adiposity measured by WC increases the risk of obesity-related morbidity and mortality.  WC should be measured at the highest point of the iliac crest when the individual is standing and at minimal respiration.  Waist-hip ratio is calculated as a ratio of waist circumference (cm) and hip circumference (cm).
  • 43. Males 200 78 +2 190 0 170 -1 Height (cm) Growth should be measured and compared statistical norms in a standard fashion on 70 66 -2 160  74 +1 180 62 with 150 140 58 54 growth charts. 130 50 120 46 110 Growth charts are visible display of child’s physical growth and development. 42 100 38 90 34 80 30 70 2 4 6 8 10 12 Age (y) 14 16 18 20 Also called as “road-to-health" chart. It was first designed by David Morley and was later modified by WHO.  Growth is assessed by plotting accurate measurements on growth charts and comparing each set of measurements with previous measurements obtained at health maintenance visits or at other visits if there is a concern over the child's growth pattern.  Serial measurements more useful than single measurements to detect deviations from a particular child's growth pattern even if the value remains within statistically defined normal limits (percentiles) Height (in) GROWTH MONITORING
  • 44. Growth standard vs. reference Rate of growth of children is one of the finest indicators of the health of a community. Growth monitoring followed by suitable action prevents illness, malnutrition and even death. It provides reassurance about child’s health and prevents parental anxiety. A growth reference simply describes the growth of a sample of individuals, whereas a standard describes the growth of a healthy population and suggests an aspirational model. WHO growth charts are growth standards. A reference is representative of the existing growth pattern of children and allows us to study the secular trends in height, weight and obesity. On community and national level it helps identify children at risk of morbidity and mortality. It thus helps in implementation of national programmes for nutritional and medical interventions like supplementary feeding, foods to vulnerable group, underprivileged school children, etc. It is also a method to evaluate programs for improving child health and nutrition and can form the basis for policy making.
  • 45. Z-score  It is another way of expressing a child’s height in comparison with the mean for child’s age. Child’s Height- Mean Height for age in the reference chart 1 SD of height for that age in the reference data The resultant value is a number without units. Advantage: Children of different ages and gender can be compared
  • 46. GROWTH CHARTS AND REFERENCE DATA  Ideally constructed growth charts depict the longitudinal growth of a cohort of children from birth to maturity. Many logistic difficulties as it would entail a prolonged study.  50th percentile of Harvard Standards (1970s) is considered 100% for Indian children. If a child is at 5th percentile it means 5% children of that age have less weight or growing less fast than this child. Many international reference standards NCHS (US National centre for Health Statistics, Boston) have been obtained from cross-sectional or semi-longitudinal studies ; Pubertal spurt gets blunted in these charts. Separate reference standards for different ethnic groups derived from studying growth of children living in an optimal environment with adequate nutrition.
  • 47. BACKGROUND  The ICMR undertook a nationwide cross sectional study during 1956-1965 to establish indian referance charts. Irrelevant now as they were done on lower socio-economic class.  Indian context Multicenter study : Agarwal et al. (1992,1994); Khadilkar et al. (2009); Marwaha et al. (2011)  The growth charts compiled by Agarwal et al were based on affluent urban children from all major zones of India measured 1989-1991. The data is now 20 years old.  WHO recommends that each country should update its growth references every decade and hence new growth references were produced in 2009.  Khadilkar et al have published the growth charts on affluent children 5-18 years and have also compared the growth of 2-5 years old indian children with the new WHO growth charts. These are the most modern national growth references available now at present.
  • 48. WHO growth chart: 8500 children - 6 countries (2006)
  • 49. MGRS study design Longitudinal (0-24 months) year 1 year 2 year 3 Cross-sectional (18-71 mo) After the age of 5 years, the WHO extended the MGRS chart till 18 yrs by appending NCHS data and extrapolating the MGRS percentile lines. Many countries choose to use WHO charts only for toddlers {upto 2 yrs in USA} [upto 4 yrs in UK] and their own national charts for older children. WHO Multicentre Growth Reference Study (2006)
  • 50. WHO - MGRS / reference indicators n Attained growth • • • • • • • • n weight-for-age length/height-for-age weight-for-length/height head circumference-for-age mid-upper arm circumference-for-age triceps skinfold-for-age subscapular skinfold-for-age body mass index-for-age Velocity • weight • length • head circumference • arm circumference • body mass index
  • 51. GROWTH MONITORING  Deviations in growth patterns may be nonspecific or may be important indicators of serious and chronic medical disorders.  An accurate measurement of length/height, weight, and head circumference should be obtained at every health supervision visit.
  • 52. Time schedule child anthropometry Frequency No. of visits Once 1 4 Bi-weekly Monthly 10 Bi-monthly 6 Measurement Weight, length, head circumference Time frame Birth Weeks 2-8 3-12 months 14-24 months Arm circumference Skinfold thicknesses 3-12 months Monthly 14-24 months Bi-monthly 10 6 WHO Multicentre Growth Reference Study (2006)
  • 53. Criteria for referral Indian Pediatrics 2007; 44:187-197 IAP Growth Monitoring Guidelines for Children from Birth to 18 Years (i) First three years † Length/height, weight or head circumference below 3rd percentile or above 97th percentile on growth chart. † Crossing of two major percentile lines (upward or downward) e.g., going from above 75th percentile to below 50th percentile on height or weight chart. † A child below or above mid parental range for height/length † Weight loss or lack of weight gain for a month in the first 6 months. † Absence of weight gain for 2-3 months from 6-12 months of age. † Micropenis. † Unilateral or bilateral undescended testis. † Ambiguous genitals. (ii) Three to nine years Âť Length/Height below 3rd percentile or above 97th percentile on growth chart. Âť Crossing of two major percentile lines (upward or downward) Âť A child below or above mid parental range for height . Âť BMI over the 85th percentile at all ages. Âť Rate of growth less than 5 cm/year.
  • 54. Criteria for referral Indian Pediatrics 2007; 44:187-197 IAP Growth Monitoring Guidelines for Children from Birth to 18 Years (ii) Three to nine years (Continued) ÂťGirls with axillary, pubic hair growth or breast budding before 8 years and boys with axillary, pubic hair growth, genital growth or and testicular enlargement before 9 years. ÂťChildren with craniospinal irradiation or surgery for brain tumors. ÂťMicropenis. (iii) Nine to eighteen years Height below 3rd percentile or above 97th percentile on growth chart. Crossing of two major percentile lines (upward or downward) A child below or above mid parental range for height. BMI over the 85th percentile at all ages. Arrest at the same stage of puberty for more than 2 years. Micropenis. Unilateral or bilateral Gynecomastia in boys. Hirsuitism and Menstrual irregularities in girls. Delayed puberty that is girls with no breast budding by 14 years or no menarche by 15 years and boys with no signs of puberty by 16 years.
  • 55.
  • 56.
  • 57.
  • 58.
  • 59.
  • 61.
  • 62. BMI Changes with Age Age BMI Value 2 4 9 13 19.3 17.8 21.0 25.1 Example: Child’s growth tracking along 95th percentile
  • 63. Body mass index for boys and girls 2-17 years. Redesigned by Agarwal KN, Agarwal DK, Bansal AK for the Indian Academy of Pediatrics
  • 66.
  • 67.
  • 68.
  • 69.
  • 70.
  • 71.
  • 72.
  • 73.
  • 74.
  • 75. G & P Method Patient’s film is compared with the standard of the same sex and nearest age It is next compared with adjacent standard, both older and younger to get the closest match
  • 76. TW Method - 13 Bones
  • 77. Bone age Better correlate with SMR Predictor of future height Delayed bone age Constitutional short stature Hypothyroidism Celiac disease GH deficiency
  • 78. Bone age: an algorithm for boys Unnikrishnan AG, Kumar H, Jayakumar RV. Bone age in a minute: a simple algorithm. Amrita J Med 2006; 2:39-41
  • 79. Bone age: an algorithm for girls Unnikrishnan AG, Kumar H, Jayakumar RV. Bone age in a minute: a simple algorithm. Amrita J Med 2006; 2:39-41
  • 80. CAVEATS TO INFORMATION IN BONE AGE Subjectivity: Interobserver variation Normal children radiographs comparability ; Non-applicability to spl. context- skeletal dysplasias, genetic causes . BAYLEY-PINNEAU and RWT (Roche,Wainer,Thissen) CHARTS
  • 82. Dental development  Dental development includes mineralization, eruption, and exfoliation.  Initial mineralization begins as early as the second trimester (mean age for central incisors, 14 wk) and continues through 3 yr of age for the primary (deciduous) teeth and 25 yr of age for the permanent teeth.  Mineralization begins at the crown and progresses toward the root.  Eruption begins with the central incisors and progresses laterally.  Exfoliation begins at about 6 yr of age and continues through 12 yr of age. Eruption of the permanent teeth may follow exfoliation immediately or may lag by 4-5 mo. The timing of dental development is poorly correlated with other processes of growth and maturation.
  • 83. Growth charts for special populations:  a. Down syndrome:  b. Turner syndrome:  c. Achondroplasia:  d. Prader-Willi Syndrome  e. Silver–Russell syndrome
  • 84. Down syndrome Height and weight centiles for boys with trisomy 21 syndrome aged 2–18 years. The gray-shaded areas represent the comparable values for the 3rd to 97th centiles for normal children. Adapted from Cronk C, Crocker A,Peuschel S et al. Growth charts for children with Down syndrome. Pediatrics 1988; 81: 102–10.
  • 85. Turner syndrome Height centiles for girls with untreated Turner syndrome aged 1–20 years. The gray-shaded area represents the 3rd to 97th centiles for normal girls. Pubertal staging is for normal girls Adapted from Lyon A, Preece M, Grant D. Growth curves for girls with Turner syndrome. Arch Dis Child 1985; 60: 932–935.
  • 86. Achondroplasia Height centiles for boys with achondroplasia (mean Âą 2 SD) compared with normal standard curves (dashed lines). Data derived from 189 males. Adapted from Horton W, Rotter J, Rimoin D et al. Standard growth curves for achondroplasia. J Pediatr 1978; 93: 435–8.
  • 88. Silver–Russell syndrome Height centiles for boys with Silver–Russell syndrome .The grayshaded area indicates normal boys Âą2 standard deviations (SD). Adapted from Wollman H, Kirchner T, Enders H et al. Growth and symptoms in Silver–Russell syndrome: review on the basis of 386 patients. Eur J Pediatr 1995; 154: 958–68.
  • 89.
  • 90. Always Perform Sexual Maturity Rating
  • 91.
  • 92.
  • 93. Sequence of maturational events MALES FEMALES Adapted from Marshall WA,Tanner JM:Variations in the pattern of pubertal changes in boys. Arch Dis Child 1970;45:13
  • 94.