SlideShare une entreprise Scribd logo
1  sur  9
APPENDIX
h) Analyse LBS Bina Group Berhad's financial condition for the FY2015, evaluating trends in
the last 2 years (FY2013, FY2014) in the company's
FY2013 FY2014 FY2015
RM RM RM
1 Current Ratio X 1.52 1.46 1.43
2 Quick Ratio X 1.48 1.44 1.34
3 Inventory Turnover X 16.17 35.00 5.81
4 Average Collection Period Days 189.19 188.56 198.15
5 Average Payment Period Days 457.07 410.31 491.22
6 Total Asset Turnover X 0.27 0.30 0.28
7 Debt Ratio % 56.58% 56.67% 58.42%
8 Times Interest Earned X 29.14 5.36 5.88
9 Fixed Charge Coverage Ratio 4.06 2.40 4.47
10 Gross Profit Margin % 31.60% 31.78% 34.58%
11 Operating Profit Margin % 82.86% 18.88% 18.86%
12 Net Profit Margin % 74.47% 10.04% 10.36%
13 Return on Total Assets % 19.77% 3.02% 2.90%
14 Return on Common Equity % 45.53% 6.98% 6.96%
15 Earning Per Share RM 96.09 sen 14.06 sen 14.09 sen
16 Price/ Earning (P/E) X 1.53 11.10 10.00
17 Price/ Book Ratio (P/B) X 0.69 0.81 0.75
ITEM UNITRATIO
APPENDIX
h) Analyse LBS Bina Group Berhad's financial condition for the FY2015, evaluating trends in the last 2 years (FY2013,
FY2014) in the company's
FY2013 FY2014 FY2015
RM RM RM
1 925,492,766 1,223,704,038 1,332,051,755
609,599,483 839,094,406 934,070,044
X = 1.52 = 1.46 = 1.43
2 902,917,650 1,210,679,947 1,255,514,483
609,599,483 839,094,406 934,070,044
X = 1.48 = 1.44 = 1.34
3 364,955,568 455,874,300 445,041,756
22,575,116 13,024,091 76,537,272
X = 16.17 = 35.00 = 5.81
4 174,316,241 181,575,618 196,123,831
921,404.123 962,933.951 989,786.784
Days = 189.19 = 188.56 = 198.15
5
Days = 457.07 = 410.31 = 491.22
6 533,532,722 668,265,030 680,295,861
2,009,812,670 2,219,634,894 2,434,777,794
X = 0.27 = 0.30 = 0.28
7 1,137,172,437 1,257,780,460 1,422,405,095
2,009,812,670 2,219,634,894 2,434,777,794
% = 56.58% = 56.67% = 58.42%
8 442,098,118 126,171,744 128,300,833
15,170,850 23,533,952 21,831,551
X = 29.14 = 5.36 = 5.88
9
566,601,544 176,019,511 137,193,748
139,674,276 73,383,719 30,724,466
= 4.06 = 2.40 = 4.47
10 168,577,154 212,390,730 235,254,105
533,532,722 668,265,030 680,295,861
% = 31.60% = 31.78% = 34.58%
11 442,098,118 126,171,744 128,300,833
533,532,722 668,265,030 680,295,861
% = 82.86% = 18.88% = 18.86%
12 397,323,654 67,093,761 70,495,985
533,532,722 668,265,030 680,295,861
% = 74.47% = 10.04% = 10.36%
13
397,323,654 67,093,761 70,495,985
2,009,812,670 2,219,634,894 2,434,777,794
% = 19.77% = 3.02% = 2.90%
= =
= = =
= = =
= = =
= = =
= = =
= = =
= = =
=
:
ITEM
Average
Payment Period
:
Total Asset
Turnover
:
RATIO
Inventory
Turnover
:
:
Operating Profits
Interest Expense
Operatings Profits
Sales
Net Income
Debt Ratio :
Times Interest
Earned
:
Net Profit Margin :
Return on Total
Assets (ROA)
:
Earning Available for Common
Stockholders
Total Assets
Sales
Fixed-Charge
Coverage Ratio
:
Gross Profit
Margin
:
Operating Pofit
Margin
UNITFORMULA
EBIT + Fixed Charge (before
taxes)
Fixed Charge (before taxes) +
Interest
Sales - Cost of Good Sold
Sales
= = =
= = =
=
Current Assets
Current Liabilities
Cost of Good Sold
Inventory
Sales
Total Assets
Total Debt
Total Assets
Account Receivable
Annual Credit Sales / 365
Current Assets - Inventory
Average
Collection Period
Account Payble
Account Purchase
x 365
= =Current Ratio :
Quick Ratio :
Current Liabilities
= = =
= = =
457,014,224
364,955,568
x 365
512,464,914
455,874,300
𝑥 365
598,944,944
445,041,756
𝑥 365
APPENDIX
h) Analyse LBS Bina Group Berhad's financial condition for the FY2015, evaluating trends in the last 2 years (FY2013,
FY2014) in the company's
FY2013 FY2014 FY2015
RM RM RM
ITEM RATIO UNITFORMULA
14 397,323,654 67,093,761 70,495,985
872,640,233 961,854,434 1,012,372,699
% = 45.5% = 7.0% = 7.0%
15 392,662,537 69,929,925 76,074,430
408,618,153 497,413,874 539,759,293
RM = 0.9610 = 0.1406 = 0.1409
16 1.47 1.56 1.41
0.96 0.14 0.14
X = 1.53 = 11.10 = 10.00
17 1.47 1.56 1.41
2.14 1.93 1.88
X = 0.69 = 0.81 = 0.75
= = =
= =
= = =
=
=
==
Market Price Per Share
Earnings Per Share
Market Price Per Share
Equity Book Value Per Share
Number of Share of Common
Stock Outstanding
Return on
Common Equity
:
Earning Per
Share
:
Price/ Earning
(P/E)
:
Price/ Book Ratio
(P/B)
:
Earning Available for common
stockholders
Net Income
Total Common Equity
APPENDIX
Balance Sheet
FY2013 FY2014 FY2015
RM RM RM
Non-Current Assets
Property, plant and equipment 212,749,463 214,444,731 240,941,611
Capital work-in-progress 3,306,077 208,447 6,229,079
Land and property development costs 392,462,614 347,549,001 515,026,439
Investment properties 6,524,170 33,197,563 33,767,090
Investment in subsidiary compaines - - -
Investment in associated companies 2,993,256 13,868,068 13,879,340
Trade receivables 13,726,217 - -
Promissory notes 219,098,880 159,661,639 100,498,924
Other investments 138,449,101 136,869,815 94,983,631
Goodwill on consolidation 94,154,754 87,142,327 84,217,235
Deferred tax assets 855,372 2,989,265 13,182,690
Total Non-Current Assets 1,084,319,904 995,930,856 1,102,726,039
Current Assets
Land and property development costs 237,730,432 383,729,714 437,734,614
Inventories 22,575,116 13,024,091 76,537,272
Amount owing by customers on contracts - 3,693,953 56,017
Accrued bulling in respect of propety
development cost 71,047,149 123,689,261 149,080,582
Trade receivables 174,316,241 181,575,618 196,123,831
Others receivables 23,496,646 63,631,041 92,873,289
Promissory note 100,573,440 85,866,581 105,523,704
Other investments - 27,070,770 38,488,161
Amount owing by subsidiary companies - - -
Tax recoverable 5,712,285 8,984,728 8,042,029
Fixed deposits with licensed banks 152,756,932 160,983,954 33,471,075
Cash held under Housing Developmeny Accounts 57,977,521 89,132,344 87,735,381
Cash and bank balances 78,610,013 82,321,983 106,385,800
924,795,775 1,223,704,038 1,332,051,755
Non-Current asstes classified as held for sale 696,991 -
Total Current Assets 925,492,766 1,223,704,038 1,332,051,755
Total Assets 2,009,812,670 2,219,634,894 2,434,777,794
Equity
Share capital 479,651,357 538,298,257 551,437,117
Share premium 26,641,899 44,586,608 48,298,035
Treasury Shares (9,541,438) (14,678,685) (8,634,411)
Other reserves (42,942,110) (38,422,577) (24,605,115)
Retained profits/ (Accumulated losses) 415,847,590 439,277,991 465,165,545
Equity attributable to owners of the Parent 869,657,298 969,061,594 1,031,661,171
Non-controlling interest 2,982,935 (7,207,160) (19,288,472)
Total Equity 872,640,233 961,854,434 1,012,372,699
APPENDIX
Balance Sheet
FY2013 FY2014 FY2015
RM RM RM
Non-Current Liabilities
Islamic Securities 30,000,000 - -
Bank borrowings 287,969,337 274,566,258 287,939,163
Trade payables 119,328,319 50,854,138 93,613,370
Other payables 47,432,572 48,591,303 56,228,935
Finance lease payables 3,303,044 3,688,384 5,099,292
Amount owing to a subsidiary company - - -
Deferred tax liabilities 39,539,682 40,985,971 45,454,291
Total Non-Current Liabilities 527,572,954 418,686,054 488,335,051
Current Liabilities
Amount owing to customers on Contracts 3,612,851 5,093,951 5,602,800
Progress billing in respect of property
development costs 77,221,417 116,799,940 45,209,124
Trade payables 199,457,872 277,401,479 315,942,280
Other payables 256,536,875 234,037,527 281,302,004
Bank overdrafts 761,587 13,263,668 43,665,940
Finance lease payables 1,019,477 1,025,908 1,700,660
Islamic Securities - 10,000,000 -
Bank borrowings 60,035,307 173,964,415 229,765,752
Amount owing to subsidiary companies - - -
Tax payables 10,954,097 7,507,518 10,881,484
Total Current Liabilities 609,599,483 839,094,406 934,070,044
Total Liabilities 1,137,172,437 1,257,780,460 1,422,405,095
Total Equity and Liabilities 2,009,812,670 2,219,634,894 2,434,777,794
APPENDIX
Income Statement
FY2013 FY2014 FY2015
RM RM RM
Revenue 533,532,722 668,265,030 680,295,861
Cost of sales (364,955,568) (455,874,300) (445,041,756)
Gross Profit 168,577,154 212,390,730 235,254,105
Other income 359,117,909 29,795,333 28,072,285
Admistrative and operating expenses (85,596,945) (116,014,319) (135,025,557)
Profit from operations 442,098,118 126,171,744 128,300,833
Finance costs (15,170,850) (23,533,952) (21,831,551)
Share of profit in associated companies (25,347) 1,493,262 1,618,371
Profit before taxation 426,901,921 104,131,054 108,087,653
Taxation (32,886,164) (37,035,293) (37,591,668)
Profit from continuing operations 394,015,757 67,095,761 70,495,985
Discontinued operations
Profit from discontinued operations 3,307,897 - -
Net profit for the financial year 397,323,654 67,095,761 70,495,985
Other comprehensive income, net of tax:
Exchange transiation differences for
foreign operations 13,682,663 29,514,783 64,911,675
Transactions with non-controlling interests 271,036 - -
(Loss)/ Gain on revaluation of available-for-
sale financial asstes - 4,646,143 (21,232,278)
Reclassification adjustment for disposal of
available-for-sale-financial asstes - 1,465,100 1,888,206
13,953,699 35,626,026 45,567,603
Total comprehensive income for the
financial year 411,277,353 102,721,787 116,063,588
Net profit for the financial year
attributable to :
Owners of the Parent 392,662,537 69,929,925 76,074,430
Non-controlling interests 4,661,117 (2,836,164) (5,578,445)
397,323,654 67,093,761 70,495,985
APPENDIX
Income Statement
FY2013 FY2014 FY2015
RM RM RM
Total comprehensive income for the
financial year attributable to:
Owners of the Parent 399,978,862 106,711,661 126,835,601
Non-controlling interest 11,298,491 (3,991,874) (10,772,013)
411,277,353 102,719,787 116,063,588
Earnings per share attributable to owners
of the Parent (sen)
Basic earnings per share
Profit from continuing operations 95.40 14.06 14
Profit from discontinued operations 0.69 - -
Total 96.09 14.06 14.09
Diluted earnings per share
Profit from cotinuing operations 91.39 13.45 13.13
Profit from discontinued operations 0.66 - -
Total 92.05 13.45 13.13
APPENDIX
Earning Per Share
FY2013 FY2014 FY2015
RM RM RM
Net profit for the financial year attributable
to owners of the Parent (RM)
- continuing operations 389,839,892 69,929,925 76,074,430
- discontinued operations 2,822,645 - -
392,662,537 69,929,925 76,074,430
Weighted average number of ordinary
shares in issue
Ordinary shares in issue as at 1 January 386,552,557 479,651,357 538,298,257
Effect of ordinary shares issed during the year 29,858,404 27,097,602 7,650,033
Effect of trasury shares held (7,792,808) (9,335,085) (6,188,997)
Weighted average number of ordinary shares 408,618,153 497,413,874 539,759,293
as at 31 December
Basic earning per share (sen)
- continuing operations 95.40% 14.06% 14.09%
- discontinued operations 0.69% - -
96.10% 14.06% 14.09%
APPENDIX
Share Capital
FY2013 FY2014 FY2015
Number of Sharholders
Issued and fully paid-up capital : RM498,287,257* RM530,066,257* RM551,613,617*
No.of Shareholders : 6,301 6,127 5,966
Share
Market Price per Share * : 1.47 1.56 1.41
Equity Book Value per Share : 2.14 1.93 1.88
*Source from : https://finance.yahoo.com/quote/5789.KL/history?period1=1356969600&period2=
1388419200&interval=1d&filter=history&frequency=1d
Cash Flow
Changes in working capital
Trade receivables 27,239,262 18,147,184 16,427,273

Contenu connexe

Tendances

深圳大学 Stay real_长安汽车_决赛ppt
深圳大学 Stay real_长安汽车_决赛ppt深圳大学 Stay real_长安汽车_决赛ppt
深圳大学 Stay real_长安汽车_决赛pptGabriel Fong
 
Salary Survey Nov 2011
Salary Survey Nov 2011Salary Survey Nov 2011
Salary Survey Nov 2011Risman BizNet
 
Pl shree cement_04may15[1]
Pl shree cement_04may15[1]Pl shree cement_04may15[1]
Pl shree cement_04may15[1]IndiaNotes.com
 
ACC Q1FY15: Earnings mildly below expectation; outlook remains strong
 ACC Q1FY15: Earnings mildly below expectation; outlook remains strong ACC Q1FY15: Earnings mildly below expectation; outlook remains strong
ACC Q1FY15: Earnings mildly below expectation; outlook remains strongIndiaNotes.com
 
Comparative statement of reliance industries ltd
Comparative statement of reliance industries ltdComparative statement of reliance industries ltd
Comparative statement of reliance industries ltdvijay jha
 
Bnm analisis financiero banca comercial peru - dic 2000
Bnm   analisis financiero banca comercial peru - dic 2000Bnm   analisis financiero banca comercial peru - dic 2000
Bnm analisis financiero banca comercial peru - dic 2000gonzaloromani
 
Firstcall recommend Essel Propack, Q4FY15 net profit up 66.09% y/y to INR454.10m
Firstcall recommend Essel Propack, Q4FY15 net profit up 66.09% y/y to INR454.10mFirstcall recommend Essel Propack, Q4FY15 net profit up 66.09% y/y to INR454.10m
Firstcall recommend Essel Propack, Q4FY15 net profit up 66.09% y/y to INR454.10mIndiaNotes.com
 

Tendances (15)

financial accounting
financial accounting financial accounting
financial accounting
 
深圳大学 Stay real_长安汽车_决赛ppt
深圳大学 Stay real_长安汽车_决赛ppt深圳大学 Stay real_长安汽车_决赛ppt
深圳大学 Stay real_长安汽车_决赛ppt
 
Salary Survey Nov 2011
Salary Survey Nov 2011Salary Survey Nov 2011
Salary Survey Nov 2011
 
Pl shree cement_04may15[1]
Pl shree cement_04may15[1]Pl shree cement_04may15[1]
Pl shree cement_04may15[1]
 
Example print out-efm-de
Example print out-efm-deExample print out-efm-de
Example print out-efm-de
 
Engro foods 3
Engro foods 3Engro foods 3
Engro foods 3
 
STATE BANK OF INDIA-ANALYSIS by www.capitalheight.com
STATE BANK OF INDIA-ANALYSIS by www.capitalheight.comSTATE BANK OF INDIA-ANALYSIS by www.capitalheight.com
STATE BANK OF INDIA-ANALYSIS by www.capitalheight.com
 
ACC Q1FY15: Earnings mildly below expectation; outlook remains strong
 ACC Q1FY15: Earnings mildly below expectation; outlook remains strong ACC Q1FY15: Earnings mildly below expectation; outlook remains strong
ACC Q1FY15: Earnings mildly below expectation; outlook remains strong
 
Share valuation
Share valuationShare valuation
Share valuation
 
Comparative statement of reliance industries ltd
Comparative statement of reliance industries ltdComparative statement of reliance industries ltd
Comparative statement of reliance industries ltd
 
financial accounting
financial accounting financial accounting
financial accounting
 
Excel Model for Banking
Excel Model for Banking Excel Model for Banking
Excel Model for Banking
 
Bnm analisis financiero banca comercial peru - dic 2000
Bnm   analisis financiero banca comercial peru - dic 2000Bnm   analisis financiero banca comercial peru - dic 2000
Bnm analisis financiero banca comercial peru - dic 2000
 
credit-suisse Annual Report Part 3
credit-suisse Annual Report Part 3credit-suisse Annual Report Part 3
credit-suisse Annual Report Part 3
 
Firstcall recommend Essel Propack, Q4FY15 net profit up 66.09% y/y to INR454.10m
Firstcall recommend Essel Propack, Q4FY15 net profit up 66.09% y/y to INR454.10mFirstcall recommend Essel Propack, Q4FY15 net profit up 66.09% y/y to INR454.10m
Firstcall recommend Essel Propack, Q4FY15 net profit up 66.09% y/y to INR454.10m
 

Similaire à LBS Bina Group's Financial Trends

Similaire à LBS Bina Group's Financial Trends (20)

Williams sonoma model
Williams sonoma model Williams sonoma model
Williams sonoma model
 
Forcast Model
Forcast ModelForcast Model
Forcast Model
 
Financial Analysis of HBL and Faysal Bank
Financial Analysis of HBL and Faysal BankFinancial Analysis of HBL and Faysal Bank
Financial Analysis of HBL and Faysal Bank
 
2015 Financial Report
2015 Financial Report2015 Financial Report
2015 Financial Report
 
Project_Valuation.ppsx
Project_Valuation.ppsxProject_Valuation.ppsx
Project_Valuation.ppsx
 
Valuation Of ASHOK LEYLAND
Valuation Of ASHOK LEYLANDValuation Of ASHOK LEYLAND
Valuation Of ASHOK LEYLAND
 
ration analysis of wipro
ration analysis of wiproration analysis of wipro
ration analysis of wipro
 
Yes bank balance sheet
Yes bank balance sheetYes bank balance sheet
Yes bank balance sheet
 
Mock projection of Axis Bank
Mock projection  of   Axis BankMock projection  of   Axis Bank
Mock projection of Axis Bank
 
WACC.ppsx
WACC.ppsxWACC.ppsx
WACC.ppsx
 
06. equity valuation of lsi semiconductor (deb sahoo)
06. equity valuation of lsi semiconductor (deb sahoo)06. equity valuation of lsi semiconductor (deb sahoo)
06. equity valuation of lsi semiconductor (deb sahoo)
 
Bajaj finserv
Bajaj finservBajaj finserv
Bajaj finserv
 
Work sample
Work sampleWork sample
Work sample
 
EMAAR Properties - Company Profile
EMAAR Properties - Company ProfileEMAAR Properties - Company Profile
EMAAR Properties - Company Profile
 
Excel Model for Valuation of Natural Gas Firm
Excel Model for Valuation of Natural Gas FirmExcel Model for Valuation of Natural Gas Firm
Excel Model for Valuation of Natural Gas Firm
 
Sales comperison.pptx
Sales comperison.pptxSales comperison.pptx
Sales comperison.pptx
 
NTPC Financial Modelling
NTPC Financial ModellingNTPC Financial Modelling
NTPC Financial Modelling
 
Neslte India Ltd_Financial Model Working.pdf
Neslte India Ltd_Financial Model Working.pdfNeslte India Ltd_Financial Model Working.pdf
Neslte India Ltd_Financial Model Working.pdf
 
Hul p&l account
Hul p&l accountHul p&l account
Hul p&l account
 
Muthengi mike bamburi financial model - enhancement
Muthengi mike   bamburi financial model - enhancementMuthengi mike   bamburi financial model - enhancement
Muthengi mike bamburi financial model - enhancement
 

Plus de Moon Leong

Fm assignment-final
Fm assignment-finalFm assignment-final
Fm assignment-finalMoon Leong
 
P&L Statement for Charity drive
P&L Statement for Charity driveP&L Statement for Charity drive
P&L Statement for Charity driveMoon Leong
 
Accounting Financial ratio analysis
Accounting Financial ratio analysisAccounting Financial ratio analysis
Accounting Financial ratio analysisMoon Leong
 
A knight 1 st step
A knight 1 st stepA knight 1 st step
A knight 1 st stepMoon Leong
 
Psycho video report
Psycho video reportPsycho video report
Psycho video reportMoon Leong
 
Psychology journal
Psychology journalPsychology journal
Psychology journalMoon Leong
 

Plus de Moon Leong (8)

Fm assignment-final
Fm assignment-finalFm assignment-final
Fm assignment-final
 
P&L Statement for Charity drive
P&L Statement for Charity driveP&L Statement for Charity drive
P&L Statement for Charity drive
 
Business plan
Business planBusiness plan
Business plan
 
Accounting Financial ratio analysis
Accounting Financial ratio analysisAccounting Financial ratio analysis
Accounting Financial ratio analysis
 
Eng 2
Eng 2Eng 2
Eng 2
 
A knight 1 st step
A knight 1 st stepA knight 1 st step
A knight 1 st step
 
Psycho video report
Psycho video reportPsycho video report
Psycho video report
 
Psychology journal
Psychology journalPsychology journal
Psychology journal
 

Dernier

Tree View Decoration Attribute in the Odoo 17
Tree View Decoration Attribute in the Odoo 17Tree View Decoration Attribute in the Odoo 17
Tree View Decoration Attribute in the Odoo 17Celine George
 
Objectives n learning outcoms - MD 20240404.pptx
Objectives n learning outcoms - MD 20240404.pptxObjectives n learning outcoms - MD 20240404.pptx
Objectives n learning outcoms - MD 20240404.pptxMadhavi Dharankar
 
4.11.24 Poverty and Inequality in America.pptx
4.11.24 Poverty and Inequality in America.pptx4.11.24 Poverty and Inequality in America.pptx
4.11.24 Poverty and Inequality in America.pptxmary850239
 
Narcotic and Non Narcotic Analgesic..pdf
Narcotic and Non Narcotic Analgesic..pdfNarcotic and Non Narcotic Analgesic..pdf
Narcotic and Non Narcotic Analgesic..pdfPrerana Jadhav
 
How to Manage Buy 3 Get 1 Free in Odoo 17
How to Manage Buy 3 Get 1 Free in Odoo 17How to Manage Buy 3 Get 1 Free in Odoo 17
How to Manage Buy 3 Get 1 Free in Odoo 17Celine George
 
PART 1 - CHAPTER 1 - CELL THE FUNDAMENTAL UNIT OF LIFE
PART 1 - CHAPTER 1 - CELL THE FUNDAMENTAL UNIT OF LIFEPART 1 - CHAPTER 1 - CELL THE FUNDAMENTAL UNIT OF LIFE
PART 1 - CHAPTER 1 - CELL THE FUNDAMENTAL UNIT OF LIFEMISSRITIMABIOLOGYEXP
 
Man or Manufactured_ Redefining Humanity Through Biopunk Narratives.pptx
Man or Manufactured_ Redefining Humanity Through Biopunk Narratives.pptxMan or Manufactured_ Redefining Humanity Through Biopunk Narratives.pptx
Man or Manufactured_ Redefining Humanity Through Biopunk Narratives.pptxDhatriParmar
 
Shark introduction Morphology and its behaviour characteristics
Shark introduction Morphology and its behaviour characteristicsShark introduction Morphology and its behaviour characteristics
Shark introduction Morphology and its behaviour characteristicsArubSultan
 
The role of Geography in climate education: science and active citizenship
The role of Geography in climate education: science and active citizenshipThe role of Geography in climate education: science and active citizenship
The role of Geography in climate education: science and active citizenshipKarl Donert
 
How to Uninstall a Module in Odoo 17 Using Command Line
How to Uninstall a Module in Odoo 17 Using Command LineHow to Uninstall a Module in Odoo 17 Using Command Line
How to Uninstall a Module in Odoo 17 Using Command LineCeline George
 
Scientific Writing :Research Discourse
Scientific  Writing :Research  DiscourseScientific  Writing :Research  Discourse
Scientific Writing :Research DiscourseAnita GoswamiGiri
 
Mythology Quiz-4th April 2024, Quiz Club NITW
Mythology Quiz-4th April 2024, Quiz Club NITWMythology Quiz-4th April 2024, Quiz Club NITW
Mythology Quiz-4th April 2024, Quiz Club NITWQuiz Club NITW
 
Employablity presentation and Future Career Plan.pptx
Employablity presentation and Future Career Plan.pptxEmployablity presentation and Future Career Plan.pptx
Employablity presentation and Future Career Plan.pptxryandux83rd
 
Decoding the Tweet _ Practical Criticism in the Age of Hashtag.pptx
Decoding the Tweet _ Practical Criticism in the Age of Hashtag.pptxDecoding the Tweet _ Practical Criticism in the Age of Hashtag.pptx
Decoding the Tweet _ Practical Criticism in the Age of Hashtag.pptxDhatriParmar
 
Indexing Structures in Database Management system.pdf
Indexing Structures in Database Management system.pdfIndexing Structures in Database Management system.pdf
Indexing Structures in Database Management system.pdfChristalin Nelson
 
Satirical Depths - A Study of Gabriel Okara's Poem - 'You Laughed and Laughed...
Satirical Depths - A Study of Gabriel Okara's Poem - 'You Laughed and Laughed...Satirical Depths - A Study of Gabriel Okara's Poem - 'You Laughed and Laughed...
Satirical Depths - A Study of Gabriel Okara's Poem - 'You Laughed and Laughed...HetalPathak10
 

Dernier (20)

Tree View Decoration Attribute in the Odoo 17
Tree View Decoration Attribute in the Odoo 17Tree View Decoration Attribute in the Odoo 17
Tree View Decoration Attribute in the Odoo 17
 
Objectives n learning outcoms - MD 20240404.pptx
Objectives n learning outcoms - MD 20240404.pptxObjectives n learning outcoms - MD 20240404.pptx
Objectives n learning outcoms - MD 20240404.pptx
 
4.11.24 Poverty and Inequality in America.pptx
4.11.24 Poverty and Inequality in America.pptx4.11.24 Poverty and Inequality in America.pptx
4.11.24 Poverty and Inequality in America.pptx
 
Narcotic and Non Narcotic Analgesic..pdf
Narcotic and Non Narcotic Analgesic..pdfNarcotic and Non Narcotic Analgesic..pdf
Narcotic and Non Narcotic Analgesic..pdf
 
How to Manage Buy 3 Get 1 Free in Odoo 17
How to Manage Buy 3 Get 1 Free in Odoo 17How to Manage Buy 3 Get 1 Free in Odoo 17
How to Manage Buy 3 Get 1 Free in Odoo 17
 
PART 1 - CHAPTER 1 - CELL THE FUNDAMENTAL UNIT OF LIFE
PART 1 - CHAPTER 1 - CELL THE FUNDAMENTAL UNIT OF LIFEPART 1 - CHAPTER 1 - CELL THE FUNDAMENTAL UNIT OF LIFE
PART 1 - CHAPTER 1 - CELL THE FUNDAMENTAL UNIT OF LIFE
 
Man or Manufactured_ Redefining Humanity Through Biopunk Narratives.pptx
Man or Manufactured_ Redefining Humanity Through Biopunk Narratives.pptxMan or Manufactured_ Redefining Humanity Through Biopunk Narratives.pptx
Man or Manufactured_ Redefining Humanity Through Biopunk Narratives.pptx
 
Shark introduction Morphology and its behaviour characteristics
Shark introduction Morphology and its behaviour characteristicsShark introduction Morphology and its behaviour characteristics
Shark introduction Morphology and its behaviour characteristics
 
The role of Geography in climate education: science and active citizenship
The role of Geography in climate education: science and active citizenshipThe role of Geography in climate education: science and active citizenship
The role of Geography in climate education: science and active citizenship
 
Plagiarism,forms,understand about plagiarism,avoid plagiarism,key significanc...
Plagiarism,forms,understand about plagiarism,avoid plagiarism,key significanc...Plagiarism,forms,understand about plagiarism,avoid plagiarism,key significanc...
Plagiarism,forms,understand about plagiarism,avoid plagiarism,key significanc...
 
How to Uninstall a Module in Odoo 17 Using Command Line
How to Uninstall a Module in Odoo 17 Using Command LineHow to Uninstall a Module in Odoo 17 Using Command Line
How to Uninstall a Module in Odoo 17 Using Command Line
 
Scientific Writing :Research Discourse
Scientific  Writing :Research  DiscourseScientific  Writing :Research  Discourse
Scientific Writing :Research Discourse
 
prashanth updated resume 2024 for Teaching Profession
prashanth updated resume 2024 for Teaching Professionprashanth updated resume 2024 for Teaching Profession
prashanth updated resume 2024 for Teaching Profession
 
Mythology Quiz-4th April 2024, Quiz Club NITW
Mythology Quiz-4th April 2024, Quiz Club NITWMythology Quiz-4th April 2024, Quiz Club NITW
Mythology Quiz-4th April 2024, Quiz Club NITW
 
Mattingly "AI & Prompt Design" - Introduction to Machine Learning"
Mattingly "AI & Prompt Design" - Introduction to Machine Learning"Mattingly "AI & Prompt Design" - Introduction to Machine Learning"
Mattingly "AI & Prompt Design" - Introduction to Machine Learning"
 
Paradigm shift in nursing research by RS MEHTA
Paradigm shift in nursing research by RS MEHTAParadigm shift in nursing research by RS MEHTA
Paradigm shift in nursing research by RS MEHTA
 
Employablity presentation and Future Career Plan.pptx
Employablity presentation and Future Career Plan.pptxEmployablity presentation and Future Career Plan.pptx
Employablity presentation and Future Career Plan.pptx
 
Decoding the Tweet _ Practical Criticism in the Age of Hashtag.pptx
Decoding the Tweet _ Practical Criticism in the Age of Hashtag.pptxDecoding the Tweet _ Practical Criticism in the Age of Hashtag.pptx
Decoding the Tweet _ Practical Criticism in the Age of Hashtag.pptx
 
Indexing Structures in Database Management system.pdf
Indexing Structures in Database Management system.pdfIndexing Structures in Database Management system.pdf
Indexing Structures in Database Management system.pdf
 
Satirical Depths - A Study of Gabriel Okara's Poem - 'You Laughed and Laughed...
Satirical Depths - A Study of Gabriel Okara's Poem - 'You Laughed and Laughed...Satirical Depths - A Study of Gabriel Okara's Poem - 'You Laughed and Laughed...
Satirical Depths - A Study of Gabriel Okara's Poem - 'You Laughed and Laughed...
 

LBS Bina Group's Financial Trends

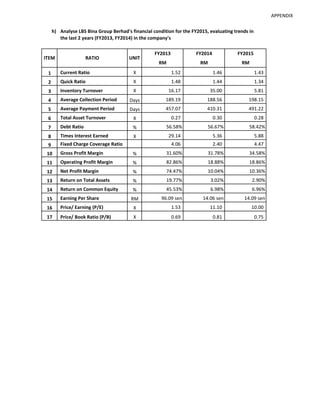
  • 1. APPENDIX h) Analyse LBS Bina Group Berhad's financial condition for the FY2015, evaluating trends in the last 2 years (FY2013, FY2014) in the company's FY2013 FY2014 FY2015 RM RM RM 1 Current Ratio X 1.52 1.46 1.43 2 Quick Ratio X 1.48 1.44 1.34 3 Inventory Turnover X 16.17 35.00 5.81 4 Average Collection Period Days 189.19 188.56 198.15 5 Average Payment Period Days 457.07 410.31 491.22 6 Total Asset Turnover X 0.27 0.30 0.28 7 Debt Ratio % 56.58% 56.67% 58.42% 8 Times Interest Earned X 29.14 5.36 5.88 9 Fixed Charge Coverage Ratio 4.06 2.40 4.47 10 Gross Profit Margin % 31.60% 31.78% 34.58% 11 Operating Profit Margin % 82.86% 18.88% 18.86% 12 Net Profit Margin % 74.47% 10.04% 10.36% 13 Return on Total Assets % 19.77% 3.02% 2.90% 14 Return on Common Equity % 45.53% 6.98% 6.96% 15 Earning Per Share RM 96.09 sen 14.06 sen 14.09 sen 16 Price/ Earning (P/E) X 1.53 11.10 10.00 17 Price/ Book Ratio (P/B) X 0.69 0.81 0.75 ITEM UNITRATIO
  • 2. APPENDIX h) Analyse LBS Bina Group Berhad's financial condition for the FY2015, evaluating trends in the last 2 years (FY2013, FY2014) in the company's FY2013 FY2014 FY2015 RM RM RM 1 925,492,766 1,223,704,038 1,332,051,755 609,599,483 839,094,406 934,070,044 X = 1.52 = 1.46 = 1.43 2 902,917,650 1,210,679,947 1,255,514,483 609,599,483 839,094,406 934,070,044 X = 1.48 = 1.44 = 1.34 3 364,955,568 455,874,300 445,041,756 22,575,116 13,024,091 76,537,272 X = 16.17 = 35.00 = 5.81 4 174,316,241 181,575,618 196,123,831 921,404.123 962,933.951 989,786.784 Days = 189.19 = 188.56 = 198.15 5 Days = 457.07 = 410.31 = 491.22 6 533,532,722 668,265,030 680,295,861 2,009,812,670 2,219,634,894 2,434,777,794 X = 0.27 = 0.30 = 0.28 7 1,137,172,437 1,257,780,460 1,422,405,095 2,009,812,670 2,219,634,894 2,434,777,794 % = 56.58% = 56.67% = 58.42% 8 442,098,118 126,171,744 128,300,833 15,170,850 23,533,952 21,831,551 X = 29.14 = 5.36 = 5.88 9 566,601,544 176,019,511 137,193,748 139,674,276 73,383,719 30,724,466 = 4.06 = 2.40 = 4.47 10 168,577,154 212,390,730 235,254,105 533,532,722 668,265,030 680,295,861 % = 31.60% = 31.78% = 34.58% 11 442,098,118 126,171,744 128,300,833 533,532,722 668,265,030 680,295,861 % = 82.86% = 18.88% = 18.86% 12 397,323,654 67,093,761 70,495,985 533,532,722 668,265,030 680,295,861 % = 74.47% = 10.04% = 10.36% 13 397,323,654 67,093,761 70,495,985 2,009,812,670 2,219,634,894 2,434,777,794 % = 19.77% = 3.02% = 2.90% = = = = = = = = = = = = = = = = = = = = = = = = : ITEM Average Payment Period : Total Asset Turnover : RATIO Inventory Turnover : : Operating Profits Interest Expense Operatings Profits Sales Net Income Debt Ratio : Times Interest Earned : Net Profit Margin : Return on Total Assets (ROA) : Earning Available for Common Stockholders Total Assets Sales Fixed-Charge Coverage Ratio : Gross Profit Margin : Operating Pofit Margin UNITFORMULA EBIT + Fixed Charge (before taxes) Fixed Charge (before taxes) + Interest Sales - Cost of Good Sold Sales = = = = = = = Current Assets Current Liabilities Cost of Good Sold Inventory Sales Total Assets Total Debt Total Assets Account Receivable Annual Credit Sales / 365 Current Assets - Inventory Average Collection Period Account Payble Account Purchase x 365 = =Current Ratio : Quick Ratio : Current Liabilities = = = = = = 457,014,224 364,955,568 x 365 512,464,914 455,874,300 𝑥 365 598,944,944 445,041,756 𝑥 365
  • 3. APPENDIX h) Analyse LBS Bina Group Berhad's financial condition for the FY2015, evaluating trends in the last 2 years (FY2013, FY2014) in the company's FY2013 FY2014 FY2015 RM RM RM ITEM RATIO UNITFORMULA 14 397,323,654 67,093,761 70,495,985 872,640,233 961,854,434 1,012,372,699 % = 45.5% = 7.0% = 7.0% 15 392,662,537 69,929,925 76,074,430 408,618,153 497,413,874 539,759,293 RM = 0.9610 = 0.1406 = 0.1409 16 1.47 1.56 1.41 0.96 0.14 0.14 X = 1.53 = 11.10 = 10.00 17 1.47 1.56 1.41 2.14 1.93 1.88 X = 0.69 = 0.81 = 0.75 = = = = = = = = = = == Market Price Per Share Earnings Per Share Market Price Per Share Equity Book Value Per Share Number of Share of Common Stock Outstanding Return on Common Equity : Earning Per Share : Price/ Earning (P/E) : Price/ Book Ratio (P/B) : Earning Available for common stockholders Net Income Total Common Equity
  • 4. APPENDIX Balance Sheet FY2013 FY2014 FY2015 RM RM RM Non-Current Assets Property, plant and equipment 212,749,463 214,444,731 240,941,611 Capital work-in-progress 3,306,077 208,447 6,229,079 Land and property development costs 392,462,614 347,549,001 515,026,439 Investment properties 6,524,170 33,197,563 33,767,090 Investment in subsidiary compaines - - - Investment in associated companies 2,993,256 13,868,068 13,879,340 Trade receivables 13,726,217 - - Promissory notes 219,098,880 159,661,639 100,498,924 Other investments 138,449,101 136,869,815 94,983,631 Goodwill on consolidation 94,154,754 87,142,327 84,217,235 Deferred tax assets 855,372 2,989,265 13,182,690 Total Non-Current Assets 1,084,319,904 995,930,856 1,102,726,039 Current Assets Land and property development costs 237,730,432 383,729,714 437,734,614 Inventories 22,575,116 13,024,091 76,537,272 Amount owing by customers on contracts - 3,693,953 56,017 Accrued bulling in respect of propety development cost 71,047,149 123,689,261 149,080,582 Trade receivables 174,316,241 181,575,618 196,123,831 Others receivables 23,496,646 63,631,041 92,873,289 Promissory note 100,573,440 85,866,581 105,523,704 Other investments - 27,070,770 38,488,161 Amount owing by subsidiary companies - - - Tax recoverable 5,712,285 8,984,728 8,042,029 Fixed deposits with licensed banks 152,756,932 160,983,954 33,471,075 Cash held under Housing Developmeny Accounts 57,977,521 89,132,344 87,735,381 Cash and bank balances 78,610,013 82,321,983 106,385,800 924,795,775 1,223,704,038 1,332,051,755 Non-Current asstes classified as held for sale 696,991 - Total Current Assets 925,492,766 1,223,704,038 1,332,051,755 Total Assets 2,009,812,670 2,219,634,894 2,434,777,794 Equity Share capital 479,651,357 538,298,257 551,437,117 Share premium 26,641,899 44,586,608 48,298,035 Treasury Shares (9,541,438) (14,678,685) (8,634,411) Other reserves (42,942,110) (38,422,577) (24,605,115) Retained profits/ (Accumulated losses) 415,847,590 439,277,991 465,165,545 Equity attributable to owners of the Parent 869,657,298 969,061,594 1,031,661,171 Non-controlling interest 2,982,935 (7,207,160) (19,288,472) Total Equity 872,640,233 961,854,434 1,012,372,699
  • 5. APPENDIX Balance Sheet FY2013 FY2014 FY2015 RM RM RM Non-Current Liabilities Islamic Securities 30,000,000 - - Bank borrowings 287,969,337 274,566,258 287,939,163 Trade payables 119,328,319 50,854,138 93,613,370 Other payables 47,432,572 48,591,303 56,228,935 Finance lease payables 3,303,044 3,688,384 5,099,292 Amount owing to a subsidiary company - - - Deferred tax liabilities 39,539,682 40,985,971 45,454,291 Total Non-Current Liabilities 527,572,954 418,686,054 488,335,051 Current Liabilities Amount owing to customers on Contracts 3,612,851 5,093,951 5,602,800 Progress billing in respect of property development costs 77,221,417 116,799,940 45,209,124 Trade payables 199,457,872 277,401,479 315,942,280 Other payables 256,536,875 234,037,527 281,302,004 Bank overdrafts 761,587 13,263,668 43,665,940 Finance lease payables 1,019,477 1,025,908 1,700,660 Islamic Securities - 10,000,000 - Bank borrowings 60,035,307 173,964,415 229,765,752 Amount owing to subsidiary companies - - - Tax payables 10,954,097 7,507,518 10,881,484 Total Current Liabilities 609,599,483 839,094,406 934,070,044 Total Liabilities 1,137,172,437 1,257,780,460 1,422,405,095 Total Equity and Liabilities 2,009,812,670 2,219,634,894 2,434,777,794
  • 6. APPENDIX Income Statement FY2013 FY2014 FY2015 RM RM RM Revenue 533,532,722 668,265,030 680,295,861 Cost of sales (364,955,568) (455,874,300) (445,041,756) Gross Profit 168,577,154 212,390,730 235,254,105 Other income 359,117,909 29,795,333 28,072,285 Admistrative and operating expenses (85,596,945) (116,014,319) (135,025,557) Profit from operations 442,098,118 126,171,744 128,300,833 Finance costs (15,170,850) (23,533,952) (21,831,551) Share of profit in associated companies (25,347) 1,493,262 1,618,371 Profit before taxation 426,901,921 104,131,054 108,087,653 Taxation (32,886,164) (37,035,293) (37,591,668) Profit from continuing operations 394,015,757 67,095,761 70,495,985 Discontinued operations Profit from discontinued operations 3,307,897 - - Net profit for the financial year 397,323,654 67,095,761 70,495,985 Other comprehensive income, net of tax: Exchange transiation differences for foreign operations 13,682,663 29,514,783 64,911,675 Transactions with non-controlling interests 271,036 - - (Loss)/ Gain on revaluation of available-for- sale financial asstes - 4,646,143 (21,232,278) Reclassification adjustment for disposal of available-for-sale-financial asstes - 1,465,100 1,888,206 13,953,699 35,626,026 45,567,603 Total comprehensive income for the financial year 411,277,353 102,721,787 116,063,588 Net profit for the financial year attributable to : Owners of the Parent 392,662,537 69,929,925 76,074,430 Non-controlling interests 4,661,117 (2,836,164) (5,578,445) 397,323,654 67,093,761 70,495,985
  • 7. APPENDIX Income Statement FY2013 FY2014 FY2015 RM RM RM Total comprehensive income for the financial year attributable to: Owners of the Parent 399,978,862 106,711,661 126,835,601 Non-controlling interest 11,298,491 (3,991,874) (10,772,013) 411,277,353 102,719,787 116,063,588 Earnings per share attributable to owners of the Parent (sen) Basic earnings per share Profit from continuing operations 95.40 14.06 14 Profit from discontinued operations 0.69 - - Total 96.09 14.06 14.09 Diluted earnings per share Profit from cotinuing operations 91.39 13.45 13.13 Profit from discontinued operations 0.66 - - Total 92.05 13.45 13.13
  • 8. APPENDIX Earning Per Share FY2013 FY2014 FY2015 RM RM RM Net profit for the financial year attributable to owners of the Parent (RM) - continuing operations 389,839,892 69,929,925 76,074,430 - discontinued operations 2,822,645 - - 392,662,537 69,929,925 76,074,430 Weighted average number of ordinary shares in issue Ordinary shares in issue as at 1 January 386,552,557 479,651,357 538,298,257 Effect of ordinary shares issed during the year 29,858,404 27,097,602 7,650,033 Effect of trasury shares held (7,792,808) (9,335,085) (6,188,997) Weighted average number of ordinary shares 408,618,153 497,413,874 539,759,293 as at 31 December Basic earning per share (sen) - continuing operations 95.40% 14.06% 14.09% - discontinued operations 0.69% - - 96.10% 14.06% 14.09%
  • 9. APPENDIX Share Capital FY2013 FY2014 FY2015 Number of Sharholders Issued and fully paid-up capital : RM498,287,257* RM530,066,257* RM551,613,617* No.of Shareholders : 6,301 6,127 5,966 Share Market Price per Share * : 1.47 1.56 1.41 Equity Book Value per Share : 2.14 1.93 1.88 *Source from : https://finance.yahoo.com/quote/5789.KL/history?period1=1356969600&period2= 1388419200&interval=1d&filter=history&frequency=1d Cash Flow Changes in working capital Trade receivables 27,239,262 18,147,184 16,427,273