Spreng, D. (2005). Distribution of energy consumption and the 2000 W/capita target. Energy Policy 33 pp.1905-1011
•
1 like•461 views

Abstract This viewpoint discusses the intra- and international distribution of energy consumption and their implications for intergenerational equity. For global development to be sustainable, the inequality of energy consumption must have an upper limit. A graphic depiction of energy consumption distributions (intra- and international) shows that today’s inequalities are large andit is arguedthat we may have already reachedor perhaps even surpassed the sustainability limit of energy consumption inequality.

Recommended
Recommended
More Related Content
What's hot
What's hot (20)
Viewers also liked
Viewers also liked (20)
Similar to Spreng, D. (2005). Distribution of energy consumption and the 2000 W/capita target. Energy Policy 33 pp.1905-1011
Similar to Spreng, D. (2005). Distribution of energy consumption and the 2000 W/capita target. Energy Policy 33 pp.1905-1011 (20)
More from morosini1952
More from morosini1952 (20)
Recently uploaded
Recently uploaded (20)
Spreng, D. (2005). Distribution of energy consumption and the 2000 W/capita target. Energy Policy 33 pp.1905-1011
- 1. Energy Policy 33 (2005) 1905–1911 Viewpoint Distribution of energy consumption and the 2000 W/capita target Daniel Spreng* Centre for Energy Policy and Economics, Swiss Federal Institutes of Technology, ETH Zentrum WEC C, Zurich CH-8092, Switzerland Available online 24 June 2004 Abstract This viewpoint discusses the intra- and international distribution of energy consumption and their implications for intergenerational equity. For global development to be sustainable, the inequality of energy consumption must have an upper limit. A graphic depiction of energy consumption distributions (intra- and international) shows that today’s inequalities are large and it is argued that we may have already reached or perhaps even surpassed the sustainability limit of energy consumption inequality. r 2004 Elsevier Ltd. All rights reserved. Keywords: Energy consumption; Inequality; Equity; Sustainable development 1. Introduction In discussions on the sustainability of energy systems much weight is placed on the supply side of the energy system (e.g. Schenler et al. (2002) and other contribu- tions in the same special issue of The International Journal of Sustainable Development). However, the supply side view often reduces sustainability to ecolo- gical concerns and a sustainable energy system is equated with an environmentally friendly energy supply system. In emphasising energy demand we attempt to be broader than that. All definitions of sustainability have two elements in common: (1) the simultaneous consideration of ecolo- gical, economic and social aspects and (2) the con- sideration of the next generations. Open to debate is what we mean by ‘‘consideration’’. Should ecological, economic and social aspects be treated with equal weight, if so, how can this be achieved? Analogously, what weight should the consideration of the next generation assume and how should well-being and opportunities of our generation be compared with well-being and opportunities of future generations? In what follows, I will discuss how the undisputed aspects of sustainability could be applied to energy consumption. I argue that ecology dictates an upper limit to energy consumption, economic development a lower limit and social considerations a limit to the spread of energy consumption per capita within society. I, therefore, propose the concept of a window for the sustainable development of the per capita energy consumption. In the analysis of whether a particular development is sustainable or not we are bound to accept today’s energy consumption as a starting point and ask whether the next generation’s situation might be tolerable or not. As we can make direct decisions only for our own generation, it does not make much sense to look into the future beyond the next generation. Therefore, I will discuss the energy consumption of the next generation, let us say of the year 2050 and call a development sustainable that aims at a situation in 2050 that is not obviously unsustainable. 2. Upper limit for the sustainable per capita energy consumption Energy consumption per se does not have a relevant upper limit. Except for the situation in particular cities, waste heat is many orders of magnitudes below levels that affects the environment in a significant way. However, today’s energy consumption impacts the environment in many serious, unsustainable ways. Energy supply and consumption leads to a large fraction ARTICLE IN PRESS *Tel.: +411-632-4189; fax: +411-632-1050. E-mail address: spreng@cepe.mavt.ethz.ch (D. Spreng). 0301-4215/$ - see front matter r 2004 Elsevier Ltd. All rights reserved. doi:10.1016/j.enpol.2004.03.023
- 2. of environmental insults (see e.g. UNDP, 2000). How- ever, besides the emission of CO2, most of the other pollutants can and are being reduced to tolerable levels. Indoor and outdoor air pollutions are being reduced by emission control equipment, fuel cleaning techniques and by fuel switching. The cost of these measures are not disrupting the economics of the system, the degree to which they are implemented is a matter of choice by society, today and in years to come. CO2 emissions are different. There is no plausible path of development in which they are eliminated by 2050. In scenarios most aggressively limiting CO2 emissions the emission levels in 2050 are about what they are today (IPCC, 2000) and are decreasing only after that time below today’s level. The reason for this is that all three ways of drastically reducing CO2 emissions, the procurement of carbon-free primary energy resources, CO2 sequestering and the development and implementation of much more efficient technologies and lifestyles take time. Let us look at these three approaches briefly. The development and installation of energy supply systems based on carbon-free primary energy resources requires large investments. In some cases, like the solar electric systems, more development is needed, to reduce cost before they can be installed on a massive scale. Wind energy farms are suitable if their contribution is not too large a share of the energy input to the electric grid, otherwise expensive back-up systems are necessary. In the case of nuclear systems, new generations have to be developed, which may possibly win the public’s and investors’ approval. The technology and practice of sequestering CO2 is potentially expensive, has possibly some safety problems and is only at the start of its development. The prerequisite for this practice is an international binding commitment to limit CO2 emissions. Nobody will go to the trouble and expense to sequester CO2, if not everybody agrees to do it. Years will pass before an agreement of this kind is in place that includes most nations. Similarly with today’s low-energy prices that do not reflect their true cost to society, and with the low level of attention to energy efficiency, new, highly efficient technologies and lifestyles will also take time to be introduced. Of the three options to reduce CO2 emissions, energy conservation through increased effi- ciency is the most cost effective and could be introduced without delay, even though it will take a long time until, for instance, an entire building stock is renewed. The massive consumption of carbon-free primary energy resources and the practice of sequestering CO2 will, in the very long run, be solutions to the CO2 problem. However, without an energy efficiency crash pro- gramme, they will be too slow to meet the 2050 CO2- emission requirements. Furthermore, these solutions will not be affordable to society, if the energy use is not curbed, i.e. if their implementation is not preceded by massive improvements in energy efficiency. Based on this discussion, the upper limit of global average per capita energy consumption can readily be calculated from the climate models. For scenarios, which are on a path to a stabilisation of the climate in the long run, CO2 emissions in 2050 are around or below 8 Gt/year. With a world population of approximately 8 billion at that point, this corresponds to 1 t/year capita and, further, with today’s average carbon content in primary energy this translates to 2000 W/capita. If the carbon content in primary energy is by that time reduced to half of today’s average value, an extremely ambitious goal only conceivable in conjunction with a massive energy efficiency programme, 1 t/year capita would correspond to 4000 W/capita.1 3. Lower limit for the sustainable per capita energy consumption No development is sustainable, if it does not include progress towards the alleviation of poverty and the associated, necessary economic development. Usually, poverty is measured in monetary terms. But most lifestyles above the poverty level are associated with a certain minimum level of energy consumption. This level has been discussed and determined by engineering type estimates of the direct energy required to satisfy basic needs. Such calculations are reported in early studies by Bravo (1979) cited in Krugman and Goldemberg (1983), Goldemberg et al. (1985, 1987), Goldemberg (1990) and Revelle (1976). Goldemberg et al. estimated that the requirement of direct primary energy per time unit to satisfy basic needs is about 500 W per person. Including indirect energy consump- tion, i.e. the energy requirement for producing the goods, such as food, clothing and shelter, forming part of basic needs, one has to double this number, thus arriving at 1000 W/capita. This kind of a calculation rests on a number of assumptions regarding the type of energy consuming equipment (stove, light bulbs, etc.), their sizes, efficien- cies and intensity of consumption. In addition, the approach requires as a first normative step the definition of a set of basic needs. This is a problematic endeavour. Obviously basic needs vary not only with climate, region, period in time, age and sex, but also with personal outlook and expectations. In addition, there is a question of the proper level in the energy chain, from primary energy to energy ARTICLE IN PRESS 1 Following Goldemberg, we use the unit of power (energy per unit time) in W (=J/s), when referring to energy needs per person. Obviously, 2000 W=2 kWh/h=2 Á 8760 kWh/year. D. Spreng / Energy Policy 33 (2005) 1905–19111906
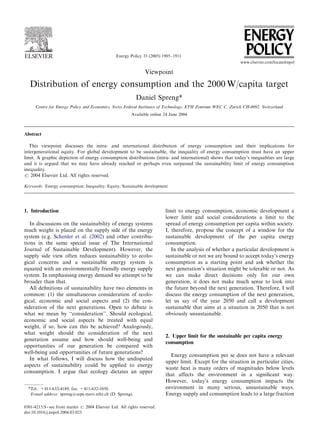
- 3. services, at which the minimum level of energy consumption should be determined. As this lower limit is at least partially normative, any number can be disputed. I refer to a detailed discussion of this issue in respect to the case of India (Pachauri and Spreng, 2004) and pick half of the 1000 W/capita number, i.e. 500 W/capita (for the direct plus indirect energy consumption). In India 500 W/capita is about today’s average and it affords in the average the energy service of two cooked meals a day, some light from a kerosene lamp and the indirect energy required to produce food, necessary to not go hungry, simple clothing and shelter. With improved efficiencies of stoves, other equipment and production in industry and agriculture, 500 W/capita will provide for more energy services, but with continued globalisation the perception of poverty will also change and the normative determination is likely to increase rapidly. 4. Limit for the spread of sustainable per capita energy consumption There is wide acceptance of the idea, that there is some measure of inequality that leads to social conflict. There is also general agreement that people should have equal opportunities. Slavery, the medieval class system and Indian castes have been and are being abolished. All men (and women) are born equal, as the US declaration of independence says. However, what measure of inequality is beneficial, or at least not harmful, is open to debate. An interesting debate on this issue is given in the winter 2002 issue of DAEDALUS. Galbraith (2002) starts the discussion with a detailed analysis entitled ‘‘A perfect crime: global inequality’’. The third article in the issue by Epstein (2002) also agrees that today’s inequal- ities, particularly those running along the US racial divide, are ‘‘a sorry state of affairs’’, but his main message is summarised in the last paragraph of his article: ‘‘John F. Kennedy had it right when he said that a rising tide lifts all the boats. And that tide will only rise when we put aside our preoccupation with redress and redistribution—and agree instead to unleash the produc- tive capacities of all our citizens’’. Whereas in the last century inequalities within nations have been the main, or one of the main topics of politics, in the coming century, politics most likely will be pre-occupied with inequalities between nations. Usually, inequality is discussed in terms of income or some related monetary measure. I argue, that looking at the per capita energy consumption—particularly if we agree that this measure does have an upper limit as discussed above enriches the discussion. The existence of a lower limit is accepted both for monetary measures and for the per capita energy consumption. However, the upper, ecological limit to the average per capita energy consumption does not exist for monetary measures. If per capita energy consumption is used as the surrogate measure of well-being, its upper limit makes the concept of the rising tide inapplicable. The developments described in some of the stabilisa- tion scenarios of IPCC’s Special Report on Energy Scenarios do not only include the stabilisation of CO2 output but also minor economic improvements for developing countries. The overlooked question, how- ever, is whether the spread of energy consumption is not also a serious issue in regard to sustainable develop- ment. For a development to be sustainable, free of large social conflicts, we must be on a path leading in 2050 to a situation with a limited spread in energy consumption. The continued large CO2 emission by rich countries robs the poorer countries the possibility of rapid develop- ment and the use of the common, cheap CO2-sink. The following graph (Fig. 1) depicts the inequality in today’s energy use (an older version of this graph was constructed in a diploma thesis (Schmieder and Taor- mina, 2001). It shows the energy consumption per capita of 73 countries, wherever possible for the year 2000 (IEA, 2003). This alone is not new. New is that we have included for every country the estimated energy consumption per capita of the richest 10% and the poorest 10% of the population (decile)2 (CIA, 2003; The ARTICLE IN PRESS 2 To calculate the energy consumption of the top and bottom decile we assume that the total energy-income elasticity for all countries is the same, namely 0.8. It is a rounded average number taken from the literature. It has been studied in detail for the Netherlands by Vringer and Blok (1995), their value is 0.83. The corresponding number for Australia is 0.73 (Lenzen, 1998). For urban households in India a value of 0.67 has been reported (Pachauri, 2004) and for urban households in Brazil a value of 1.01 (Cohen et al., 2004). These numbers refer to the dependence of the total commercial energy (both direct and indirect) on income at a given time within one country. In Fig. 2 we use 0.8 also for the world as a whole, which is as good an assumption as any. The calculation of Podobnik (2002) addresses only the inequalities between country averages. The spread of energy consumption between the top and the bottom decile, DE ¼ Etop2Ebottom; is calculated as follows from knowing the averages for the per capita income and for the per capita energy consumption, Iaverage and Eaverage and the income of the top and the bottom decile, Itop and Ibottom: Etop ¼ Eaverage þ ðDItopEaverage=Iaverage0:8Þ; ð1Þ Ebottom ¼ Eaverage À ðDIbottomEaverage=Iaverage0:8Þ; ð2Þ where DItop ¼ Itop À Iaverage and DIbottom ¼ Iaverage À Ibottom: For some cases the net import of embodied energy in goods and services make a per capita comparison with other countries not very meaningful. For Switzerland the per capita energy consumption has, for that reason, been augmented by 25% to compensate for the large net import of embodied energy. Luxembourg and Trinidad have been eliminated from the list because the large exports of embodied energy are unknown to the author. D. Spreng / Energy Policy 33 (2005) 1905–1911 1907
- 4. ARTICLEINPRESS Fig. 1. Energy use per time and capita in various countries and within countries (average consumption as well as consumption of highest and lowest decile of users). D.Spreng/EnergyPolicy33(2005)1905–19111908
- 5. World Bank Group, 2003). Furthermore, a 2000 W/ capita line is drawn. 2000 W/capita is both not far from today’s world average and can, as we have seen, be considered an average compatible with sustainable development in the long run.3 With these two additions, the graph presents not only international inequalities but also, at one glance, intra-national and inter- generational inequalities. The graph shows a troubling situation regarding inequality in present energy consumption, within countries, and across countries. 5. Equity: Rawls’ two considerations From the vast spectrum of literature on inequality and inequity I pick one philosopher who has thought about intra- and international inequity: Rawls (1971) suggests in A Theory of Justice that the correct judgment about the distribution of goods (material and other) in society is to look at the disadvantaged members. He does not argue that everybody should ideally have the same, or, that the image of the rising tide is wrong, but that the proof of the pudding was the state of affairs of the poorest. If, over the course of time the plight of the poor improves in a nation, the distribution of wealth becomes more just. Can we apply the same criterion when comparing poverty in different countries? Rawls (1997) discusses this question in his last book, The Law of Peoples. This book is less well known, but is of particular interest for the assessment of international inequalities and inequi- ties. Rawls comes to the conclusion, that there is no similar equity criteria between peoples as within one people: Each one of us does have some responsibility for his neighbours and for fairness within his and her society, such that we share a responsibility for the plight of the poor in our society. However, other people have different traditions and rules. We can and may not be responsible for how other people distribute their wealth. An important matter for which we do share respon- sibility, Rawls writes, are, however, international treaties, conventions and dealings. If they lead to injustice and contribute to keeping people in less well- of countries poor, we, in the richer countries are responsible for the contribution of these international treaties, conventions and dealings to global inequity. Rawls values national sovereignty highly. Younger, human rights-scholars and politicians4 would argue that ARTICLE IN PRESS Fig. 2. The energy consumption window. The upper, ecological boundary refers to the global average and is drawn between 2 and 4 kW/capita depending carbon content of the total primary energy used in 2050. The lower boundary is chosen at 600 W/capita and refers to the poorest decile of the global society in 2050. The distribution ‘‘World tomorrow without social boundaries’’ is calculated assuming the average to increase to 3 kW/ capita and the proportional distance between the average and the lowest and top decile to remain constant. Solidarity is the principle idea of the 2000 W/capita society. The social boundaries and the energy distribution in the 2000 W society are drawn in an exemplary way. More conventional stabilisation scenarios possibly over-step social boundaries to a not sustainable degree. 3 The term 2000 W/capita society was chosen a few years ago, when the world average energy use was in fact 2000 W/capita. 4 Resolution adopted by the General Assembly (A/RES/55/2), United Nations Millennium Declaration, I. Values and Principles, para. 2: ‘‘We recognize that, in addition to our separate responsibilities to our individual societies, we have a collective responsibility to uphold D. Spreng / Energy Policy 33 (2005) 1905–1911 1909
- 6. in our global society solidarity should go beyond international treaties and conventions. However, even taking fairness more seriously in respect of these treaties, conventions and dealings, would go a long way towards more global justice. 6. Utopia, novatlantis and the 2000 W/capita society Assuming the spread of energy consumption will lead to global, social unrest, some scientists in Switzerland and elsewhere have began thinking about the feasibility of drastically reducing per capita energy consumption in post-industrial societies (see description of project novatlantis, 2004). Utopia is the title of a book by Sir Thomas More, which was published in Latin in 1516. The work describes the ideal state, in which everything is organised rationally for the equal good of everyone, where all scourges of society, such as poverty and distress are eliminated. Solidarity, central to the idea of the 2000 W/ capita society, is utopian in its original meaning. Sir Francis Bacon, English thinker and writer of the early 17th century, propagated both scientific method and the value of science to society. In ‘‘The New Atlantis’’ (1627) he describes a happy—although not egalitarian—nation that considered the ‘‘light’’ of knowledge and the careful attention to the adherence to law its most precious goods.5 Today like at the beginning of the renaissance, some analysts see the dawn of an age of information. It is not scientific method that lies at the root of today’s possible renaissance, but technological capabilities. Information technology makes it possible for information to be omnipresent, in technical processes and for decisions everywhere (Spreng, 1993). This, in principle, can lead to massive improvements of energy efficiency and reduc- tions of waste. Information technology provides the possibility for a resource-efficient new Atlantis. How- ever without a conscious effort by society, information technology is more likely used to greatly increase wasteful automated mass production. 7. Concluding remarks The 2000 W/capita society can be seen as combination of Utopia, in its original, egalitarian meaning, and New Atlantis; as happy, science-based society. But it can also be viewed much more pragmatically. There is no way that OECD countries can keep increasing their CO2 emissions without contributing to a large and most likely catastrophic climate change. Even keeping their CO2 emissions constant, i.e. limiting their per capita energy consumption to a very moderate increase, commensurate with the increase of non-fossil fuel energy use, would either leave the inequity in terms of CO2 emissions at today’s high, potentially explosive level or, if, as we hope, developing countries develop sufficiently to reduce poverty on a large scale, global CO2 emissions would still lead to a considerable change of climate. As the energy consumption in 2050 will have to be not much more than 2000 W/capita on the global average in order to be ecologically sustainable, technologies and lifestyles compatible with that energy consumption will be needed. An economy such as Switzerland and other OECD countries that live on creating and exporting technology, will be in a good position, if their exports serve the needs of the time. It is only wise for technology producing countries to aim at the future market of the 2000 W/capita society in terms of their technology policy. This is a matter of good business strategy. Energy policy, in turn, should be directed at reducing per capita energy consumption. By how much we reduce our own energy consumption is a question of solidarity (cf. Fig. 2). Massive reductions in OECD countries would perhaps even leave room in the global CO2- emission budget to allow poverty eradication as stipulated in the UN millennium goals without trigger- ing catastrophic climate change. Acknowledgements Many thanks to Andr!e Kemmler for re-calculating and re-drawing Fig. 1. The financial help of novatlantis (www.novatlantis.ch) is gratefully acknowledged. References Bacon, F., 1627. The New Atlantis. The short full text is available on http://www.constitution.org/bacon/new atlantis.htm. CIA, 2003. The World Factbook. http://www.odci.gov/cia/publications/ factbook/fields/2047.html. Cohen, C.A.M.J., Lenzen, M., 2004. Energy requirements of house- holds in Brazil. Energy Policy, in press. ARTICLE IN PRESS (footnote continued) the principles of human dignity, equality and equity at the global level. As leaders we have a duty therefore to all the world’s people, especially the most vulnerable and, in particular, the children of the world, to whom the future belongs’’. 5 Novatlantis was constructed as a haven for information. I quote from Bacon (1627): ‘‘When the King had forbidden to all his people navigation into any part that was not under his crown, he made nevertheless this ordinance; that every twelve years there should be set forth out of this kingdom, two ships, appointed to several voyages; y. whose errand was only to give us knowledge of the affairs and state of those countries to which they were designed; and especially of the sciences, arts, manufactures, and inventions of all the world; and withal to bring unto us books, instruments, and patterns in every kind: y rewarding y. [the owners], as they should think fit’’. On their voyages the ships should sail under flags of foreign nations and make use of the people that had previously stranded and then treated as guests on the island. D. Spreng / Energy Policy 33 (2005) 1905–19111910
- 7. Epstein, R.A., 2002. Against redress. Daedalus—Journal of the American Academy of Arts and Sciences Winter 39–48. Galbraith, J.K., 2002. A perfect crime: inequality in the age of globalization. Daedalus—Journal of the American Academy of Arts and Sciences Winter 11–25. Goldemberg, J., 1990. One kilowatt per capita. Bulletin of the Atomic Scientists 46(1). Goldemberg, J., Johansson, T.B., et al., 1985. Basic needs and much more with one kilowatt per capita. Ambio, 14 (4–5), 190–200. Goldemberg, J., Johansson, T.B., et al., 1987. Energy for a Sustainable World. Wiley-Eastern Limited, New Delhi. IEA, 2003. Key Energy Indicators per Country. http://www.iea.org/ stats/files/selstats/keyindic/keyindic.htm. IPCC, 2000. Emission scenarios. IPCC Special Report, Cambridge University Press. Krugman, H., Goldemberg, J., 1983. The energy cost of satisfying basic human needs. Technological Forecasting and Social Change 24, 45–60. Lenzen, M., 1998. Primary energy and greenhouse gases embodied in Australian final consumption: an input–output analysis. Energy Policy 26 (6), 495–506. novatlantis, 2004. http://www.novatlantis.ch/. Pachauri, S., 2004. An analysis of cross-sectional variations in total household energy requirements in India using micro survey data. Energy Policy 32 (15), 1723–1735. Pachauri, S., Spreng, D., 2004. Energy use and energy access in relation to poverty. Economic and Political Weekly, January 17. Podobnik, B., 2002. Global Energy inequalities: exploring the long- term implications. Journal of World-Systems Research 8 (2), 252–274. Rawls, J., 1971. A Theory of Justice. Belknap Press of Harvard University, Cambridge, MA. Rawls, J., 1997. The Law of Peoples. Belknap Press of Harvard University, Cambridge, MA. Revelle, R., 1976. Energy use in rural India. Science 192 (4), 969. Schenler, W.W., Gheorghe, A.V., et al., 2002. Strategic electric sector assessment methodology und sustainability conditions. The Inter- national Journal of Sustainable Development 5(1/2 Special Issue) pp. 7–63. Schmieder, B., Taormina, N., 2001. Energieverbrauchsfenster. Diplo- marbeit ETH Z.urich, ORL-Institut and CEPE. Spreng, D., 1993. Possibility for substitution between energy, time and information. Energy Policy 21 (1), 13–23. The World Bank Group, 2003. Data Query. http://devdata.worldbank. org/data-query/. UNDP, 2000. World Energy Assessment: Energy and the Challenge of Sustainability. J. Goldemberg, New York. Vringer, K., Blok, K., 1995. The direct and indirect energy requirements of households in the Netherlands. Energy Policy 23 (10), 893–910. ARTICLE IN PRESS D. Spreng / Energy Policy 33 (2005) 1905–1911 1911