Population structure models for IGCSE Geography
•Télécharger en tant que PPT, PDF•
4 j'aime•942 vues

Population Structure: Demonstrated visually by 2 models: Demographic transition Model and Population Pryramids

Recommandé
Recommandé
Contenu connexe
Tendances
Tendances (20)
Similaire à Population structure models for IGCSE Geography
Similaire à Population structure models for IGCSE Geography (20)
Plus de Guerillateacher
Plus de Guerillateacher (20)
Dernier
Dernier (20)
Population structure models for IGCSE Geography
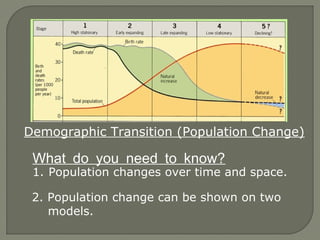
- 1. Demographic Transition (Population Change) What do you need to know? 1. Population changes over time and space. 2. Population change can be shown on two models.
- 2. Model 1: The DTM (Demographic Transition Model) Stage 1 Both high birth rates and death rates fluctuate in the first stage of the population model giving a small population growth (shown by the small total population graph).
- 3. Model 1: The DTM (Demographic Transition Model) Stage 2 Birth rates remain high, but death rates fall rapidly causing a high population growth (as shown by the total population graph).
- 4. Model 1: The DTM (Demographic Transition Model) Stage 3 Birth rates now fall rapidly while death rates continue to fall. The total population begins to peak and the population increase slows to a constant.
- 5. Model 1: The DTM (Demographic Transition Model) Stage 4 Both birth rates and death rates remain low, fluctuating with 'baby booms' and epidemics of illnesses and disease. This results in a steady population.
- 6. Model 1: The DTM (Demographic Transition Model) Stage 5? A stage 5 was not originally thought of as part of the DTM, but some northern countries are now reaching the stage where total population is declining where birth rates have dropped below death rates.
- 7. Model 2: The PPM (Population Pyramid Model) The PPM - 'Population Pyramid Model' shows how dynamic (subject to change) population is. The model is structured to show 'snapshots' of a population at four points during its development, which are shown as Stages 1 - 4 (A - D). A country will progress through the stages.
- 8. High Fluctuating Description Reason Wide base High Birth Rate (poverty / tradition / high Infant Mortality) Concave shape High Infant Mortality (poor Health Care / sanitation / education / young mothers) Narrow top High death Rate (Poor health care / social services for elderly) Short Low Life Expectancy (poverty/ education / health care etc.)
- 9. Early Expansion: Description Reason Wide base High Birth Rate (poverty / tradition / high Infant Mortality) Less Concave shape Decreasing Infant Mortality (Improving Health Care / sanitation / education / fewer young mothers) Narrow top High death Rate (Poor health care / social services for elderly) Taller Improving Life Expectancy (reduction poverty/ improving health care etc.)
- 10. Late expansion: Description Reason Wide base Population momentum (high numbers in fertile ages mean large numbers of babies despite lower growth rates.) Convex shape Low Infant Mortality (Good Health Care / sanitation / education / family planning) Wide top Low Death Rate (Good health care / social services for elderly) Tall High Life Expectancy (Less poverty/ education / nutrition / health care etc.)
- 11. Low Fluctuating Description Reason Wide base Population momentum (high numbers in fertile ages mean large numbers of babies despite lower growth rates.) Convex shape Low Infant Mortality (Good Health Care / sanitation / education / family planning) Wide top Low Death Rate (Good health care / social services for elderly) Tall High Life Expectancy (Less poverty/ education / nutrition / health care etc.)