Electricity.myanmar.2016.by.government
•
1 like•759 views

- The document outlines Myanmar's hydropower development plans from 2016-2031. It summarizes existing power stations, strategies for power sector investment, and lists numerous proposed hydropower projects. - Key points include plans for installed capacity to reach 35,711 MW by 2031 through sole government investments, local BOT projects, and large foreign JV/BOT projects primarily from China. The majority of new capacity will come from major JV/BOT projects scheduled for completion after 2030. - Detailed tables list existing power stations by type (hydro, coal, gas), proposed timelines and capacities for sole, BOT and JV/BOT projects, and the country sources of foreign investors. China is the

Recommended
Recommended
More Related Content
What's hot
What's hot (20)
Similar to Electricity.myanmar.2016.by.government
Similar to Electricity.myanmar.2016.by.government (20)
More from Zaw Aung
More from Zaw Aung (20)
Recently uploaded
Recently uploaded (20)
Electricity.myanmar.2016.by.government
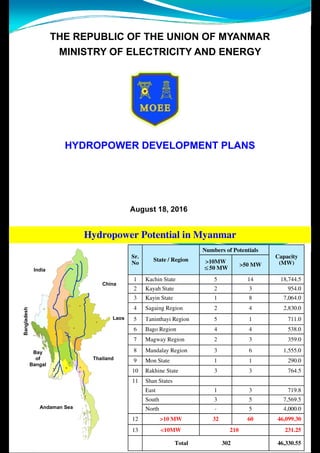
- 1. THE REPUBLIC OF THE UNION OF MYANMAR MINISTRY OF ELECTRICITY AND ENERGYMINISTRY OF ELECTRICITY AND ENERGY HYDROPOWER DEVELOPMENT PLANS August 18, 2016 0! +)*)/ + )-(-% %( 0 (' + .' +,)# )-(-% , India + 3E - - $ %)( .' +,)# )-(-% , * %-0 !28 China !$ ( (
- 3. + ( (
- 4. +!$ ( (
- 6. !$ !%$
- 7. $!$( +! !%$ Ban Bay % !%$
- 9. * + !%$ , $ # + !%$ ' * %!)))#$Bay of Bangal Thailand , $ # + !%$ ' * %!)))#$ %$ ( ( !$ ( (
- 10. $ ( ( ' /6CD % ' +%-#, 4AED ' ) +!)*-#) Andaman Sea 2ABD ) (!$$$#$ %
- 11. %' (' ()'$(+ )-
- 12. Related Law and Plans Electricity Law - Electricity Law had been enacted on 27th October 2014. B l i ill i d i- By-law is still in conducting. National Electricity Master Plan National Electricity Master Plan National Electricity Master Plan had been conducted by the assistance of Japan International Cooperation Agency (JICA). National Electrification Plan National Electrification Plan National Electrification Plan had been jointly conducted by Ministry of Electricity and Energy and World Bank in June 2014. 3 Electricity Law $ Enacted on 27th October 2014. $ Covered with (16) chapters. 4
- 13. National Electricity Master Plan $ National Electricity Master Plan had been conducted by the assistance ofbeen conducted by the assistance of Japan International Cooperation Agency (JICA). 5 National Electricity Master Plan Hydroy Gas Coal Diesel 4,758 MW2,000 MW (23,594) MW 2030-2031 200 MW (2 %) (8,815) MW2020-2021 4,758 MW (20%) 8,896 MW (9%) 7,940 MW 1,969 MW (22 %)4,721 MW (54 %) 1925 MW (38%) (33%)1925 MW (22 %) 6 Hydro Gas Coal Renewable Hydro Gas Coal Renewable
- 14. National Electrification Plan The Government of the Republic of the Union of $ National Electrification Plan had been jointly conducted by Ministry Myanmar of Electricity and Energy and World Bank in June 2014World Bank in June 2014. National Electrification Plan MYANMARNational Electrification Plan 7 National Electrification Plan (1 7) illi f h h ld ill h t l t i it i 2015 2019 (1.7)millions of house-hold will have access to electricity in 2015-2019 (5 –year plan).( y p ) 99 % of house-hold will have access to electricity in 2030.y USD (5.8) billions shall be needed for electricity distribution.( ) y Key issue : Further investments shall be needed to extend they Electricity Generation and Transmission. 8
- 15. Present Situation in Power Sector Total Installed Capacity : 5,201.9 MWp y , As a base-load of hydropower, hydropower stations are rendered inefficient in dry season. Due to the constraint of natural gas gas power stations can’t be able Due to the constraint of natural gas, gas power stations can t be able to fully operate from time to time. 9 Existing Power Stations (Hydro Coal-fired) No. Stations Installed Capacity (MW) Annual Generation (GWh) Remarks 1 Balu Chaung (2) 168 1190.0 2 Kinda 56 165.02 Kinda 56 165.0 3 Sedawgyi 25 134.0 4 Balu Chaung (1) 28 200.0 5 Zawgyi (1) 18 35.0 6 Zawgyi (2) 12 30 06 Zawgyi (2) 12 30.0 7 Zaungtu 20 76.0 8 Thaphanseik 30 117.2 9 Mone Chaung 75 330.0 10 Paunglaung 280 911 0 Sole Investment 10 Paunglaung 280 911.0 11 Tigyit (Coal-fired) 120 600.0 12 Yenwe 25 123.0 13 Kabaung 30 120.0 14 Keng Taung 54 377 614 Keng Taung 54 377.6 15 Yeywa 790 3550.0 16 Shwekyin 75 262.0 17 Kyee Ohn Kyee Wa 74 370.0 18 Kun Chaung 60 190 018 Kun Chaung 60 190.0 19 Nancho 40 152.0 20 Phyu Chaung 40 120.0 21 Upper Paunglaung 140 454.0 22 Myogyi 30 135 722 Myogyi 30 135.7 23 Thaukyegat (2) 120 604.0 B.O.T 24 Balu Chaung (3) 52 334.0 25 Shweli (1) 600 4022.0 JV/B O T26 Dapein (1) 240 1065 0 10 JV/B.O.T26 Dapein (1) 240 1065.0 27 Chipwe nge 99 433.0 Total 3,301 11013.5
- 16. Existing Power Stations (Gas Turbine) No of Installed Ann al Generation No. Stations No. of Stations Capacity (MW) Annual Generation (GWh) 1 Sole Investment 11 814.9 5,232 2 P bli P i t P t hi 6 213 1 4072 Public Private Partnership 6 213 1,407 3 Independent Power Producer 5 405.83 2,003.179 4 Rental 5 467.14 3,549.585 Total 27 1,900.87 12,191.764 11 Strategies on Power Sector $ Sole investment by Ministry $ Investment by local entrepreneurs on B.O.T basis $ Investment by foreign companies on J.V / B.O.T basis Mi i t BOT JV/BOT Resources Ministry BOT JV/BOT No Installed Capacity No Installed Capacity No Installed CapacityNo. Capacity (MW) No. Capacity (MW) No. Capacity (MW) Hydro 5 1 495 2 7 692 4 38 39 524Hydro 5 1,495.2 7 692.4 38 39,524 Coal - 2 350 10 9,475 Gas 6 3 525 2 989Gas - - 6 3,525 2 989 Wind - 5 6,538 Solar 5 1 510Solar - - 5 1,510 Total 5 1,495.2 15 4,567.4 60 58,036 12 Note : All are still in on-going projects.
- 17. Hydropower Development Plans 13 List of Foreign Investors (Country- Wise) No. Investors’ Countries No. of Companies No. of Projects Installed Capacity Remarks Countries Companies Projects (MW) 1 P R Chi 11 30 38 0731. P.R. China 11 30 38,073 Two projects are to be 2. Thailand 1 - - jointly implemented with Chinese Companies.p 3. Norway 1 1 700 4. Austria 1 1 66 5 Singapore 2 6 6855. Singapore 2 6 685 Total 16 38 39,524 14 Note: All hydropower projects are to be implemented on JV/B.O.T basis.
- 18. Hydropower Development Plans up to 2030-2031 I t ll d No. Completion Year No. of Projects Installed Capacity (MW) Remarks 1. 2016-2017 1 66 Mong Wa HPP (B.O.T) 2. 2018-2019 1 3.2 Upper Nattrum HPP (Sole Investment) T o are on sole in estment 3. 2019-2020 4 381.4 Two are on sole investment. Two are on B.O.T basis. 4. 2020-2021 17 10,087 Two are on sole investment. Fifteen are on JV/B O T basisFifteen are on JV/B.O.T basis. 5. 2021-2022 6 1,196 Four are on B.O.T basis. Two are on JV/B.O.T basis. 6. 2022-2023 1 140 Dapein (2) HPP (JV/B.O.T) 7. 2023-2024 1 1,400 Upper Thanlwin (Kunlong) (JV/B.O.T) 8 2024 2025 1 225 M T HPP (JV/B O T)8. 2024-2025 1 225 Mang Taung HPP (JV/B.O.T) 9. 2025-2026 5 828 All are on JV/B.O.T basis. 10 2026-2027 5 2 400 All are on JV/B O T basis10. 2026-2027 5 2,400 All are on JV/B.O.T basis. 11. 2027-2028 1 285 Nam Tabak HPP (JV/B.O.T) 12. 2030-2031 6 18,700 All are on JV/B.O.T basis. Total 49 35,711.6 15Note : Myitsone HPP is suspended. Sole investment by Ministry No Projects Location Installed Completion No. Projects Location Capacity(MW) (Estimation) 1. Shweli-3 Mandalay 1,050 2020-2021 2 Upper Yeywa Shan 280 2019-20202. Upper Yeywa Shan 280 2019 2020 3. Thahtay Rakhaing 111 2020-2021 4. Upper Kengtawn Shan 51 2019-2020 5. Upper Nattrum Kachin 3.2 2018-2019 Total 1,495.2Total 1,495.2 16
- 19. Investment by local entrepreneurs on B.O.T basis No. Projects Location Installed Capacity(MW) Completion (Estimation) 1. Upper Baluchaung Shan 30.4 2019-2020 2. Mong Wa Shan 66 2016-2017 3. Nam Paw Shan 20 2019-20203. Nam Paw Shan 20 2019 2020 4. Nam Tu Shan 100 2021-2022 5. Nam Lin Shan 36 2021-2022 6 B t B 160 2021 20226. Bawgata Bago 160 2021-2022 7. Belin Mon 280 2021-2022 Total 692.4 17 Investment by foreign companies on J.V / B.O.T basis No. Projects Location Installed Capacity(MW) Completion (Estimation) JVA - Signed Projects (6 Nos.) 1 Myitsone Kachin 6 000 Suspended1. Myitsone Kachin 6,000 Suspended 2. Chipwi Kachin 3,400 2020-2021 3. Laza Kachin 1,900 2020-2021 4 Upper Thanlwin (K l ) Shan 1 400 2023-20244. (Kunlong) Shan 1,400 2023 2024 5. Gaw Lan (Ngaw Chang Kha) Kachin 120 2026-2027(Ngaw Chang Kha) 6. Tongxinqiao (Ngaw Chang Kha) Kachin 340 2026-2027 Total 13,160 18
- 20. Investment by foreign companies on J.V / B.O.T basis No. Projects Location Installed Capacity(MW) Completion (Estimation) MOA Si d P j t (12 N )MOA- Signed Projects (12 Nos.) 1. Wutsok Kachin 1,800 2030-2031 2. Kaunglanhpu Kachin 2,700 2030-2031 3. Yenam Kachin 1,200 2030-2031, 4. Hpizaw Kachin 2,000 2030-2031 Khan Kan 5. Khan Kan (Ngaw Chang Kha) Kachin 140 2026-2027 6. Laung Din (N Ch Kh ) Kachin 600 2026-20276. (Ngaw Chang Kha) Kachin 600 2026 2027 7. Hutgyi Kayin 1,360 2020-2021 8 Sh li 2 Sh 520 2021 20228. Shweli-2 Shan 520 2021-2022 9. Ywa Thit Kayah 4,000 2030-2031 19 10. Naopha Shan 1,200 2026-2027 Investment by foreign companies on J.V / B.O.T basis Installed Completion No. Projects Location Installed Capacity(MW) Completion (Estimation) 11. Mang Taung Shan 225 2024-2025g g 2024 2025 12. Nam Tabak Kachin 285 2027-2028 T t l 16 030Total 16,030 MOU - Signed Projects (20 Nos.) 1. Dapein-2 Kachin 140 2022-2023 2. Upper Thanlwin Shan 7,000 2030-2031pp (Mongton) , 3. Keng Tong (Nam Lwe) Shan 170 2025-2026 4. Solue(Nam Lwe) Shan 240 2025-2026 5. Keng Yang(Nam Lwe) Shan 70 2025-2026 6. Hekou(Nam Lwe) Shan 138 2025-2026 7. Nam Kha Shan 210 2025-2026 20 8. Manipur Sagaing 380 2020-2021
- 21. Investment by foreign companies on J.V / B.O.T basis No. Projects Location Installed Capacity(MW) Completion (Estimation) 9. Middle Yeywa Shan 700 2020-2021 10 D D k M d l 66 2020 202110. Dee Doke Mandalay 66 2020-2021 11. Nam Li Kachin 165 2020-2021 12. Dum Ban Kachin 130 2020-2021 13 Middl P l M d l 100 2021 202213. Middle Paunglaung Mandalay 100 2021-2022 14. Pha Nam (Nam Pawn) Kayah 105 2020-2021 15. Phe San(Nam Pawn) Kayah 45 2020-2021 16 U N P K h 150 2020 202116. Upper Nam Pawn (Nam Pawn) Kayah 150 2020-2021 21 Investment by foreign companies on J.V / B.O.T basis No. Projects Location Installed Capacity(MW) Completion (Estimation)p y( ) ( ) 17. Lower Nam Pawn (Nam Pawn) Kayah 105 2020-2021 (Nam Pawn) 18. Upper Hawkhan (Nam Pawn) Kayah 180 2020-2021 (Nam Pawn) 19. Namlang Shan 210 2020-2021 20. Namhsim Shan 30 2020-2021 Total 10,334 22
- 22. Key Requirements Internationally friendly principle Internationally friendly principle Technical know-how and Financial assistance Technical know how and Financial assistance Reasonable tariff rate Reasonable tariff rate Environmentally Socially Responsible mannery y p 23 THANK YOU 24