NJ Future population changes in built out municipalities 7-2012
•
0 likes•911 views

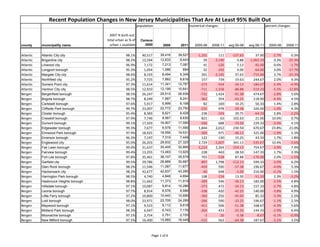
A spreadsheet sorted by county and municipality showing trends in population growth since the 2000 Census in New Jersey municipalities that are at least 95% built out.

Recommended
More Related Content
Similar to NJ Future population changes in built out municipalities 7-2012
Similar to NJ Future population changes in built out municipalities 7-2012 (20)
More from New Jersey Future
More from New Jersey Future (20)
Recently uploaded
Recently uploaded (20)
NJ Future population changes in built out municipalities 7-2012
- 1. Recent Population Changes in New Jersey Municipalities That Are At Least 95% Built Out population: numerical changes: percent changes: 2007 % built-out: total urban as % of Census county municipality name urban + available 2000 2008 2011 2000-08 2008-11 avg 00-08 avg 08-11 2000-08 2008-11 Atlantic Atlantic City city 98.1% 40,517 39,416 39,527 -1,101 111 -137.63 37.00 -2.7% 0.3% Atlantic Brigantine city 98.2% 12,594 12,633 9,443 39 -3,190 4.88 -1,063.33 0.3% -25.3% Atlantic Linwood city 96.9% 7,172 7,213 7,087 41 -126 5.13 -42.00 0.6% -1.7% Atlantic Longport borough 95.3% 1,054 1,086 894 32 -192 4.00 -64.00 3.0% -17.7% Atlantic Margate City city 98.6% 8,193 8,494 6,349 301 -2,145 37.63 -715.00 3.7% -25.3% Atlantic Northfield city 95.2% 7,725 7,882 8,616 157 734 19.63 244.67 2.0% 9.3% Atlantic Somers Point city 97.3% 11,614 11,341 10,787 -273 -554 -34.13 -184.67 -2.4% -4.9% Atlantic Ventnor City city 98.5% 12,910 12,199 10,641 -711 -1,558 -88.88 -519.33 -5.5% -12.8% Bergen Bergenfield borough 98.5% 26,247 25,515 26,939 -731 1,424 -91.38 474.67 -2.8% 5.6% Bergen Bogota borough 98.7% 8,249 7,887 8,241 -362 354 -45.25 118.00 -4.4% 4.5% Bergen Carlstadt borough 97.6% 5,917 5,999 6,168 82 169 10.25 56.33 1.4% 2.8% Bergen Cliffside Park borough 99.7% 23,007 22,772 23,750 -235 978 -29.38 326.00 -1.0% 4.3% Bergen Closter borough 95.4% 8,383 8,621 8,428 238 -193 29.75 -64.33 2.8% -2.2% Bergen Cresskill borough 97.9% 7,746 8,567 8,630 821 63 102.63 21.00 10.6% 0.7% Bergen Dumont borough 99.1% 17,503 16,907 17,595 -596 688 -74.50 229.33 -3.4% 4.1% Bergen Edgewater borough 99.3% 7,677 9,578 11,590 1,844 2,012 230.50 670.67 23.8% 21.0% Bergen Elmwood Park borough 97.9% 18,925 18,556 19,531 -369 975 -46.13 325.00 -1.9% 5.3% Bergen Emerson borough 96.3% 7,197 7,319 7,449 122 130 15.25 43.33 1.7% 1.8% Bergen Englewood city 95.0% 26,203 28,932 27,325 2,729 -1,607 341.13 -535.67 10.4% -5.6% Bergen Fair Lawn borough 99.0% 31,637 30,405 32,669 -1,233 2,264 -154.13 754.67 -3.9% 7.4% Bergen Fairview borough 99.4% 13,255 13,483 13,925 228 442 28.50 147.33 1.7% 3.3% Bergen Fort Lee borough 97.8% 35,461 36,107 35,579 703 -528 87.88 -176.00 2.0% -1.5% Bergen Garfield city 99.5% 29,786 28,889 30,687 -897 1,798 -112.13 599.33 -3.0% 6.2% Bergen Glen Rock borough 98.2% 11,546 11,087 11,677 -459 590 -57.38 196.67 -4.0% 5.3% Bergen Hackensack city 98.2% 42,677 42,637 43,285 -40 648 -5.00 216.00 -0.1% 1.5% Bergen Harrington Park borough 98.5% 4,740 4,848 4,694 108 -154 13.50 -51.33 2.3% -3.2% Bergen Hasbrouck Heights borough 98.8% 11,662 11,373 11,919 -289 546 -36.13 182.00 -2.5% 4.8% Bergen Hillsdale borough 97.1% 10,087 9,814 10,286 -273 472 -34.13 157.33 -2.7% 4.8% Bergen Leonia borough 97.7% 8,914 8,576 8,996 -338 420 -42.25 140.00 -3.8% 4.9% Bergen Little Ferry borough 97.2% 10,800 10,440 10,696 -360 256 -45.00 85.33 -3.3% 2.5% Bergen Lodi borough 98.0% 23,971 23,705 24,295 -266 590 -33.25 196.67 -1.1% 2.5% Bergen Maywood borough 97.1% 9,523 9,112 9,618 -411 506 -51.38 168.67 -4.3% 5.6% Bergen Midland Park borough 98.3% 6,947 6,743 7,176 -204 433 -25.50 144.33 -2.9% 6.4% Bergen Moonachie borough 97.1% 2,754 2,751 2,725 -3 -26 -0.38 -8.67 -0.1% -0.9% Bergen New Milford borough 97.5% 16,400 15,885 16,448 -515 563 -64.38 187.67 -3.1% 3.5% Page 1 of 6
- 2. Recent Population Changes in New Jersey Municipalities That Are At Least 95% Built Out population: numerical changes: percent changes: 2007 % built-out: total urban as % of Census county municipality name urban + available 2000 2008 2011 2000-08 2008-11 avg 00-08 avg 08-11 2000-08 2008-11 Bergen Northvale borough 97.7% 4,460 4,693 4,669 233 -24 29.13 -8.00 5.2% -0.5% Bergen Oradell borough 97.6% 8,047 7,755 8,031 -292 276 -36.50 92.00 -3.6% 3.6% Bergen Palisades Park borough 97.9% 17,073 19,266 19,752 2,193 486 274.13 162.00 12.8% 2.5% Bergen Paramus borough 96.1% 25,737 26,015 26,507 278 492 34.75 164.00 1.1% 1.9% Bergen Park Ridge borough 98.3% 8,708 8,863 8,701 155 -162 19.38 -54.00 1.8% -1.8% Bergen Ridgefield borough 96.8% 10,830 10,807 11,104 -23 297 -2.88 99.00 -0.2% 2.7% Bergen Ridgewood village 97.1% 24,936 24,102 25,120 -834 1,018 -104.25 339.33 -3.3% 4.2% Bergen River Edge borough 98.4% 10,946 10,627 11,414 -319 787 -39.88 262.33 -2.9% 7.4% Bergen River Vale township 97.4% 9,449 9,593 9,723 144 130 18.00 43.33 1.5% 1.4% Bergen Rochelle Park township 98.6% 5,528 6,046 5,566 518 -480 64.75 -160.00 9.4% -7.9% Bergen Saddle Brook township 98.0% 13,155 13,845 13,748 690 -97 86.25 -32.33 5.2% -0.7% Bergen South Hackensack township 99.1% 2,249 2,252 2,393 3 141 0.38 47.00 0.1% 6.3% Bergen Teaneck township 96.6% 39,260 38,541 40,033 -719 1,492 -89.88 497.33 -1.8% 3.9% Bergen Tenafly borough 97.2% 13,806 14,593 14,582 787 -11 98.38 -3.67 5.7% -0.1% Bergen Teterboro borough 96.7% 18 17 67 -1 50 -0.13 16.67 -5.6% 294.1% Bergen Waldwick borough 96.8% 9,622 9,481 9,689 -141 208 -17.63 69.33 -1.5% 2.2% Bergen Wallington borough 99.2% 11,583 11,249 11,409 -334 160 -41.75 53.33 -2.9% 1.4% Bergen Westwood borough 99.1% 10,999 10,664 10,979 -335 315 -41.88 105.00 -3.0% 3.0% Bergen Wood-Ridge borough 97.9% 7,644 7,430 7,677 -214 247 -26.75 82.33 -2.8% 3.3% Burlington Bordentown city 96.2% 3,969 3,830 3,930 -141 100 -17.63 33.33 -3.6% 2.6% Burlington Fieldsboro borough 96.6% 522 563 542 43 -21 5.38 -7.00 8.3% -3.7% Burlington Maple Shade township 95.3% 19,079 19,154 19,167 75 13 9.38 4.33 0.4% 0.1% Burlington Medford Lakes borough 97.9% 4,173 4,119 4,153 -54 34 -6.75 11.33 -1.3% 0.8% Burlington Riverside township 95.9% 7,911 7,710 8,095 -201 385 -25.13 128.33 -2.5% 5.0% Burlington Riverton borough 98.7% 2,759 2,636 2,784 -123 148 -15.38 49.33 -4.5% 5.6% Burlington Willingboro township 97.5% 33,008 36,415 31,688 3,407 -4,727 425.88 -1,575.67 10.3% -13.0% Camden Audubon borough 99.3% 9,182 8,894 8,813 -288 -81 -36.00 -27.00 -3.1% -0.9% Camden Audubon Park borough 98.9% 1,102 1,058 1,022 -44 -36 -5.50 -12.00 -4.0% -3.4% Camden Brooklawn borough 97.9% 2,354 2,263 1,954 -88 -309 -11.00 -103.00 -3.7% -13.7% Camden Camden city 95.0% 79,904 79,519 77,283 -385 -2,236 -48.13 -745.33 -0.5% -2.8% Camden Collingswood borough 98.4% 14,326 13,854 13,914 -477 60 -59.63 20.00 -3.3% 0.4% Camden Gloucester City city 95.5% 11,484 11,553 11,445 69 -108 8.63 -36.00 0.6% -0.9% Camden Haddon Heights borough 96.5% 7,547 7,588 7,468 41 -120 5.13 -40.00 0.5% -1.6% Camden Haddon township 98.3% 14,651 14,351 14,694 -300 343 -37.50 114.33 -2.0% 2.4% Camden Haddonfield borough 97.0% 11,659 11,454 11,582 -205 128 -25.63 42.67 -1.8% 1.1% Page 2 of 6
- 3. Recent Population Changes in New Jersey Municipalities That Are At Least 95% Built Out population: numerical changes: percent changes: 2007 % built-out: total urban as % of Census county municipality name urban + available 2000 2008 2011 2000-08 2008-11 avg 00-08 avg 08-11 2000-08 2008-11 Camden Laurel Springs borough 96.8% 1,970 1,908 1,907 -62 -1 -7.75 -0.33 -3.1% -0.1% Camden Magnolia borough 95.6% 4,409 4,334 4,338 -64 4 -8.00 1.33 -1.5% 0.1% Camden Merchantville borough 100.0% 3,801 3,769 3,818 -32 49 -4.00 16.33 -0.8% 1.3% Camden Mount Ephraim borough 98.1% 4,495 4,396 4,673 -99 277 -12.38 92.33 -2.2% 6.3% Camden Oaklyn borough 99.0% 4,188 4,041 4,035 -142 -6 -17.75 -2.00 -3.4% -0.1% Camden Woodlynne borough 99.2% 2,796 2,694 2,976 -102 282 -12.75 94.00 -3.6% 10.5% Cape May Avalon borough 98.6% 2,143 2,088 1,325 -55 -763 -6.88 -254.33 -2.6% -36.5% Cape May Cape May city 99.7% 4,034 3,713 3,587 -321 -126 -40.13 -42.00 -8.0% -3.4% Cape May Cape May Point borough 99.3% 241 223 289 -18 66 -2.25 22.00 -7.5% 29.6% Cape May North Wildwood city 97.5% 4,935 4,843 4,013 -92 -830 -11.50 -276.67 -1.9% -17.1% Cape May Ocean City city 99.9% 15,378 14,863 11,619 -515 -3,244 -64.38 -1,081.33 -3.3% -21.8% Cape May Sea Isle City city 99.7% 2,835 2,919 2,099 84 -820 10.50 -273.33 3.0% -28.1% Cape May Stone Harbor borough 99.6% 1,128 1,017 860 -111 -157 -13.88 -52.33 -9.8% -15.4% Cape May Wildwood Crest borough 98.8% 3,980 4,048 3,247 68 -801 8.50 -267.00 1.7% -19.8% Essex Belleville township 98.9% 35,928 33,755 35,981 -2,171 2,226 -271.38 742.00 -6.0% 6.6% Essex Bloomfield township 98.3% 47,683 43,682 47,387 -4,001 3,705 -500.13 1,235.00 -8.4% 8.5% Essex Caldwell borough 95.9% 7,584 7,106 7,833 -478 727 -59.75 242.33 -6.3% 10.2% Essex City of Orange township 98.3% 32,868 30,909 30,180 -1,890 -729 -236.25 -243.00 -5.8% -2.4% Essex East Orange city 97.1% 69,824 65,120 64,365 -4,704 -755 -588.00 -251.67 -6.7% -1.2% Essex Glen Ridge borough 99.3% 7,271 6,651 7,539 -620 888 -77.50 296.00 -8.5% 13.4% Essex Irvington township 98.9% 60,695 56,073 54,008 -4,622 -2,065 -577.75 -688.33 -7.6% -3.7% Essex Maplewood township 98.2% 23,868 21,933 23,904 -1,943 1,971 -242.88 657.00 -8.1% 9.0% Essex Montclair township 99.2% 38,977 36,839 37,726 -1,819 887 -227.38 295.67 -4.7% 2.4% Essex Newark city 97.6% 273,546 277,376 277,540 4,843 164 605.38 54.67 1.8% 0.1% Essex Nutley township 98.8% 27,362 26,064 28,414 -1,298 2,350 -162.25 783.33 -4.7% 9.0% Essex South Orange Village township 97.7% 16,964 15,865 16,221 -1,108 356 -138.50 118.67 -6.5% 2.2% Gloucester Woodbury city 98.2% 10,307 10,464 10,201 155 -263 19.38 -87.67 1.5% -2.5% Hudson East Newark borough 100.0% 2,377 2,129 2,432 -248 303 -31.00 101.00 -10.4% 14.2% Hudson Guttenberg town 100.0% 10,807 10,464 11,299 -343 835 -42.88 278.33 -3.2% 8.0% Hudson Hoboken city 99.7% 38,577 40,314 50,545 1,737 10,231 217.13 3,410.33 4.5% 25.4% Hudson Jersey City city 95.6% 240,055 239,658 250,323 -397 10,665 -49.63 3,555.00 -0.2% 4.5% Hudson North Bergen township 96.2% 58,092 54,986 61,444 -3,106 6,458 -388.25 2,152.67 -5.3% 11.7% Hudson Union City city 99.8% 67,088 61,902 67,187 -5,194 5,285 -649.25 1,761.67 -7.7% 8.5% Hudson Weehawken township 97.2% 13,501 12,321 12,695 -1,172 374 -146.50 124.67 -8.7% 3.0% Hudson West New York town 97.6% 45,768 46,175 50,260 407 4,085 50.88 1,361.67 0.9% 8.8% Page 3 of 6
- 4. Recent Population Changes in New Jersey Municipalities That Are At Least 95% Built Out population: numerical changes: percent changes: 2007 % built-out: total urban as % of Census county municipality name urban + available 2000 2008 2011 2000-08 2008-11 avg 00-08 avg 08-11 2000-08 2008-11 Hunterdon Flemington borough 96.0% 4,200 4,307 4,569 107 262 13.38 87.33 2.5% 6.1% Mercer Hightstown borough 96.5% 5,216 5,294 5,506 78 212 9.75 70.67 1.5% 4.0% Mercer Pennington borough 95.0% 2,696 2,657 2,592 -39 -65 -4.88 -21.67 -1.4% -2.4% Mercer Princeton borough 97.1% 14,203 13,389 12,131 -169 -1,258 -21.13 -419.33 -1.2% -9.4% Mercer Trenton city 97.5% 85,403 82,960 84,899 -2,437 1,939 -304.63 646.33 -2.9% 2.3% Middlesex Dunellen borough 99.4% 6,823 6,966 7,268 143 302 17.88 100.67 2.1% 4.3% Middlesex Jamesburg borough 95.7% 6,025 6,338 5,948 313 -390 39.13 -130.00 5.2% -6.2% Middlesex Middlesex borough 96.4% 13,717 13,587 13,710 -130 123 -16.25 41.00 -0.9% 0.9% Middlesex Milltown borough 96.5% 7,000 6,934 6,932 -66 -2 -8.25 -0.67 -0.9% 0.0% Middlesex South Plainfield borough 97.4% 21,810 22,516 23,513 706 997 88.25 332.33 3.2% 4.4% Monmouth Allenhurst borough 98.0% 718 699 497 -19 -202 -2.38 -67.33 -2.6% -28.9% Monmouth Allentown borough 96.1% 1,882 1,844 1,831 -38 -13 -4.75 -4.33 -2.0% -0.7% Monmouth Asbury Park city 99.0% 16,930 16,534 16,132 -396 -402 -49.50 -134.00 -2.3% -2.4% Monmouth Atlantic Highlands borough 96.9% 4,705 4,598 4,388 -109 -210 -13.63 -70.00 -2.3% -4.6% Monmouth Avon-by-the-Sea borough 96.9% 2,244 2,200 1,903 -44 -297 -5.50 -99.00 -2.0% -13.5% Monmouth Belmar borough 95.8% 6,045 5,902 5,800 -143 -102 -17.88 -34.00 -2.4% -1.7% Monmouth Bradley Beach borough 99.7% 4,793 4,840 4,302 47 -538 5.88 -179.33 1.0% -11.1% Monmouth Deal borough 99.2% 1,070 1,044 751 -26 -293 -3.25 -97.67 -2.4% -28.1% Monmouth Fair Haven borough 97.2% 5,937 5,906 6,128 -36 222 -4.50 74.00 -0.6% 3.8% Monmouth Farmingdale borough 98.3% 1,587 1,569 1,330 -18 -239 -2.25 -79.67 -1.1% -15.2% Monmouth Freehold borough 98.1% 10,976 11,413 12,063 437 650 54.63 216.67 4.0% 5.7% Monmouth Interlaken borough 99.5% 900 876 821 -24 -55 -3.00 -18.33 -2.7% -6.3% Monmouth Keansburg borough 98.8% 10,732 10,543 10,116 -189 -427 -23.63 -142.33 -1.8% -4.1% Monmouth Lake Como borough 100.0% 1,806 1,776 1,760 -30 -16 -3.75 -5.33 -1.7% -0.9% Monmouth Little Silver borough 97.3% 6,170 6,114 5,956 -71 -158 -8.88 -52.67 -1.1% -2.6% Monmouth Loch Arbour village 96.2% 280 274 194 -6 -80 -0.75 -26.67 -2.1% -29.2% Monmouth Long Branch city 97.2% 31,340 32,589 30,751 1,249 -1,838 156.13 -612.67 4.0% -5.6% Monmouth Manasquan borough 97.3% 6,310 6,247 5,903 -63 -344 -7.88 -114.67 -1.0% -5.5% Monmouth Monmouth Beach borough 99.6% 3,595 3,567 3,282 -28 -285 -3.50 -95.00 -0.8% -8.0% Monmouth Neptune City borough 98.7% 5,218 5,111 4,873 -96 -238 -12.00 -79.33 -1.8% -4.7% Monmouth Oceanport borough 97.9% 5,807 5,730 5,837 -77 107 -9.63 35.67 -1.3% 1.9% Monmouth Red Bank borough 98.7% 11,844 11,859 12,218 35 359 4.38 119.67 0.3% 3.0% Monmouth Rumson borough 96.3% 7,137 7,258 7,130 121 -128 15.13 -42.67 1.7% -1.8% Monmouth Sea Bright borough 98.2% 1,818 1,803 1,414 -15 -389 -1.88 -129.67 -0.8% -21.6% Monmouth Shrewsbury borough 98.0% 3,590 3,775 3,813 185 38 23.13 12.67 5.2% 1.0% Page 4 of 6
- 5. Recent Population Changes in New Jersey Municipalities That Are At Least 95% Built Out population: numerical changes: percent changes: 2007 % built-out: total urban as % of Census county municipality name urban + available 2000 2008 2011 2000-08 2008-11 avg 00-08 avg 08-11 2000-08 2008-11 Monmouth Shrewsbury township 96.8% 1,098 1,068 1,141 -30 73 -3.75 24.33 -2.7% 6.8% Monmouth Spring Lake borough 97.3% 3,567 3,517 2,997 -50 -520 -6.25 -173.33 -1.4% -14.8% Monmouth Spring Lake Heights borough 97.0% 5,227 5,130 4,718 -97 -412 -12.13 -137.33 -1.9% -8.0% Monmouth West Long Branch borough 97.6% 8,258 8,358 8,105 100 -253 12.50 -84.33 1.2% -3.0% Morris Chatham borough 96.1% 8,460 8,171 9,012 -236 841 -29.50 280.33 -2.8% 10.3% Morris Dover town 97.5% 18,188 17,774 18,257 -339 483 -42.38 161.00 -1.9% 2.7% Morris Victory Gardens borough 98.9% 1,546 1,479 1,527 -70 48 -8.75 16.00 -4.5% 3.2% Ocean Barnegat Light borough 99.1% 764 839 577 75 -262 9.38 -87.33 9.8% -31.2% Ocean Bay Head borough 97.8% 1,238 1,268 973 30 -295 3.75 -98.33 2.4% -23.3% Ocean Beach Haven borough 99.4% 1,278 1,391 1,179 113 -212 14.13 -70.67 8.8% -15.2% Ocean Harvey Cedars borough 99.6% 359 394 339 35 -55 4.38 -18.33 9.7% -14.0% Ocean Lavallette borough 100.0% 2,665 2,757 1,884 92 -873 11.50 -291.00 3.5% -31.7% Ocean Long Beach township 98.0% 3,329 3,552 3,066 223 -486 27.88 -162.00 6.7% -13.7% Ocean Mantoloking borough 95.7% 423 453 298 30 -155 3.75 -51.67 7.1% -34.2% Ocean Ocean Gate borough 97.8% 2,076 2,140 2,022 64 -118 8.00 -39.33 3.1% -5.5% Ocean Point Pleasant Beach borough 95.3% 5,314 5,429 4,688 115 -741 14.38 -247.00 2.2% -13.6% Ocean Point Pleasant borough 99.1% 19,306 20,156 18,481 850 -1,675 106.25 -558.33 4.4% -8.3% Ocean Seaside Heights borough 98.9% 3,155 3,343 2,901 188 -442 23.50 -147.33 6.0% -13.2% Ocean Seaside Park borough 97.9% 2,263 2,317 1,587 56 -730 7.00 -243.33 2.5% -31.5% Ocean Ship Bottom borough 98.0% 1,384 1,451 1,159 67 -292 8.38 -97.33 4.8% -20.1% Ocean Surf City borough 97.0% 1,442 1,559 1,211 117 -348 14.63 -116.00 8.1% -22.3% Passaic Clifton city 96.9% 78,672 77,811 84,269 -1,251 6,458 -156.38 2,152.67 -1.6% 8.3% Passaic Hawthorne borough 96.8% 18,218 17,909 18,821 -309 912 -38.63 304.00 -1.7% 5.1% Passaic Passaic city 99.0% 67,861 66,580 69,893 -1,278 3,313 -159.75 1,104.33 -1.9% 5.0% Passaic Paterson city 98.9% 149,222 144,961 146,427 -4,261 1,466 -532.63 488.67 -2.9% 1.0% Salem Penns Grove borough 98.7% 4,886 4,692 5,132 -194 440 -24.25 146.67 -4.0% 9.4% Somerset Bound Brook borough 98.7% 10,155 10,329 10,449 174 120 21.75 40.00 1.7% 1.2% Somerset Manville borough 98.8% 10,343 10,273 10,392 -70 119 -8.75 39.67 -0.7% 1.2% Somerset North Plainfield borough 98.6% 21,103 20,746 22,035 -357 1,289 -44.63 429.67 -1.7% 6.2% Somerset Somerville borough 96.0% 12,423 12,338 12,150 -85 -188 -10.63 -62.67 -0.7% -1.5% Somerset South Bound Brook borough 98.3% 4,492 5,305 4,583 813 -722 101.63 -240.67 18.1% -13.6% Sussex Sussex borough 96.1% 2,145 2,141 2,119 -4 -22 -0.50 -7.33 -0.2% -1.0% Sussex Walpack township 100.0% 41 39 16 -2 -23 -0.25 -7.67 -4.9% -59.0% Union Clark township 96.4% 14,597 14,313 14,840 -284 527 -35.50 175.67 -1.9% 3.7% Union Elizabeth city 98.0% 120,568 124,400 125,660 3,832 1,260 479.00 420.00 3.2% 1.0% Page 5 of 6
- 6. Recent Population Changes in New Jersey Municipalities That Are At Least 95% Built Out population: numerical changes: percent changes: 2007 % built-out: total urban as % of Census county municipality name urban + available 2000 2008 2011 2000-08 2008-11 avg 00-08 avg 08-11 2000-08 2008-11 Union Fanwood borough 97.2% 7,174 7,072 7,360 -102 288 -12.75 96.00 -1.4% 4.1% Union Garwood borough 99.3% 4,153 4,390 4,250 237 -140 29.63 -46.67 5.7% -3.2% Union Hillside township 98.8% 21,747 21,124 21,524 -623 400 -77.88 133.33 -2.9% 1.9% Union Kenilworth borough 97.3% 7,675 7,596 7,959 -79 363 -9.88 121.00 -1.0% 4.8% Union Plainfield city 99.3% 47,829 46,046 50,085 -1,783 4,039 -222.88 1,346.33 -3.7% 8.8% Union Rahway city 97.3% 26,500 28,501 27,500 2,001 -1,001 250.13 -333.67 7.6% -3.5% Union Roselle borough 98.4% 21,274 20,538 21,205 -736 667 -92.00 222.33 -3.5% 3.2% Union Roselle Park borough 99.1% 13,281 12,765 13,372 -516 607 -64.50 202.33 -3.9% 4.8% Union Scotch Plains township 95.4% 22,732 22,817 23,643 85 826 10.63 275.33 0.4% 3.6% Union Summit city 95.7% 21,131 20,522 21,578 -609 1,056 -76.13 352.00 -2.9% 5.1% Union Union township 95.7% 54,405 53,335 56,954 -1,070 3,619 -133.75 1,206.33 -2.0% 6.8% Union Westfield town 95.4% 29,644 29,397 30,487 -247 1,090 -30.88 363.33 -0.8% 3.7% Union Winfield township 99.1% 1,514 1,436 1,480 -78 44 -9.75 14.67 -5.2% 3.1% New Jersey total . 8,414,350 8,663,398 8,821,155 249,038 157,757 31,129.75 52,585.67 3.0% 1.8% State Plan Urban Centers 1,037,788 1,039,194 1,057,103 2,760 17,909 345.00 5,969.67 0.3% 1.7% (Newark, Jersey City, Paterson, Elizabeth, Trenton, Camden, New Brunswick, Atlantic City) HCDN 30 distressed cities from "Cities in Transition": 1,795,021 1,772,086 1,818,994 -21,525 46,908 -2,690.63 15,636.00 -1.2% 2.6% at least 95% built out (188 munis) 3,351,597 3,312,223 3,378,874 -37,576 66,651 -4,697.00 22,217.00 -1.1% 2.0% less than 50% built out (110 munis) 755,510 835,998 847,883 79,159 11,885 9,894.88 3,961.67 10.5% 1.4% Page 6 of 6