Contenu connexe
Similaire à Origami logic-periodic-table-of-marketing-signals
Similaire à Origami logic-periodic-table-of-marketing-signals (20)
Plus de Noreen Seebacher (15)
Origami logic-periodic-table-of-marketing-signals
- 1. Do you know how your
campaigns performed today?
This is a powerful yet simple question that is incredibly hard to
answer. The explosion of new channels, platforms, media, and
devices, coupled with the velocity of change, has made modern
marketing difficult to measure. Despite advances in data-driven
marketing, the amount and quality of insights being generated
today does not even scratch the surface of what is possible.
Marketing signals are the gap between raw data and insights. They
are responses to your marketing activity, such as ad clicks, social
interactions, or website visits, along with derived performance
indicators provided by marketing platforms such as click-through
rate or cost per conversion. With the Marketing Signals Frame-
work, marketers now have a standardized framework with which
they can easily identify and understand the signals that will drive
their business forward.
Marketing signals are
the gap between raw
data and insights.
Why think in terms of signals?
Marketing measurement is becoming increasingly diverse and
sophisticated. As channels, platforms, and devices proliferate,
there are more and more ways that consumers and brands can
interact. This is causing an explosion in the number and types of
responses to marketing activity, making it difficult for marketers to
understand which of them matter, and which are relevant to their
objectives.
The Marketing Signals Framework provides a method to the
madness. By organizing key signals across all marketing channels,
the framework makes it easy to understand which of them are key
to campaign success. Selecting signals according to campaign
objectives instead of predefined sets of metrics enables marketers
to better align their marketing measurement towards their goals,
and generate insights more efficiently.
What is the Periodic Table of Marketing Signals?
The Periodic Table of Marketing Signals is a representation of the
Marketing Signals Framework, and organizes signals across
marketing channels according to the following dimensions:
• Channel: The channel where your marketing activity is executed.
• Objective: The business objective of the campaign or activity.
• Signal Type: The approach used to quantify campaign success.
Using the Framework, you can easily identify the signals that
matter based on the objective for your campaign or marketing
activity, the channels you are using for activation, and the
approach you want to use to quantify success.
Using the Periodic Table of Marketing Signals:
An Example
Background:
Your company is launching its product in a new market, with a
cross-channel campaign activating across TV, Display, and Social
channels. Since this is an initial entrance focused on growth, you
do not expect to show ROI immediately. The primary objective is to
garner as much Awareness as possible, with media efficiency also
being an important factor — as you have limited budget. Addition-
ally, you are interested in measuring Website Engagement volume
to assess increase in brand awareness.
Finding Awareness Signals:
Using the periodic table, you browse through the Awareness block,
colored in red, searching for Volume and Efficiency signals in the
relevant channels: TV, DPL, and SOC. Using the index to the right
makes it easy for you to find the signal blocks of interest. You end
up with the following set of signals to measure:
TV: Gross Impressions, Net Reach, GRP, TRP, Cost per Point, CPM
Display: Impressions, Reach, Display Time, CPM
Social: Impressions, Unique Impressions, CPM
Finding Engagement Signals:
You then move to the Engagement block, colored in orange, and
locate the relevant WEB volume signals:
Web: Visits, Visitors, Page Views, Time on Site, Actions
The periodic table represents just one portion of the entire
marketing signals framework. Layers above include compound
signals such as cross-channel impressions, or total social engage-
ment across all engagement types. These compound signals help
to simplify measurement by reducing the total number of signals,
and can be customized based on campaign and context.
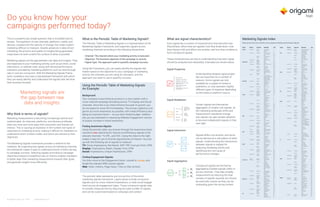
What are signal characteristics?
Each signal has a number of characteristics that describe how
they behave, where they are applied, how they break down, how
they interact with and affect one another, and how they combine to
form compound signals.
These characteristics are key to understanding how each signal
should be analyzed and interpreted. Examples are shown below.
Signal Properties
Understanding detailed signal proper-
ties are important for a number of
reasons. Some signals are only
available for a subset of media or
publishers, or may represent slightly
different types of response depending
on the media or platform source.
Signal Breakdown
Certain signals are themselves
aggregates of smaller sub-signals. As
the marketing landscape shifts and
measurement standards change,
sub-signals can gain greater adoption
to become independent signals in their
own right.
Signal Interaction
Signals affect one another, and some
can be derived as a calculation of other
signals. Understanding the interactions
between signals is integral for
analyzing marketing results and
identifying the root cause of
performance changes.
Signal Aggregation
Compound signals are formed by
aggregating multiple signals within or
across channels. They help simplify
measurement by reducing the total
number of signals required, but should
be used with caution as they can be
misleading given the wrong context.
• Media Type: Paid
• Aggregation: Non-addititve
• Weight Metric: Impressions
• Publishers: Google, Bing, Yahoo,
Baidu, Yandex, etc.
• Affects: Click-through Rate,
Cost per Click
• Affected By: Bid, Quality, Score,
Competitive Bid
Avg
Position
Quality
19 SEM
• Completion
• Avg View Time
• Avg View Rate
• Skips
• Expand
• Collapse
• Full Screen
• Pause
• Rewind
• Mute
• Play
• Replay
• Resize
• Mouseover
• Navigation
Interaction
Volume
91 DPL
Amplification
Volume
SOC
w1
w2
Share
Volume
258 SOC
Retweet
Volume
259 SOC
w2
Re-Share
Volume
260 SOC
Avg Order
Value
Quality
210 WEB
Revenue
Volume
208 WEB
Conversion
Volume
207 WEB
Channel Objective Signal Type Signal Name Index
Affiliate Awareness Quality Click-thru Rate 3
Volume Impression 1
Reach 2
Conversion Efficiency Commission Rate 177
Cost per Action 175
ROI 176
Quality Avg Order Value 174
Volume Conversion 172
Revenue 173
Engagement Quality Conversion Rate 92
Volume Click 91
CRM/Loyalty Advocacy Quality NPS 263
Volume Referral 262
Conversion Efficiency Cost per Conversion 239
ROI 240
Quality Close Rate 238
Volume Conversion 236
Revenue 237
Engagement Efficiency Cost per Lead 171
Quality Avg Lead Score 169
Qualification Rate 170
Volume Lead 168
Loyalty Quality CLV 256
Customer Effort 255
Customer Satisfaction 254
Retention Rate 253
Volume Program Signup 251
Repeat Purchase 252
Direct Mail Awareness Quality Frequency 42
Response Rate 43
Share Penetration 44
Volume Distribution 40
Reach 41
Conversion Efficiency Cost per Order 213
ROI 214
Volume Conversion 211
Revenue 212
Engagement Efficiency Cost per Response 148
Quality Conversion Rate 147
Volume Response 146
Display Awareness Efficiency CPM 11
Quality Click-thru Rate 10
Frequency 7
Interaction Rate 9
Viewability 8
Volume Display Time 6
Impression 4
Reach 5
Conversion Efficiency Cost per Action 181
ROI/ROAS 182
Quality Avg Order Value 180
Volume Conversion 178
Revenue 179
Engagement Efficiency Cost per Click 98
Quality Avg Interaction Time 96
Conversion Rate 97
Volume Click 93
Interaction 94
Interaction Time 95
Email Awareness Quality Click Rate 15
Open Rate 14
Volume Open 13
Send 12
Conversion Efficiency Cost per Action 186
ROI 187
Quality Avg Order Value 185
Volume Conversion 183
Revenue 184
Engagement Quality Conversion Rate 101
Volume Click 99
Reply 100
Loyalty Quality Subscription Rate 242
Volume Net Subscription 241
Event Awareness Quality Recall 46
Volume Gross Attendance 45
Conversion Efficiency Cost per Close 218
ROI 219
Quality Close Rate 217
Volume Conversion 215
Revenue 216
Engagement Efficiency Cost per Lead 152
Quality Avg Lead Score 150
Qualification Rate 151
Volume Lead 149
Mobile Awareness Quality Activation Rate 18
Uninstall Rate 19
Share Store Rank 20
Volume Activation 17
Install 16
Conversion Efficiency Cost per Install 191
Quality Avg Revenue per User 190
Volume Conversion 188
Revenue 189
Engagement Quality Avg Session Length 105
Volume Active Users 102
Session 103
Usage Time 104
Loyalty Quality Retention Rate 243
Out-of-home Awareness Efficiency Cost per Point 54
CPM 55
Quality Ad Recall 51
Frequency 52
Inquiry Rate 53
Share Share of Voice 56
Volume Effective Reach 48
Gross Impression 47
GRP 49
TRP 50
Conversion Efficiency Cost per Order 222
Media Efficiency 223
Volume Conversion 220
Revenue 221
Engagement Efficiency Cost per Inquiry 155
Quality Conversion Rate 154
Volume Inquiry 153
Paid Search Awareness Quality Avg Position 22
Click-thru Rate 23
Share Impression Share 24
Volume Impression 21
Conversion Efficiency Cost per Action 195
ROI/ROAS 196
Quality Avg Order Value 194
Volume Conversion 192
Revenue 193
Engagement Efficiency Cost per Click 108
Quality Conversion Rate 107
Share Click Share 109
Volume Click 106
PR Awareness Quality Accuracy 59
Sentiment 60
Volume Clip Count 57
Media Impression 58
Channel Objective Signal Type Signal Name Index
Engagement Quality Response Sentiment 158
Volume Inbound Traffic 156
Social Mention 157
Print Awareness Efficiency Cost per Point 67
Cost per Reader 68
Quality Ad Recall 65
Inquiry Rate 66
Share Penetration 70
Share of Voice 69
Volume Gross Impression 61
GRP 63
Net Reach 62
TRP 64
Conversion Efficiency Cost per Order 226
Media Efficiency 227
Volume Conversion 224
Revenue 225
Engagement Efficiency Cost per Inquiry 161
Quality Conversion Rate 160
Volume Inquiry 159
Radio Awareness Efficiency Cost per Point 78
CPM 79
Quality Ad Recall 75
Frequency 76
Inquiry Rate 77
Share Share of Voice 80
Volume Gross Impression 71
GRP 73
Net Reach 72
TRP 74
Conversion Efficiency Cost per Order 230
Media Efficiency 231
Volume Conversion 228
Revenue 229
Engagement Efficiency Cost per Inquiry 164
Quality Conversion Rate 163
Volume Inquiry 162
SEO Awareness Quality Click-thru Rate 27
Keyword Rank 26
Share Impression Share 28
Volume Impression 25
Engagement Quality Bounce Rate 113
Share Traffic Share 114
Volume Direct Visit 110
Organic Visit 111
Referral Visit 112
Social Advocacy Volume Re-Share 260
Retweet 259
Share 258
Storyteller 257
Awareness Efficiency CPM 34
Quality Click-thru Rate 33
Engagement Rate 32
Frequency 31
Volume Impression 29
Unique Impression 30
Conversion Efficiency Cost per Action 200
ROI/ROAS 201
Quality Avg Order Value 199
Volume Conversion 197
Revenue 198
Engagement Efficiency Cost per Click 125
Cost per Engagement 126
Cost per View 127
Quality Avg View Percentage 122
Conversion Rate 124
Response Sentiment 123
Share Share of Engagement 128
Volume Click 115
Comment 120
Consumption 116
Favorite 119
Like 118
Reply 121
Video View 117
Loyalty Efficiency Cost per Follow 248
Cost per Page Like 247
Volume Channel Subscription 246
Follow 245
Page Like 244
TV Awareness Efficiency Cost per Point 88
CPM 89
Quality Ad Recall 85
Frequency 86
Inquiry Rate 87
Share Share of Voice 90
Volume Gross Impression 81
GRP 83
Net Reach 82
TRP 84
Conversion Efficiency Cost per Order 234
Media Efficiency 235
Volume Conversion 232
Revenue 233
Engagement Efficiency Cost per Inquiry 167
Quality Conversion Rate 166
Volume Inquiry 165
Video Awareness Quality Avg View Rate 39
Frequency 37
Viewability 38
Volume Impression 35
Reach 36
Conversion Efficiency Cost per Action 205
ROI/ROAS 206
Quality Avg Order Value 204
Volume Conversion 202
Revenue 203
Engagement Efficiency Cost per Click 135
Quality Avg Completion Rate 133
Conversion Rate 134
Volume Click 129
Interaction 130
View 131
View Time 132
Website Advocacy Volume Content Share 261
Conversion Quality Avg Order Value 210
Volume Conversion 207
Items Purchased 209
Revenue 208
Engagement Quality Avg Time on Site 142
Bounce Rate 141
Conversion Rate 144
Pages per Visit 143
Share Traffic Share 145
Volume Action 140
Page View 138
Time on Site 139
Visit 136
Visitor 137
Loyalty Quality Repeat Visit Rate 250
Volume Repeat Visit 249
Marketing Signals Index
Please use this index if you would like to look up signals by marketing channel instead of objective.
© Origami Logic, Inc. 2015 origamilogic.com
- 2. AFF
Impression
1
Volume
DPL
CPM
11
Efficiency
DPL
Interaction
Rate
9
Quality
DPL
Reach
5
Volume
SEM
Average
Position
22
Quality
VID
Viewability
38
Quality
OOH
Cost per
Point
54
Efficiency
PR
Accuracy
59
Quality
PRT
Gross
Impression
61
Volume
RAD
Gross
Impression
71
Volume
AFF
Reach
2
Volume
DPL
Click-thru
Rate
10
Quality
DPL
Viewability
8
Quality
EM
Open
Rate
14
Quality
SEM
Click-thru
Rate
23
Quality
SOC
CPM
34
Efficiency
VID
Impression
35
Volume
OOH
CPM
55
Efficiency
PR
Sentiment
60
Quality
PRT
GRP
63
Volume
RAD
GRP
73
Volume
DPL
Frequency
7
Quality
DPL
Display
Time
6
Volume
EM
Open
13
Volume
SEM
Impression
Share
24
Share
SOC
Click-thru
Rate
33
Quality
VID
Reach
36
Volume
OOH
Ad Recall
51
Quality
PR
Clip Count
57
Volume
PRT
Net Reach
62
Volume
RAD
Net Reach
72
Volume
DPL
Impression
4
Volume
EM
Send
12
Volume
SEM
Impression
21
Volume
SOC
Engagement
Rate
32
Quality
DM
Frequency
42
Quality
OOH
Frequency
52
Quality
PR
Media
Impression
58
Volume
PRT
TRP
64
Volume
RAD
TRP
74
Volume
MOB
Activation
Rate
18
Quality
SEO
Click-thru
Rate
27
Quality
SOC
Frequency
31
Quality
DM
Penetration
44
Share
OOH
Share of
Voice
56
Share
PRT
Cost per
Point
67
Efficiency
RAD
Cost per
Point
78
Efficiency
TV
Cost per
Point
88
Efficiency
MOB
Uninstall
Rate
19
Quality
SEO
Keyword
Rank
26
Quality
SOC
Impression
29
Volume
DM
Distribution
40
Volume
OOH
Effective
Reach
48
Volume
PRT
Cost per
Reader
68
Efficiency
RAD
CPM
79
Efficiency
TV
CPM
89
Efficiency
MOB
Store
Rank
20
Share
SEO
Impression
Share
28
Share
SOC
Unique
Impression
30
Volume
DM
Reach
41
Volume
OOH
Gross
Impression
47
Volume
PRT
Ad Recall
65
Quality
RAD
Ad Recall
75
Quality
TV
Ad Recall
85
Quality
MOB
Activation
17
Volume
SEO
Impression
25
Volume
VID
Average
View Rate
39
Quality
EVT
Recall
46
Quality
OOH
GRP
49
Volume
PRT
Penetration
70
Share
RAD
Frequency
76
Quality
TV
Frequency
86
Quality
MOB
Install
16
Volume
VID
Frequency
37
Quality
EVT
Gross
Attendance
45
Volume
OOH
TRP
50
Volume
PRT
Share of
Voice
69
Share
RAD
Share of
Voice
80
Share
TV
Share of
Voice
90
Share
VID
Avg Comp
Rate
133
Quality
WEB
Page
View
138
Volume
OOH
Cost per
Inquiry
155
Efficiency
RAD
Inquiry
Rate
77
Quality
TV
Gross
Impression
81
Volume
AFF
Click-thru
Rate
3
Quality
EM
Reply
100
Volume
SEO
Traffic
Share
114
Share
SOC
Share of
Engmt
128
Share
VID
Click
129
Volume
WEB
Time on
Site
139
Volume
OOH
Inquiry
Rate
53
Quality
TV
GRP
83
Volume
AFF
Click
91
Volume
MOB
Avg Session
Length
105
Quality
SEO
Direct
Visit
110
Volume
SOC
Click
115
Volume
VID
Interaction
130
Volume
WEB
Visit
136
Volume
OOH
Inquiry
153
Volume
TV
Net Reach
82
Volume
DPL
Cost per
Click
98
Efficiency
MOB
Active
Users
102
Volume
SEO
Organic
Visit
111
Volume
SOC
Comment
120
Volume
VID
View
131
Volume
WEB
Visitor
137
Volume
PR
Response
Sentiment
158
Quality
RAD
Inquiry
162
Volume
TV
Cost per
Inquiry
167
Efficiency
TV
Inquiry
Rate
87
Quality
TV
TRP
84
Volume
DPL
Avg Interact
Time
96
Quality
MOB
Session
103
Volume
SEO
Referral
Visit
112
Volume
SOC
Consumption
116
Volume
VID
View
Time
132
Volume
DM
Cost per
Response
148
Efficiency
PR
Inbound
Traffic
156
Volume
DPL
Click
93
Volume
MOB
Usage
Time
104
Volume
SOC
Cost per
Click
125
Efficiency
SOC
Favorite
119
Volume
WEB
Avg Time
on Site
142
Quality
DM
Response
Rate
43
Quality
PR
Social
Mention
157
Volume
TV
Inquiry
165
Volume
DPL
Interaction
94
Volume
SEM
Cost per
Click
108
Efficiency
SOC
Cost per
Engmt
126
Efficiency
SOC
Like
118
Volume
WEB
Bounce
Rate
141
Quality
DM
Response
146
Volume
PRT
Cost per
Inquiry
161
Efficiency
CRM
Cost per
Lead
171
Efficiency
DPL
Interaction
Time
95
Volume
SEM
Click
Share
109
Share
SOC
Cost per
View
127
Efficiency
SOC
Reply
121
Volume
WEB
Pages per
Visit
143
Quality
EVT
Cost per
Lead
152
Efficiency
PRT
Inquiry
Rate
66
Quality
CRM
Avg Lead
Score
169
Quality
EM
Click Rate
15
Quality
SEM
Click
106
Volume
SOC
Avg View
Percentage
122
Quality
SOC
Video View
117
Volume
WEB
Traffic
Share
145
Share
EVT
Avg Lead
Score
150
Quality
PRT
Inquiry
159
Volume
CRM
Lead
168
Volume
EM
Click
99
Volume
SEO
Bounce
Rate
113
Quality
SOC
Response
Sentiment
123
Quality
VID
Cost per
Click
135
Efficiency
WEB
Action
140
Volume
EVT
Lead
149
Volume
RAD
Cost per
Inquiry
164
Efficiency
AFF
ROI
176
Efficiency
DPL
Conversion
Rate
97
Quality
EM
Revenue
184
Volume
SEM
Conversion
Rate
107
Quality
VID
Cost per
Action
205
Efficiency
WEB
Conversion
Rate
144
Quality
EVT
Cost per
Close
218
Efficiency
OOH
Conversion
Rate
154
Quality
RAD
Cost per
Order
230
Efficiency
TV
Conversion
232
Volume
AFF
Avg Order
Value
174
Quality
DPL
Conversion
178
Volume
MOB
Cost per
Install
191
Efficiency
SEM
Revenue
193
Volume
VID
ROI/ROAS
206
Efficiency
WEB
Conversion
207
Volume
EVT
ROI
219
Efficiency
OOH
Conversion
220
Volume
RAD
Media
Efficiency
231
Efficiency
TV
Revenue
233
Volume
AFF
Conversion
Rate
92
Quality
DPL
Revenue
179
Volume
MOB
Avg Rev
per User
190
Quality
SOC
Cost per
Action
200
Efficiency
VID
Avg Order
Value
204
Quality
WEB
Revenue
208
Volume
EVT
Close
Rate
217
Quality
OOH
Revenue
221
Volume
RAD
Conversion
Rate
163
Quality
CRM
Cost per
Conversion
239
Efficiency
AFF
Conversion
172
Volume
EM
Cost per
Action
186
Efficiency
MOB
Conversion
188
Volume
SOC
ROI/ROAS
201
Efficiency
VID
Conversion
Rate
134
Quality
DM
Cost per
Order
213
Efficiency
EVT
Qual Rate
151
Quality
PRT
Cost per
Order
226
Efficiency
RAD
Conversion
228
Volume
CRM
ROI
240
Efficiency
EM
ROI
187
Efficiency
MOB
Revenue
189
Volume
SOC
Avg Order
Value
199
Quality
VID
Conversion
202
Volume
DM
ROI
214
Efficiency
EVT
Conversion
215
Volume
PRT
Media
Efficiency
227
Efficiency
RAD
Revenue
229
Volume
CRM
Close
Rate
238
Quality
AFF
Revenue
173
Volume
SEM
Conversion
192
Volume
DPL
Cost per
Action
181
Efficiency
EM
Avg Order
Value
185
Quality
SEM
Cost per
Action
195
Efficiency
SOC
Conversion
Rate
124
Quality
VID
Revenue
203
Volume
DM
Conversion
Rate
147
Quality
EVT
Revenue
216
Volume
PRT
Conversion
Rate
160
Quality
TV
Cost per
Order
234
Efficiency
CRM
Qual Rate
170
Quality
EM
Subscription
Rate
242
Quality
EM
Net
Subscription
241
Volume
MOB
Retention
Rate
243
Quality
SOC
Cost per
Follow
248
Efficiency
SOC
Cost per
Page Like
247
Efficiency
SOC
Channel
Subscription
246
Volume
SOC
Follow
245
Volume
SOC
Page Like
244
Volume
WEB
Repeat
Visit Rate
250
Quality
WEB
Repeat
Visit
249
Volume
CRM
CLV
256
Quality
CRM
Customer
Effort
255
Quality
CRM
Customer
Satisfaction
254
Quality
CRM
Retention
Rate
253
Quality
CRM
Program
Signup
251
Volume
CRM
Repeat
Purchase
252
Volume
SOC
Re-Share
260
Volume
SOC
Retweet
259
Volume
SOC
Share
258
Volume
SOC
Storyteller
257
Volume
WEB
Content
Share
261
Volume
CRM
NPS
263
Quality
CRM
Referral
262
Volume
AFF
Commission
Rate
177
Efficiency
DPL
ROI/ROAS
182
Efficiency
EM
Conversion
Rate
101
Quality
SEM
ROI/ROAS
196
Efficiency
SOC
Conversion
197
Volume
DM
Conversion
211
Volume
OOH
Cost per
Order
222
Efficiency
PRT
Conversion
224
Volume
TV
Media
Efficiency
235
Efficiency
CRM
Conversion
236
Volume
AFF
Cost per
Action
175
Efficiency
DPL
Avg Order
Value
180
Quality
EM
Conversion
183
Volume
SEM
Avg Order
Value
194
Quality
SOC
Revenue
198
Volume
WEB
Avg Order
Value
210
Quality
DM
Revenue
212
Volume
OOH
Media
Efficiency
223
Efficiency
PRT
Revenue
225
Volume
TV
Conversion
Rate
166
Quality
CRM
Revenue
237
Volume
WEB
Items
Purchased
209
Volume
Awareness
(1 - 90)
Engagement
(91 - 171)
Conversion
(172 - 240)
Loyalty
(241 - 256)
Advocacy
(257 - 263)
Objective
(Index)
Volume
Reach
2 AFF Channel
Color =
Objective
Signal
Name
Index
Signal Type
Channel Abbreviations:
DPL - Display
SEM - Paid Search
SEO - Organic Search
SOC - Social
WEB - Website
EM - Email
VID - Video
MOB - Mobile
AFF - Affiliate
TV - Television
PRT - Print
DM - Direct Mail
OOH - Out-of-home
RAD - Radio
EVT - Event
PR - Public Relations
CRM - CRM and Loyalty
© Origami Logic, Inc. 2015 origamilogic.com
A Visualization of the Marketing Signals Framework
Periodic Table of Marketing Signals