Sept21 board hearing_plasticspresentation_de_gver2
•Download as PPT, PDF•
0 likes•1,446 views


Recommended
Recommended
More Related Content
What's hot
What's hot (9)
Viewers also liked
Similar to Sept21 board hearing_plasticspresentation_de_gver2
Similar to Sept21 board hearing_plasticspresentation_de_gver2 (20)
More from Greg Gearheart
More from Greg Gearheart (20)
Recently uploaded
Recently uploaded (20)
Sept21 board hearing_plasticspresentation_de_gver2
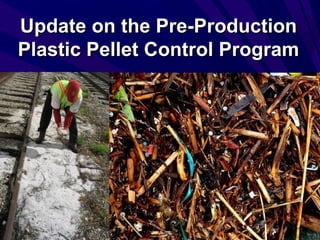
- 1. Update on the Pre-ProductionUpdate on the Pre-Production Plastic Pellet Control ProgramPlastic Pellet Control Program
- 3. Recent Legislation / Background AB 258 - CA Water Code 13367AB 258 - CA Water Code 13367 – Applies to facilities in California that manufacture,Applies to facilities in California that manufacture, handle, or transport preproduction plastics.handle, or transport preproduction plastics. – Discharge of preproduction plastics is determined byDischarge of preproduction plastics is determined by the California Legislature to be a threat to the state’sthe California Legislature to be a threat to the state’s marine environment.marine environment. – Potential sources of preproduction plastics in thePotential sources of preproduction plastics in the environment are manufacturers, transporters,environment are manufacturers, transporters, warehousers, processors, and recyclers.warehousers, processors, and recyclers. January 2009 - Kickoff of our Plastics ProgramJanuary 2009 - Kickoff of our Plastics Program
- 4. California Water Board Activities to Address Plastics Consumer Sources of Plastic DebrisConsumer Sources of Plastic Debris – Total Maximum Daily Loads (TMDLs)Total Maximum Daily Loads (TMDLs) – Municipal Storm Water PermitsMunicipal Storm Water Permits Industrial Sources of Plastic DebrisIndustrial Sources of Plastic Debris – Preproduction Plastic Debris ProgramPreproduction Plastic Debris Program – Industrial Storm Water PermitsIndustrial Storm Water Permits
- 5. Plastics Program Staff Greg GearheartGreg Gearheart: Industrial Unit Chief: Industrial Unit Chief Dominic GregorioDominic Gregorio: Ocean Unit Chief: Ocean Unit Chief Emily SiegelEmily Siegel: Scientist, Ocean Unit: Scientist, Ocean Unit Dylan SeidnerDylan Seidner: Scientist, Industrial Unit: Scientist, Industrial Unit Chris HaynesChris Haynes: Engineer, Industrial Unit: Engineer, Industrial Unit
- 6. 2009 Baseline Pellet Project Why:Why: The State Water Resources Control Board (SWRCB) and theThe State Water Resources Control Board (SWRCB) and the Regional Water Quality Control Boards are required by AB 258Regional Water Quality Control Boards are required by AB 258 (2007) to implement a program for the control of discharges of(2007) to implement a program for the control of discharges of preproduction plastic pellets from point and nonpoint sources.preproduction plastic pellets from point and nonpoint sources. Problem:Problem: Knowledge of the distribution and amount of plasticKnowledge of the distribution and amount of plastic pellets on beaches in California is limited but crucial to mplementingpellets on beaches in California is limited but crucial to mplementing a plan to control and reduce the discharges of plastic pellets.a plan to control and reduce the discharges of plastic pellets. Goal:Goal: Conduct a baseline study to determine the distribution andConduct a baseline study to determine the distribution and amounts of plastic pellets on beaches throughout California.amounts of plastic pellets on beaches throughout California.
- 7. Open Coastal Samples Only Wrack line Mid beach First barrier, back beach
- 9. First Year Statewide Draft Pellets Results Total Amount of Pellets at California Beaches: 118,705,732 Weighted Mean (per m2 ) : 3.76 The amount of pellets and trash in this study, while significant, were relatively less compared to the amounts recorded for the 1998 Orange County study; this most likely reflected the smaller sample sizes in high pellet/trash areas and the inclusion of sample sites in low pellet/trash areas.
- 11. Pellets: First Year Draft Results by Region North-Central RegionsNorth-Central Regions 1010 83,65383,653 Southern RegionsSouthern Regions 442442 118,622,079118,622,079 RWQCB Total Density (m-2 ) % of Total Los Angeles (4) 287 63 Santa Ana (8) 137 30 San Diego (9) 17 4 San Francisco (2) 9 2 North Coast (1) 1 <1 Total 451 100 * Zero pellets recovered in Central Coast (RWQCB 3) Total Density (m-2 ) Est. Number of Pellets
- 12. Pellets: First Year Draft Results by County County Total Density (m-2 ) % of Total Los Angeles 281 62 Orange 137 30 San Diego 17 4 San Francisco 9 2 Ventura River 6 1 Sonoma 1 <1 Total 451 100 * Coastal counties with zero pellets recovered: Del Norte, Humboldt, Marin, Mendocino, Monterey, San Luis Obispo, San Mateo, Santa Barbara, Santa Cruz, Sonoma
- 13. Trash: Rapid Debris AssessmentTrash: Rapid Debris Assessment Transect from wrack line to first barrierTransect from wrack line to first barrier Field data entry sheet withField data entry sheet with standardized categoriesstandardized categories
- 14. Trash: Statewide Draft Results by Category Category Total Count (Est. for CA) Foamed Plastics 350,846 Plastics 331,641 Organics/Vegetation 50,827 Paper 19,692 Glass 7,376 Other 6,397 Land Use Materials* 6,253 Rubber 4,451 Metals 2,419 Total Debris 779,902 * e.g. lumber, concrete
- 15. Trash: Statewide Draft Results by Region Region Estimated Number Los Angeles 1,470,280 Santa Ana 290,103 San Diego 95,746 San Francisco 91,966 Central Coast 68,339 North Coast 30,409
- 16. Conclusions of First Year Baseline Pellet Study First state-wide study of it’s kind revealed:First state-wide study of it’s kind revealed: – Distribution of plastic pellets along California beachesDistribution of plastic pellets along California beaches corresponds with locations of plastic facilitiescorresponds with locations of plastic facilities – Trash more ubiquitous throughout the state, though appears toTrash more ubiquitous throughout the state, though appears to correspond with regional population densitiescorrespond with regional population densities Beach debris assessments often relied upon as the bestBeach debris assessments often relied upon as the best glimpse of estimated debris quantities in the ocean, andglimpse of estimated debris quantities in the ocean, and are thus invaluable for state, national and internationalare thus invaluable for state, national and international management effortsmanagement efforts
- 17. Next Step for Pellet Monitoring Near Term: Initiate focused monitoring at areasNear Term: Initiate focused monitoring at areas determined to have high concentrations ofdetermined to have high concentrations of plastic pellets:plastic pellets: – Southern CASouthern CA – SF Bay AreaSF Bay Area • Bay was under-represented in statewide work to dateBay was under-represented in statewide work to date Longer Term: Recommendation to repeat:Longer Term: Recommendation to repeat: – Focused monitoring to understand the effectivenessFocused monitoring to understand the effectiveness of regulatory actionsof regulatory actions – Statewide monitoring to understand trendsStatewide monitoring to understand trends
- 18. Preproduction plastic pellets are small (1- 5mm) pellet shaped pieces of plastic that are melted or molded to create most common plastic goods such as food and beverage containers, bags, shrink wrap, and toys – On average, 1 pound of preproduction plastic contains approximately 22,000 pellets. – A 1992 study by the EPA estimated 60 billion pounds of plastic resin is produced in the US per year What are preproduction plastic pellets?
- 19. Why focus on pellets? Pellets are released from an identifiable source (plastic industrial sites) Reasons for release are easily correctable – Usually result from poor pellet handling or housekeeping practices
- 20. Preproduction Plastic Debris Program Outreach & Education – Web page with program information and links to educational resources – Fliers and educational materials for zero pellet loss programs distributed to regional board staff and facilities – Creation of a stakeholder work group comprised of storm water professionals, plastic industry representatives, and environmental organizations – Informational presentations created and given to MS4 inspectors, water interest groups and schools
- 21. Preproduction Plastic Debris Program Compliance Self-Audit for Enrolled Plastics Facilities – In 2009 the State Water Board staff developed an online compliance self-audit for plastic facilities enrolled in the Industrial General Permit (IGP, State Water Board Order No. 97-03-DWQ) – The goal of this project was to characterize enrolled facilities in terms of types of debris and products, transport and shipping of these materials, and common BMP and storm water (SW) management practices in place. – Results should help to focus State Water Board and MS4 SW inspection efforts, help to ID potential non-filers, and guide program efforts.
- 22. Compliance Self-Audit Responses Of the 438 returned audits, 235 (54%) were involved with preproduction plastic 87% of responses indicated they were a facility that consumed and processed preproduction plastics – Others produced, transported or recycled these products The most commonly consumed format was a plastic pellet (41%), followed by plastic powders (17%) Respondents used a total of 2.4 billion pounds of preproduction plastics per year, an average of 10.2 million pounds per facility 87% were unfamiliar with industry sponsored zero pellet loss efforts
- 23. Preproduction Plastic Debris Program Identification of Major Sources – Transportation – railroad, truck and cargo ships – Manufacturing – consumers of pellets Inspections and Enforcement – Inspections – over 60 facility inspections since January 2009 – Enforcement - we have issued over 10 NOVs, 2 CAOs and hundreds of staff enforcement letters for facilities failing to comply
- 24. Current Enforcement Initiative – Bag/FilmCurrent Enforcement Initiative – Bag/Film Focus on Bag/Film ManufacturersFocus on Bag/Film Manufacturers – They represent a large amount of all pellets consumedThey represent a large amount of all pellets consumed – They tend to have no food/medical standards to protect with finalThey tend to have no food/medical standards to protect with final product – i.e., tend to be more messyproduct – i.e., tend to be more messy – They move around quite easily and a large number of them areThey move around quite easily and a large number of them are nonfilersnonfilers 428 bag/film facilities statewide428 bag/film facilities statewide Ranked using facility size, rail access and proximity toRanked using facility size, rail access and proximity to receiving water factorsreceiving water factors Inspected 100% of top rank (34 facilities)Inspected 100% of top rank (34 facilities) Enforcement follow-up on 100% of the noncompliantEnforcement follow-up on 100% of the noncompliant facilitiesfacilities
- 25. Enforcement ActivitiesEnforcement Activities Northern CA TaskforceNorthern CA Taskforce – Office of Enforcement, Region 2, SW, Fish and GameOffice of Enforcement, Region 2, SW, Fish and Game – Three Plastic Bag and Film Manufacture and one BumperThree Plastic Bag and Film Manufacture and one Bumper manufacturemanufacture – Issued NOV’s and CAO’s requiring Permit Coverage, On siteIssued NOV’s and CAO’s requiring Permit Coverage, On site cleanup and cleanup of Oyster Baycleanup and cleanup of Oyster Bay – Likely ACLLikely ACL Southern CA TaskforceSouthern CA Taskforce – Office of Enforcement, Regions 4, 8, and 9, and SWOffice of Enforcement, Regions 4, 8, and 9, and SW – 4 facilities each in Regions 4 and 8 and possibly 1 in Region 94 facilities each in Regions 4 and 8 and possibly 1 in Region 9 – Investigations On going to support possible CAO’s and otherInvestigations On going to support possible CAO’s and other enforcementenforcement